. 2024 Dec 1;109(12):4007-4020.
doi: 10.3324/haematol.2023.284672.

Core regions in immunoglobulin heavy chain enhancers essential for survival of non-Hodgkin lymphoma cells are identified by a CRISPR interference screen

Affiliations

Core regions in immunoglobulin heavy chain enhancers essential for survival of non-Hodgkin lymphoma cells are identified by a CRISPR interference screen

Marta Elżbieta Kasprzyk et al. Haematologica. .

Abstract

Chromosomal translocations in non-Hodgkin lymphoma (NHL) result in activation of oncogenes by placing them under the regulation of immunoglobulin heavy chain (IGH) super-enhancers. Aberrant expression of translocated oncogenes induced by enhancer activity can contribute to lymphomagenesis. The role of the IGH enhancers in normal B-cell development is well established, but knowledge regarding the precise mechanisms of their involvement in control of the translocated oncogenes is limited. The goal of this project was to define the critical regions in the IGH regulatory elements and identify enhancer RNA (eRNA). We designed a single guide RNA library densely covering the IGH enhancers and performed tiling CRISPR interference screens in three NHL cell lines. This revealed three regions crucial for NHL cell growth. With chromatin- enriched RNA sequencing we showed transcription from the core enhancer regions and subsequently validated expression of the eRNA in a panel of NHL cell lines and tissue samples. Inhibition of the essential IGH enhancer regions decreased expression of eRNA and translocated oncogenes in several NHL cell lines. The observed expression and growth patterns were consistent with the breakpoints in the IGH locus. Moreover, targeting the Eμ enhancer resulted in loss of B-cell receptor expression. In a Burkitt lymphoma cell line, MYC overexpression partially rescued the phenotype induced by IGH enhancer inhibition. Our results indicated the most critical regions in the IGH enhancers and provided new insights into the current understanding of the role of IGH enhancers in B-cell NHL. As such, this study forms a basis for development of potential therapeutic approaches.


Figures
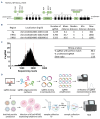
Figure 1.
Figure 1.
Design and generation of a tiling CRISPR interference library targeting IGH enhancers. (A) Scheme of the human immunoglobulin heavy chain (IGH) locus. Green boxes represent the IGH enhancers: two 3’ regulatory regions (3’RR), which are composed of smaller enhancers (HS), and the intronic enhancer Eµ, composed of the core and two matrix attachment regions (MAR). Black boxes represent immunoglobulin genes: C – constant, J – joining, D – diverse, V – variable. (B) Summary of the single guide (sg)RNA distribution in the CRISPR-eIGH library. Note that since 3’RR1 and 3’RR2 are highly similar, 2,344 sgRNA are common for both regions. (C) sgRNA abundance in the CRISPR-eIGH library obtained with next-generation sequencing (NGS). Red dotted lines indicate the 10th (left) and 90th (right) percentiles. (D) Overview of the CRISPR interference screen experiment.
Figure 2.
Figure 2.
Tiling CRISPR interference screen of the IGH enhancers in B-cell non-Hodgkin lymphoma cells. (A) CRISPR interference screen results. Scatterplots represent changes of single guide (sg)RNA abundance relative to the initial pool in two screen replicates for each cell line. Numbers in the bottom left corner indicate the total number of sgRNA in the given cell line that were consistently >2-fold depleted from the initial pool. Black dots represent sgRNA targeting immunoglobulin heavy chain (IGH) enhancers, gray dots represent non-targeting (NT) controls, and red dots represent positive controls targeting CD79. (B) Fold change values of 20 consecutive sgRNA calculated using the sliding window approach. Colored boxes mark regions identified as essential for cell survival. For EΜ: chr14:106328838-106329184, pink box, 3’RR1 and 3’RR2: chr14:106152156-106153203 and chr14:106032312-106033352, blue box – peak 1, chr14:106162681-106163347 and chr14:106041116-106041795, green box - peak 2. (C, D) Green fluorescent protein (GFP) growth competition assay. Assays performed with individual sgRNA over the course of 3 weeks in Burkitt lymphoma (C) and diffuse large B-cell lymphoma (D) cell lines. Average and standard deviation from three independent biological replicates are shown. *P≤0.05, **P≤0.01, ***P≤0.001, mixed model analysis. (E) Localization of breakpoints in the IGH locus for cell lines used in this study. Red: Burkitt lymphoma cell lines; purple: diffuse large B-cell lymphoma cell lines.
Figure 3.
Figure 3.
Transcriptional activity of IGH enhancers. (A) Chromatin-enriched RNA-sequencing results for immunoglobulin heavy chain (IGH) enhancer regions accompanied by UCSC tracks from GM12878 B cells: transcription and histone marks: H3K4me1 and H3K27ac (characteristic for enhancer regions) and H3K4me3 (characteristic for promoters and active genes). Red indicates reads from the plus strand, blue indicates reads from the minus strand. Pink: Eμ peak; blue: 3’RR peak 1; green: 3’RR peak 2. (B) Cellular localization of eRNA transcripts determined by cellular fractionation. Average and standard deviation from two biological replicates are shown. (C) Validation of eRNA expression in a panel of B-cell lymphoma cell lines and control B cells: Burkitt lymphoma (BL) N=9; diffuse large B-cell lymphoma (DLBCL) N=12: activated B-cell subtype (ABC) N=5, germinal center B-cell subtype (GCB) N=7; Hodgkin lymphoma (HL) N=8; control (germinal center B cells) N=4. Expression normalized to TBP. Analysis of variance (ANOVA) Kruskall-Wallis with Dunn multiple comparison post-test was applied; *P≤0.05, **P≤0.01; ***P≤0.001. (D) Validation of eRNA expression in patient-derived formalin-fixed paraffin-embedded samples: BL N=8; DLBCL N=13: ABC N=7, GCB N=6; control (healthy donor tonsil) N=6. Expression normalized to TBP. ANOVA Kruskall-Wallis with Dunn multiple comparison post-test was applied. *P≤0.05, **P≤0.01.
Figure 4.
Figure 4.
Downstream effects of targeting IGH enhancers. (A) Expression of oncogenes involved in immunoglobulin heavy chain (IGH) translocation, MYC (DG75, BL41) or BCL2 (SUDHL4) and expression of eRNA upon blocking IGH enhancer essential regions on a RNA level determined by real-time quantitative polymerase chain reaction. Mean and standard deviation of three independent biological replicates are shown. Expression normalized to HPRT. *P≤0.05, **P≤0.01; ***P≤0.001, Mann-Whitney test. (B) Immunostaining of B-cell receptor (BCR) on cell surface in DG75, BL41 (IgM) and SUDHL4 (IgG) cell lines. Representative histograms of overlaid data for non-targeting (NT) controls (gray) and single guide (sg)RNA targeting IGH-enhancer essential regions (pink, Eμ peak; blue, 3’RR peak 1; green, 3’RR peak 2). Arrows indicate samples from a separate staining in SUDHL4. (C) Average and standard deviation of percentage of BCR-positive cells (surface IgM or IgG) from two biological replicates. *P≤0.05, **P≤0.01; ***P≤0.001, ****P≤0.0001, Student two-tailed t test.
Figure 5.
Figure 5.
MYC overexpression rescues cell viability in the Burkitt lymphoma cell line DG75 upon inhibition of IGH enhancer-essential regions. (A) Overview of the MYC-rescue experiment. (B, C) Viability of the DG75-MYC overexpressing cell line (B) and a control cell line DG75-EV (C) transduced with single guide (sg)RNA targeting immunoglobulin heavy chain (IGH) enhancers and treated or not with doxycycline to induce MYC expression. Average and standard deviation from three independent biological replicates are shown. *P≤0.05, **P≤0.01, Student t test.

Similar articles

Cited by

References

    1. Thandra KC, Barsouk A, Saginala K, Padala SA, Barsouk A, Rawla P. Epidemiology of non-Hodgkin’s lymphoma. Med Sci (Basel). 2021;9(1):5. - PMC - PubMed
    1. Sedeta E, Ilerhunmwuwa N, Wasifuddin M, et al. . Epidemiology of non-Hodgkin lymphoma: global patterns of incidence, mortality, and trends. Blood. 2022;140(Supplement 1):5234-5235.
    1. Küppers R, Dalla-Favera R. Mechanisms of chromosomal translocations in B cell lymphomas. Oncogene. 2001;20(40):5580-5594. - PubMed
    1. Ahmadi SE, Rahimi S, Zarandi B, Chegeni R, Safa M. MYC: a multipurpose oncogene with prognostic and therapeutic implications in blood malignancies. J Hematol Oncol. 2021;14(1):121. - PMC - PubMed
    1. Klanova M, Klener P. BCL-2 proteins in pathogenesis and therapy of B-cell non-Hodgkin lymphomas. Cancers (Basel). 2020;12(4):938. - PMC - PubMed

MeSH terms

Substances