. 2025 Nov 1;20(11):3302-3316.
doi: 10.4103/NRR.NRR-D-23-01876. Epub 2024 Jun 26.

Spatial transcriptomics combined with single-nucleus RNA sequencing reveals glial cell heterogeneity in the human spinal cord

Affiliations

Spatial transcriptomics combined with single-nucleus RNA sequencing reveals glial cell heterogeneity in the human spinal cord

Yali Chen et al. Neural Regen Res. .

Abstract

JOURNAL/nrgr/04.03/01300535-202511000-00032/figure1/v/2024-12-20T164640Z/r/image-tiff Glial cells play crucial roles in regulating physiological and pathological functions, including sensation, the response to infection and acute injury, and chronic neurodegenerative disorders. Glial cells include astrocytes, microglia, and oligodendrocytes in the central nervous system, and satellite glial cells and Schwann cells in the peripheral nervous system. Despite the greater understanding of glial cell types and functional heterogeneity achieved through single-cell and single-nucleus RNA sequencing in animal models, few studies have investigated the transcriptomic profiles of glial cells in the human spinal cord. Here, we used high-throughput single-nucleus RNA sequencing and spatial transcriptomics to map the cellular and molecular heterogeneity of astrocytes, microglia, and oligodendrocytes in the human spinal cord. To explore the conservation and divergence across species, we compared these findings with those from mice. In the human spinal cord, astrocytes, microglia, and oligodendrocytes were each divided into six distinct transcriptomic subclusters. In the mouse spinal cord, astrocytes, microglia, and oligodendrocytes were divided into five, four, and five distinct transcriptomic subclusters, respectively. The comparative results revealed substantial heterogeneity in all glial cell types between humans and mice. Additionally, we detected sex differences in gene expression in human spinal cord glial cells. Specifically, in all astrocyte subtypes, the levels of NEAT1 and CHI3L1 were higher in males than in females, whereas the levels of CST3 were lower in males than in females. In all microglial subtypes, all differentially expressed genes were located on the sex chromosomes. In addition to sex-specific gene differences, the levels of MT-ND4 , MT2A , MT-ATP6 , MT-CO3 , MT-ND2 , MT-ND3 , and MT-CO2 in all spinal cord oligodendrocyte subtypes were higher in females than in males. Collectively, the present dataset extensively characterizes glial cell heterogeneity and offers a valuable resource for exploring the cellular basis of spinal cord-related illnesses, including chronic pain, amyotrophic lateral sclerosis, and multiple sclerosis.


Conflict of interest statement

Conflicts of interest: The authors declare that they have no conflict of interest.

Figures

Figure 1
Figure 1
Identification of cell types in the human spinal cord. (A) tSNE plot showing eight major cell types of the spinal cord. Dots indicate individual cells; colors indicate cell type. (B) Proportions of each cell type. (C) Relative expression levels of representative marker genes across all cell types. (D, F, H) Representative spinal cord sections showing the spatial distributions of astrocytes (D), microglia (F), and Oligo (H). (E, G, I) Representative immunofluorescence images of GFAP (red, Alexa Fluor® 488; E), Iba1 (red, CyTM3; G), and MBP (red, CyTM3; I) in coronal cryosections of lumber spinal cord. Scale bars: 1 mm. Iba1: Ionized calcium-binding adapter molecule 1; GFAP: glial fibrillary acidic protein; MBP: myelin basic protein; Oligo: oligodendrocytes; tSNE: t-distributed stochastic neighbor embedding.
Figure 2
Figure 2
Identification of glial subtypes in the human spinal cord. (A) UMAP plot showing six clusters of human astrocytes. Dots indicate individual cells; colors indicate astrocyte clusters. (B) Dot plot showing the expression of the top four differentially expressed genes (DEGs) across all astrocyte clusters. (C) UMAP plot showing the expression of well-known representative marker genes of human astrocytes. (D) UMAP plot showing six clusters of human microglia. Dots indicate individual cells; colors indicate microglial clusters. (E) Dot plot showing the expression of the top four DEGs across all microglial clusters. (F) UMAP plot showing the expression of well-known representative marker genes of human microglia. (G) UMAP plot showing six clusters of human oligodendrocytes. Dots indicate individual cells; colors indicate oligodendrocyte clusters. (H) Dot plot showing the expression of the top four DEGs across all oligodendrocyte clusters. (I) UMAP plot showing the expression of well-known representative marker genes of human oligodendrocytes. Oligo: Oligodendrocytes; UMAP: Uniform Manifold Approximation and Projection.
Figure 3
Figure 3
Identification of glial subtypes in the mouse spinal cord. (A) UMAP plot showing five clusters of mouse astrocytes. Dots indicate individual cells; colors indicate astrocyte clusters. (B) Dot plot showing the expression of the top four differentially expressed genes (DEGs) across all astrocyte clusters. (C) UMAP plot showing the expression of well-known representative marker genes of mouse astrocytes. (D) UMAP plot showing four clusters of mouse microglia. Dots indicate individual cells; colors indicate microglial clusters. (E) Dot plot showing the expression of the top four DEGs across all microglial clusters. (F) UMAP plot showing the expression of well-known representative marker genes of mouse microglia. (G) UMAP plot showing five clusters of mouse oligodendrocytes. Dots indicate individual cells; colors indicate oligodendrocyte clusters. (H) Dot plot showing the expression of the top four DEGs across all oligodendrocyte clusters. (I) UMAP plot showing the expression of well-known representative marker genes of mouse oligodendrocytes. Oligo: Oligodendrocytes; UMAP: Uniform Manifold Approximation and Projection.
Figure 4
Figure 4
Overview of interactions among spinal glial cells. (A) Intercellular communication network, reflecting the numbers of interactions between clusters of spinal glial cell subtypes. (B) Total intensity of interactions among spinal glial cells. (C) Dot plot showing the strength of incoming and outgoing interactions of each cell type, as defined by the comprehensive communication probability between the signal sending/target cells and all cell types. (D) Outgoing signaling patterns of spinal glial cell subtypes. (E) Incoming signaling patterns of spinal glial cell subtypes. Oligo: Oligodendrocytes.
Figure 5
Figure 5
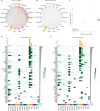
Spatial distribution of various glial cell subtypes in the human spinal cord. (A–F) Representative spinal cord sections showing the spatial distributions of astrocyte C1 (A), C2 (B), C3 (C), C4 (D), C5 (E), and C6 (F). (G, N, U) Gene set variation analysis (GSVA) showing the spatial distribution patterns of astrocytic clusters (G), microglial clusters (N), and oligodendrocyte clusters (U) in different subregions of coronal sections from the lumber spinal cord. (H–M) Representative spinal cord sections showing the spatial distributions of microglial C1 (H), C2 (I), C3 (J), C4 (K), C5 (L), and C6 (M). (O–T) Representative spinal cord sections showing the spatial distributions of oligodendrocyte C1 (O), C2 (P), C3 (Q), C4 (R), C5 (S), and C6 (T). C: Cluster; DD: deep dorsal horn; GSVA: gene set variation analysis; Oligo: oligodendrocytes; SD: superficial dorsal horn; V: ventral horn.
Figure 6
Figure 6
Expressional profiles of classical marker genes in spinal glial cells. (A) UMAP plot showing the co-clustering of astrocytes between humans and mice. (B–G) Normalized mean expression of classical marker genes encoding ion channels (B, C), neurotransmitter receptors (D, E), and transcription factors and neuropeptides (F, G) in human and mouse astrocytes. (H) UMAP plot showing the co-clustering of microglia between humans and mice. (I–N) Normalized mean expression of classic marker genes encoding ion channels (I, J), neurotransmitter receptors (K, L), and transcription factors and neuropeptides (M, N) in human and mouse astrocytes. (O) UMAP plot showing the co-clustering of oligodendrocytes between humans and mice. (P–U) Normalized mean expression of classic marker genes encoding ion channels (P, Q), neurotransmitter receptors (R, S), and transcription factors and neuropeptides (T, U) in human and mouse astrocytes. Oligo: Oligodendrocytes; UMAP: Uniform Manifold Approximation and Projection.
Figure 7
Figure 7
Expressional profiles of disease-risk genes in spinal glial cells. (A, B) Transcriptional profiles of risk genes for neuropathic pain (A) and inflammatory pain (B) in human and mouse astrocytes. (C, D) Transcriptional profiles of risk genes for neuropathic pain (C) and inflammatory pain (D) in human and mouse microglia. (E, F) Transcriptional profiles of risk genes for neuropathic pain (E) and inflammatory pain (F) in human and mouse oligodendrocytes. Oligo: Oligodendrocytes.
Figure 8
Figure 8
Functional assignments of glial clusters. (A, B) Summarized Gene Ontology (GO) terms for the enriched genes of human (A) and mouse (B) astrocytes. (C, D) Summarized GO terms for the enriched genes of human (C) and mouse (D) microglia. (E, F) Summarized GO terms for the enriched genes of human (E) and mouse (F) oligodendrocytes. GO: Gene Ontology; Oligo: oligodendrocytes.
Figure 9
Figure 9
Sex differences in gene expression of human spinal glial cells. (A–I) Volcano plots showing genes with differential expression between males and females in the following all spinal astrocytes (A), spinal astrocytes C1 (B), spinal astrocytes C4 (C), all spinal microglia (D), spinal microglial C1 (E), spinal microglial C6 (F), all spinal oligodendrocytes (G), spinal oligodendrocytes C4 (H), and spinal oligodendrocytes C6 (I). Genes were considered to be differentially expressed based on log fold change (FC) ≥ 1.33 and an adjusted P value < 0.05. C: Cluster; Oligo: oligodendrocytes; NS: no significance.

Similar articles

Cited by

References

    1. Alberini CM, Cruz E, Descalzi G, Bessières B, Gao V. Astrocyte glycogen and lactate: new insights into learning and memory mechanisms. Glia. 2018;66:1244–1262. - PMC - PubMed
    1. Allen NJ, Lyons DA. Glia as architects of central nervous system formation and function. Science. 2018;362:181–185. - PMC - PubMed
    1. Brockie S, Zhou C, Fehlings MG. Resident immune responses to spinal cord injury: role of astrocytes and microglia. Neural Regen Res. 2024;19:1678–1685. - PMC - PubMed
    1. Clark AK, Yip PK, Grist J, Gentry C, Staniland AA, Marchand F, Dehvari M, Wotherspoon G, Winter J, Ullah J, Bevan S, Malcangio M. Inhibition of spinal microglial cathepsin S for the reversal of neuropathic pain. Proc Natl Acad Sci U S A. 2007;104:10655–10660. - PMC - PubMed
    1. Colonna M, Butovsky O. Microglia function in the central nervous system during health and neurodegeneration. Annu Rev Immunol. 2017;35:441–468. - PMC - PubMed

LinkOut - more resources