

A transit-amplifying progenitor with biphasic behavior contributes to epidermal renewal
- PMID: 38934416
- PMCID: PMC11234368
- DOI: 10.1242/dev.202389
A transit-amplifying progenitor with biphasic behavior contributes to epidermal renewal
Abstract
Transit-amplifying (TA) cells are progenitors that undergo an amplification phase followed by transition into an extinction phase. A long postulated epidermal TA progenitor with biphasic behavior has not yet been experimentally observed in vivo. Here, we identify such a TA population using clonal analysis of Aspm-CreER genetic cell-marking in mice, which uncovers contribution to both homeostasis and injury repair of adult skin. This TA population is more frequently dividing than a Dlx1-CreER-marked long-term self-renewing (e.g. stem cell) population. Newly developed generalized birth-death modeling of long-term lineage tracing data shows that both TA progenitors and stem cells display neutral competition, but only the stem cells display neutral drift. The quantitative evolution of a nascent TA cell and its direct descendants shows that TA progenitors indeed amplify the basal layer before transition and that the homeostatic TA population is mostly in extinction phase. This model will be broadly useful for analyzing progenitors whose behavior changes with their clone age. This work identifies a long-missing class of non-self-renewing biphasic epidermal TA progenitors and has broad implications for understanding tissue renewal mechanisms.
Keywords: Lineage tracing; Mathematical modeling; Mouse; Skin; Stem cells; Transit-amplifying progenitor.
© 2024. Published by The Company of Biologists Ltd.
Conflict of interest statement
Competing interests The authors declare no competing or financial interests.
Figures
 is the fraction of clones with size ≤n, where
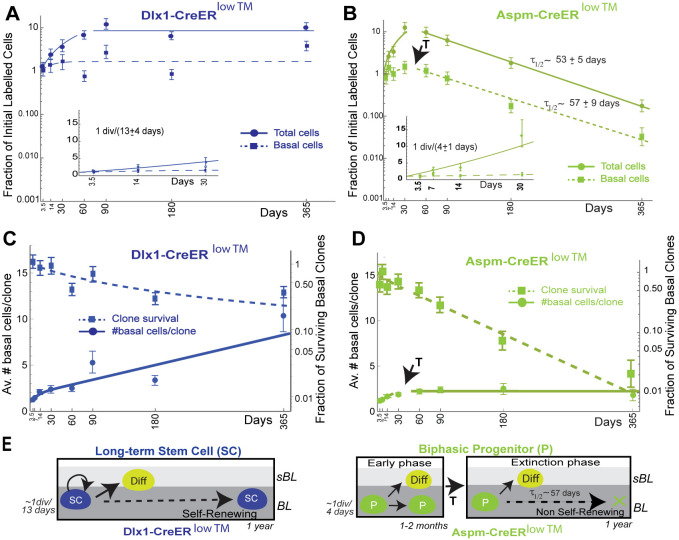
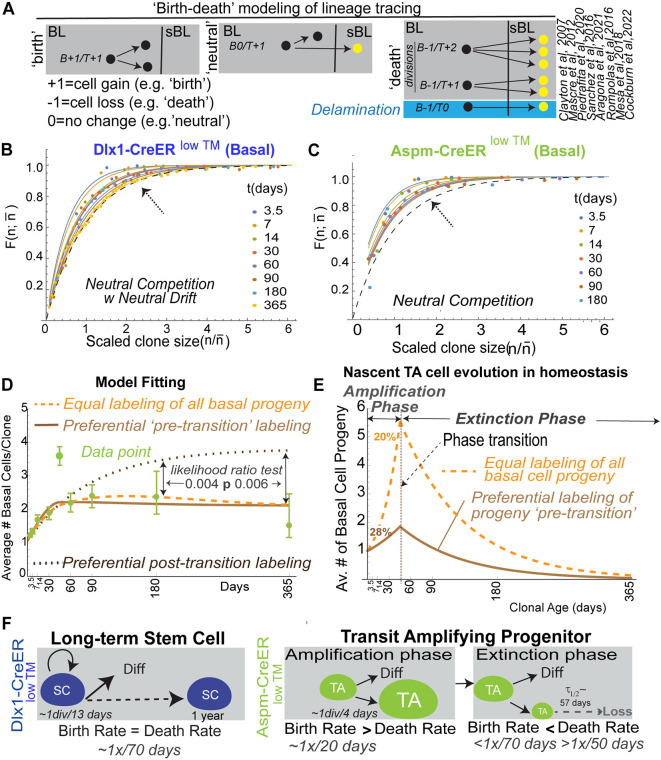
  . is the average clone size at the specified chase-time. Dots indicate experimental values. Solid lines are the neutral competition predictions of Eq. 2. The dashed black lines (identified by arrows) mark the asymptotic ‘neutral drift’ limit of Eq. 1, which is reached by the large Dlx1-CreERlow TM-marked clones but not by the Aspm-CreERlow TM-marked clones. (D) Basal labeled cell fraction (Fig. 4B) and basal labeled clone size data (Fig. 4D) were used together to compute the best-fits for Aspm-CreERlow TM progenitor birth and death rates, with a transition time at 45 days (supplementary Materials and Methods, ‘Analysis of Lineage Tracing Data’). The predictions for three models encompassing potential CreER labeling biases are compared with the data (see Fig. S10 for model-predicted labeled BL cell fractions). Likelihood ratio tests reject the ‘post-transition’ cell labeling model, which is equivalent to a monophasic model, with (1−P-value) confidence levels of >0.994. (E) Predicted average number of BL Aspm-CreERlow TM cells descended from a single nascent cell as a function of clone age (i.e. time nascent cell introduction of the clone's nascent cell founder) for the models indicated. The amount of pre-transition progenitor amplification and the percentage of cells in the amplification phase during homeostasis are shown for the two labeling models that are consistent with the data. (F) Summary of stem and progenitor cell behavior during homeostasis of adult epidermis.
Similar articles
-
Interfollicular epidermal homeostasis: dicing with differentiation.Exp Dermatol. 2012 Apr;21(4):249-53. doi: 10.1111/j.1600-0625.2012.01447.x. Exp Dermatol. 2012. PMID: 22417300 Review.
-
Homeostatic Epidermal Stem Cell Self-Renewal Is Driven by Local Differentiation.Cell Stem Cell. 2018 Nov 1;23(5):677-686.e4. doi: 10.1016/j.stem.2018.09.005. Epub 2018 Sep 27. Cell Stem Cell. 2018. PMID: 30269903 Free PMC article.
-
Characterization of Skin Interfollicular Stem Cells and Early Transit Amplifying Cells during the Transition from Infants to Young Children.Int J Mol Sci. 2024 May 22;25(11):5635. doi: 10.3390/ijms25115635. Int J Mol Sci. 2024. PMID: 38891823 Free PMC article.
-
A single type of progenitor cell maintains normal epidermis.Nature. 2007 Mar 8;446(7132):185-9. doi: 10.1038/nature05574. Epub 2007 Feb 28. Nature. 2007. PMID: 17330052
-
Tiers of clonal organization in the epidermis: the epidermal proliferation unit revisited.Stem Cell Rev. 2008 Sep;4(3):149-57. doi: 10.1007/s12015-008-9020-6. Stem Cell Rev. 2008. PMID: 18574734 Review.
References
-
- Bowling, S., Sritharan, D., Osorio, F. G., Nguyen, M., Cheung, P., Rodriguez-Fraticelli, A., Patel, S., Yuan, W. C., Fujiwara, Y., Li, B. E.et al. (2020). An engineered CRISPR-Cas9 mouse line for simultaneous readout of lineage histories and gene expression profiles in single cells. Cell 181, 1410-1422.e27. 10.1016/j.cell.2020.04.048 - DOI - PMC - PubMed
MeSH terms
Grants and funding
LinkOut - more resources
Full Text Sources
Medical
Molecular Biology Databases
