. 2024 Jul 2;13(13):e033155.
doi: 10.1161/JAHA.123.033155. Epub 2024 Jun 27.

P53 Activation Promotes Maturational Characteristics of Pluripotent Stem Cell-Derived Cardiomyocytes in 3-Dimensional Suspension Culture Via FOXO-FOXM1 Regulation

Affiliations

P53 Activation Promotes Maturational Characteristics of Pluripotent Stem Cell-Derived Cardiomyocytes in 3-Dimensional Suspension Culture Via FOXO-FOXM1 Regulation

Nivedhitha Velayutham et al. J Am Heart Assoc. .

Abstract

Background: Current protocols generate highly pure human induced pluripotent stem cell-derived cardiomyocytes (hiPSC-CMs) in vitro that recapitulate characteristics of mature in vivo cardiomyocytes. Yet, a risk of arrhythmias exists when hiPSC-CMs are injected into large animal models. Thus, understanding hiPSC-CM maturational mechanisms is crucial for clinical translation. Forkhead box (FOX) transcription factors regulate postnatal cardiomyocyte maturation through a balance between FOXO and FOXM1. We also previously demonstrated that p53 activation enhances hiPSC-CM maturation. Here, we investigate whether p53 activation modulates the FOXO/FOXM1 balance to promote hiPSC-CM maturation in 3-dimensional suspension culture.

Methods and results: Three-dimensional cultures of hiPSC-CMs were treated with Nutlin-3a (p53 activator, 10 μM), LOM612 (FOXO relocator, 5 μM), AS1842856 (FOXO inhibitor, 1 μM), or RCM-1 (FOXM1 inhibitor, 1 μM), starting 2 days after onset of beating, with dimethyl sulfoxide (0.2% vehicle) as control. P53 activation promoted hiPSC-CM metabolic and electrophysiological maturation alongside FOXO upregulation and FOXM1 downregulation, in n=3 to 6 per group for all assays. FOXO inhibition significantly decreased expression of cardiac-specific markers such as TNNT2. In contrast, FOXO activation or FOXM1 inhibition promoted maturational characteristics such as increased contractility, oxygen consumption, and voltage peak maximum upstroke velocity, in n=3 to 6 per group for all assays. Further, by single-cell RNA sequencing of n=2 LOM612-treated cells compared with dimethyl sulfoxide, LOM612-mediated FOXO activation promoted expression of cardiac maturational pathways.

Conclusions: We show that p53 activation promotes FOXO and suppresses FOXM1 during 3-dimensional hiPSC-CM maturation. These results expand our understanding of hiPSC-CM maturational mechanisms in a clinically-relevant 3-dimensional culture system.

Keywords: FOXM1; FOXO; cardiomyocytes; maturation; p53; stem cells.


Figures
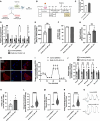
Figure 1
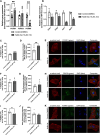
Figure 1. p53 activation with Nutlin‐3a enhances maturation of human induced pluripotent stem cell–derived cardiomyocytes (hiPSC‐CMs).
(A) Schematic of mechanism of Nutlin‐3a on p53 activation. (B) Treatment protocol for Nutlin‐3a. (C) Mean fluorescence intensity of p53‐AF594 by flow cytometry with Nutlin‐3a treatment compared with control (DMSO), n=3 samples, represented as mean±SEM. (D) RNA expression of selected cardiac genes by quantitative polymerase chain reaction (qPCR), normalized to TBP then control, *P<0.05, **P<0.01 by Mann–Whitney unpaired t test, n=6 samples for all conditions, represented as mean±SEM. (E) Mean fluorescence intensity (MFI) of TNNT2‐BV421 and (F) % of live cells expressing TNNT2 by flow cytometry. **P<0.01 by Mann–Whitney unpaired t‐test, n=6 samples for all conditions, represented as mean±SEM. (G) Beat amplitude by multielectrode array (MEA) analysis. **P<0.01 by Mann–Whitney unpaired t‐test, control (DMSO) n=12 samples, Nutlin‐3a n=9 samples, represented as mean±SEM. (H) Representative hiPSC‐CMs treated with control (DMSO) or Nutlin‐3a in 3‐dimensional culture, then replated to glass slides in 2‐dimensional monolayer culture after completion of treatment. Immunostaining for α‐actinin (red) and DAPI (blue). Gibco hiPSC‐CMs (n=3) were used for immunostaining experiments. (I) Oxygen consumption rate (OCR) profile and (J) OCR parameters, quantified by Seahorse Mito Stress Test. *P<0.05, **P<0.01 by 2‐way ANOVA with Sidak's multiple comparisons test, control (DMSO) n=10, Nutlin‐3a n=20 wells, represented as mean±SEM. (K) % of TNNT2+ hiPSC‐CMs expressing Kir2.1 by flow cytometry. n=5 samples for all conditions. (L) Voltage peak amplitude, (M) voltage peak max upstroke, and (N) voltage peak max downstroke velocity, by VALA kinetic image cytometer. ****P<0.0001 by unpaired t test, control (DMSO) n=254 cells, Nutlin‐3a n=676 cells, represented as mean±SEM. (O) Representative electrical tracings by VALA kinetic image cytometer of hiPSC‐CMs treated control (DMSO) or Nutlin‐3a in 3‐dimensional culture, then replated in 2‐dimensional monolayer culture after completion of treatment, from n=3 independent wells per group. UCSD hiPSC‐CMs with %TNNT2+ cells >75% by flow cytometry were used for all experiments unless noted otherwise.
Figure 2
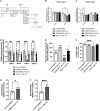
Figure 2. p53 activation with Nutlin‐3a enhances Forkhead box (FOX) O activity and suppresses FOXM1 in human induced pluripotent stem cell–derived cardiomyocytes (hiPSC‐CMs).
(A) RNA expression of FOXO1, FOXO3, and FOXM1 by quantitative polymerase chain reaction (qPCR), normalized to TBP, then control. **P<0.01 by Mann–Whitney unpaired t test, n=6 samples for all groups, represented as mean±SEM. (B) RNA expression of selected FOX targets with Nutlin‐3a treatment by qPCR, normalized to TBP, then control. n=3 samples for all conditions, represented as mean±SEM. UCSD hiPSC‐CMs with %TNNT2+ cells >85% by flow cytometry in both groups. (C) Percentage of live TNNT2+ cells expressing FOXO1 and (D) mean fluorescence intensity (MFI) of FOXO1‐AF790 by flow cytometry at 24 h of treatment. **P<0.01 by Mann–Whitney unpaired t‐test (n=5 samples for all conditions, represented as mean±SEM). 1016 hiPSC‐CMs. (E) Representative hiPSC‐CMs treated with DMSO (control) or Nutlin‐3a in 2‐dimensional monolayer culture at 3 h. Immunostaining for alpha actinin (red), FOXO1 (green), and DAPI (blue). Gibco hiPSC‐CMs. (F) % of live TNNT2+ cells expressing FOXO3 and (G) mean fluorescence intensity (MFI) of FOXO3‐AF680 by flow cytometry at 24 h of treatment. n=5 samples for all conditions, represented as mean±SEM. 1016 hiPSC‐CMs. (H) Representative hiPSC‐CMs treated with DMSO (control) or Nutlin‐3a in 2‐dimensional monolayer culture at 3 h of treatment. Immunostaining for alpha actinin (red), FOXO3 (green), and DAPI (blue). Gibco hiPSC‐CMs. (I) % of live TNNT2+ cells expressing FOXM1 and (J) mean fluorescence intensity (MFI) of FOXM1‐PE by flow cytometry at 48 h of treatment. *P<0.05 by Mann–Whitney unpaired t‐test (n=5 samples for all conditions, represented as mean±SEM). 1016 hiPSC‐CMs. (K) Representative hiPSC‐CMs treated with DMSO (control) or Nutlin‐3a in 2‐dimensional monolayer culture at 48 h of treatment. Immunostaining for alpha actinin (red), FOXM1 (green), and DAPI (blue). Scale bar 10 μm. UCSD hiPSC‐CMs with TNNT2+ live cells >75% were used for all flow cytometry and qPCR experiments. Gibco hiPSC‐CMs with TNNT2+ live cells >75% were used for all immunostaining experiments.
Figure 3
Figure 3. Forkhead box (FOX) O activation in human induced pluripotent stem cell–derived cardiomyocytes (hiPSC‐CMs) to determine shifts in cell populations compared with DMSO controls, by single cell RNAseq.
(A) Uniform manifold approximation and projection (UMAP) plot of cells harvested on day 11 of differentiation following treatment with vehicle control (DMSO, 0.2%) or LOM612 (5 μM) for 2 d, n=2 per group, UCSD hiPSC‐CMs. (B) UMAP plot showing alignment of DMSO vs LOM612 groups. (C) UMAP plot showing distinct cell clusters 0 to 14 identified in DMSO‐ and LOM612‐treated hiPSC‐CMs by single cell RNA sequencing. (D) Dot plot of marker genes for various cell types to determine cell cluster identities. (E) UMAP plot showing clustering of different cardiomyocyte and non‐cardiomyocyte cell types in DMSO and LOM612 treated hiPSC‐CMs. UMAP plots of selected marker gene expression for (F) cardiomyocytes (ACTC1), (G) pacemaker precursor cells (SHOX2), (H) endothelial cells (PECAM1), (I) fibroblasts (COL3A1), (J) nervous system cells (PLP1), and (K) hepatocytes (APOA2).
Figure 4
Figure 4. Comparison of cardiomyocyte clusters enriched upon Forkhead box (FOX) O activation compared with cardiomyocyte clusters enriched in vehicle (DMSO)‐treated cells by single cell RNA sequencing analysis.
(A) Uniform manifold approximation and projection (UMAP) plot of cardiomyocyte population only, identified in LOM612 vs DMSO (control) groups, n=2, UCSD human induced pluripotent stem cell–derived cardiomyocytes (hiPSC‐CMs). (B) UMAP plot showing sub‐clustering analysis for cardiomyocyte populations in hiPSC‐CMs. (C) Dot plot of marker genes for atrial and ventricular cardiomyocyte identities. (D) Bar graph of relative proportion percentages of hiPSC‐CMs in each cardiomyocyte subtype cluster. (E) Principal component analysis of LOM612 vs DMSO (control) groups in cardiomyocyte cluster 1. (F) Correlation heatmap analysis of LOM612 vs DMSO (control) groups in cardiomyocyte cluster 1. (G) Top significant biological process terms by gene ontology analysis of significantly differentially expressed genes, in LOM612 group compared with DMSO (control) group, in cardiomyocyte cluster 1. (H) Volcano plot of top significant differentially expressed genes in LOM612 group compared with DMSO (control) group, in cardiomyocyte cluster 1. (I) Principal component analysis of LOM612 vs DMSO (control) groups in cardiomyocyte cluster 2. (J) Correlation heatmap analysis of LOM612 vs DMSO (control) groups in cardiomyocyte cluster 2. (K) Top significant biological process terms by gene ontology analysis of significantly differentially expressed genes, in LOM612 group compared with DMSO (control) group, in cardiomyocyte cluster 2. (L) Volcano plot of top significant differentially expressed genes in LOM612 group compared with DMSO (control) group, in cardiomyocyte cluster 2.
Figure 5
Figure 5. Forkhead box (FOX) O activation or FOXM1 inhibition improves contractility of human induced pluripotent stem cell–derived cardiomyocytes (hiPSC‐CMs).
(A) Treatment protocol and schematic for mechanism of LOM612, AS1842856, and RCM‐1. RNA expression of (B) FOXO targets SOD1 and SOD2 and (C) FOXM1 targets CCNB1 and CCND1, by quantitative polymerase chain reaction (qPCR), normalized to TBP, then control. *P<0.05 by Kruskal–Wallis multiple comparisons 1‐way ANOVA test, n=3 samples for all conditions, represented as mean±SEM. (D) RNA expression of selected sarcomere genes MYH6, MYH7, TNNT2, and TNNI3 by quantitative polymerase chain reaction (qPCR), normalized to TBP, then control. **P<0.01, ***P<0.001 by Kruskal–Wallis multiple comparisons 1‐way ANOVA test, n=6 samples for all conditions, represented as mean±SEM. (E) Mean fluorescence intensity (MFI) of TNNT2‐BV421 and (F) % of live cells expressing TNNT2 by flow cytometry. ****P<0.0001 by 1‐way ANOVA with Dunnett's multiple comparisons test, n=6 samples for all conditions, represented as mean±SEM. (G) Beat amplitude by multielectrode array (MEA) analysis of hiPSC‐CMs treated with DMSO (control) or LOM612 in 3‐dimensional culture, then replated in 2‐dimensional monolayer culture after completion of treatment, normalized to control. *P<0.05 by Mann–Whitney test, n=8 samples for all conditions, represented as mean±SEM. (H) Beat amplitude by multielectrode array (MEA) analysis of hiPSC‐CMs treated with DMSO (control) or RCM‐1 in 3‐dimensional culture, then replated in 2‐dimensional monolayer culture after completion of treatment, normalized to control. ****P<0.0001 by Mann–Whitney test, n=8 samples for all conditions, represented as mean±SEM. UCSD hiPSC‐CMs with %TNNT2+ cells >75% by flow cytometry were used in all experiments.
Figure 6
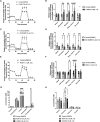
Figure 6. Forkhead box (FOX) O activation or FOXM1 inhibition improves electrophysiological properties of human induced pluripotent stem cell–derived cardiomyocytes (hiPSC‐CMs).
(A) RNA expression of selected ion channels by quantitative polymerase chain reaction (qPCR), normalized to TBP then control. *P<0.05 by Kruskal‐Wallis multiple comparisons 1‐way ANOVA test, n=3 samples for all conditions, represented as mean±SEM. (B) Mean fluorescence intensity (MFI) of Kir2.1‐FITC and (C) % of live TNNT2+ cells expressing Kir2.1 by flow cytometry. *P<0.05, **P<0.01 by ordinary 1‐way ANOVA with Dunnett's multiple comparisons test, n=3 samples for all conditions, represented as mean±SEM. (D) Voltage peak amplitude, (E) voltage peak max upstroke, and (F) voltage peak max downstroke velocity by VALA kinetic image cytometer. *P<0.05, ****P<0.0001 by ordinary 1‐way ANOVA with Dunnett's multiple comparisons test, DMSO n=112 cells, LOM612 n=75 cells, RCM‐1 n=430 cells, AS1842856 n=10 cells, represented as mean±SEM, derived from n=3 independent wells for each group. 1016 hiPSC‐CMs with %TNNT2+ cells >75% by flow cytometry. (G) Representative electrical tracings by VALA kinetic image cytometer of hiPSC‐CMs treated with DMSO (control), (H) LOM612, (I) AS1842856, or (J) RCM‐1 in 3‐dimensional culture, then replated in 2‐dimensional monolayer culture after completion of treatment. UCSD hiPSC‐CMs with %TNNT2+ cells >75% by flow cytometry were used in all experiments, unless noted otherwise.
Figure 7
Figure 7. Forkhead box (FOX) O activation or FOXM1 inhibition improves metabolic properties of human induced pluripotent stem cell–derived cardiomyocytes (hiPSC‐CMs).
(A) Oxygen consumption rate (OCR) profile and (B) OCR parameters quantified by Seahorse Mito Stress Test and normalized to control. hiPSC‐CMs were treated with DMSO (control) or LOM612 (5 μM, 2 d) in 3‐dimensional culture, then replated in 2‐dimensional monolayer culture after completion of treatment. **P<0.01, ****P<0.0001 by 2‐way ANOVA with Sidak's multiple comparisons test, DMSO n=10, LOM612 n=12 samples, represented as mean±SEM. (C) OCR profile and (D) OCR parameters quantified by Seahorse Mito Stress Test and normalized to control. hiPSC‐CMs were treated with DMSO (control) or AS1842856 (1 μM, 5 d) in 3‐dimensional culture then replated in 2‐dimensional monolayer culture after completion of treatment. *P<0.05, **P<0.01, by 2‐way ANOVA with Sidak's multiple comparisons test, DMSO n=11, AS1842856 n=16 samples, represented as mean±SEM. (E) OCR profile and (F) OCR parameters quantified by Seahorse Mito Stress Test and normalized to control. hiPSC‐CMs were treated with DMSO (control) or RCM‐1 (1 μM, 5 d) in 3‐dimensional culture then replated in 2‐dimensional monolayer culture after completion of treatment. *P<0.05, ****P<0.0001 by 2‐way ANOVA with Sidak's multiple comparisons test, DMSO n=37, RCM‐1 n=36 samples, represented as mean±SEM. UCSD hiPSC‐CMs with %TNNT2+ cells >90% by flow cytometry in both groups. UCSD hiPSC‐CMs with %TNNT2+ cells >75% by flow cytometry were used for all Seahorse experiments. Concentration of (G) selected metabolites and (H) amino acids by nuclear magnetic resonance (NMR) in conditioned media. *P<0.05, **P<0.01, ***P<0.001 by 2‐way ANOVA with Sidak's multiple comparisons test, n=3 samples for all conditions, represented as mean±SEM in 1016 hiPSC‐CMs.

References

    1. Gomez‐Garcia MJ, Quesnel E, Al‐Attar R, Laskary AR, Laflamme MA. Maturation of human pluripotent stem cell derived cardiomyocytes in vitro and in vivo. Semin Cell Dev Biol. 2021;118:163–171. doi: 10.1016/j.semcdb.2021.05.022 - DOI - PubMed
    1. Hu D, Linders A, Yamak A, Correia C, Kijlstra JD, Garakani A, Xiao L, Milan DJ, van der Meer P, Serra M, et al. Metabolic maturation of human pluripotent stem cell‐derived cardiomyocytes by inhibition of HIF1alpha and LDHA. Circ Res. 2018;123:1066–1079. doi: 10.1161/CIRCRESAHA.118.313249 - DOI - PMC - PubMed
    1. Yang X, Rodriguez ML, Leonard A, Sun L, Fischer KA, Wang Y, Ritterhoff J, Zhao L, Kolwicz SC Jr, Pabon L, et al. Fatty acids enhance the maturation of cardiomyocytes derived from human pluripotent stem cells. Stem Cell Rep. 2019;13:657–668. doi: 10.1016/j.stemcr.2019.08.013 - DOI - PMC - PubMed
    1. Ni X, Xu K, Zhao Y, Li J, Wang L, Yu F, Li G. Single‐cell analysis reveals the purification and maturation effects of glucose starvation in hiPSC‐CMs. Biochem Biophys Res Commun. 2021;534:367–373. doi: 10.1016/j.bbrc.2020.11.076 - DOI - PubMed
    1. Nakano H, Minami I, Braas D, Pappoe H, Wu X, Sagadevan A, Vergnes L, Fu K, Morselli M, Dunham C, et al. Glucose inhibits cardiac muscle maturation through nucleotide biosynthesis. elife. 2017;6:e29330. doi: 10.7554/eLife.29330 - DOI - PMC - PubMed

MeSH terms