. 2024 Sep 2;221(9):e20232068.
doi: 10.1084/jem.20232068. Epub 2024 Jun 27.

Dynamic Foxp3-chromatin interaction controls tunable Treg cell function

Affiliations

Dynamic Foxp3-chromatin interaction controls tunable Treg cell function

Minghong He et al. J Exp Med. .

Abstract

Nuclear factor Foxp3 determines regulatory T (Treg) cell fate and function via mechanisms that remain unclear. Here, we investigate the nature of Foxp3-mediated gene regulation in suppressing autoimmunity and antitumor immune response. Contrasting with previous models, we find that Foxp3-chromatin binding is regulated by Treg activation states, tumor microenvironment, and antigen and cytokine stimulations. Proteomics studies uncover dynamic proteins within Foxp3 proximity upon TCR or IL-2 receptor signaling in vitro, reflecting intricate interactions among Foxp3, signal transducers, and chromatin. Pharmacological inhibition and genetic knockdown experiments indicate that NFAT and AP-1 protein Batf are required for enhanced Foxp3-chromatin binding in activated Treg cells and tumor-infiltrating Treg cells to modulate target gene expression. Furthermore, mutations at the Foxp3 DNA-binding domain destabilize the Foxp3-chromatin association. These representative settings delineate context-dependent Foxp3-chromatin interaction, suggesting that Foxp3 associates with chromatin by hijacking DNA-binding proteins resulting from Treg activation or differentiation, which is stabilized by direct Foxp3-DNA binding, to dynamically regulate Treg cell function according to immunological contexts.


Conflict of interest statement

Disclosures: The authors declare no competing interests exist.

Figures

None
Graphical abstract
Figure S1.
Figure S1.
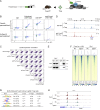
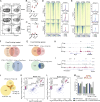
Assessment of Foxp3 and GFP antibodies for cellular staining and CUT&RUN-seq. (A) Schematic binding of Foxp3 and GFP antibodies in Treg cells isolated from Foxp3gfp knock-in mice expressing an N-terminal GFP:Foxp3 fusion protein. (B) Comparison of Foxp3 and GFP antibodies with flow cytometric staining of Treg cells isolated from Foxp3gfp mice. Cells were permeabilized with or without fixation before antibody staining. Data represent more than three experiments. (C) Cross-comparison of the CUT&RUN-seq results generated with rTreg and aTreg cells from Foxp3gfp mice and with anti-GFP and anti-Foxp3 (FJK-16s) antibodies. Two replicates per condition are shown. (D) Foxp3 peaks at the Il10 locus in rTreg and aTreg cells revealed by CUT&RUN-seq using anti-GFP and anti-Foxp3 (FJK-16s) antibodies as described above. Arrowheads indicate increased Foxp3 binding in aTreg cells. Data represent two replicates. (E) Co-immunoprecipitation of Ets1 and Foxp3 in in vitro induced Treg cells. (F) A heatmap showing Foxp3 and Ets1 binding in Treg cells after CRISPR deletion of Ets1. NC, non-targeting negative control sgRNA. (G) DNA sequence motifs for transcription factors enriched at the regions with reduced Foxp3 binding (P < 0.05) after Ets1 CRISPR knockout (sgEts1) in Treg cells. (H) Foxp3 and Ets1 peaks at the Ikzf4 locus in Treg cells that received retroviral sgEts1 or sgNC. Data are representative of two replicates. Source data are available for this figure: SourceData FS1.
Figure 1.
Figure 1.
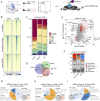
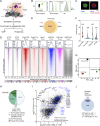
Characterization of Foxp3 chromatin-binding modes during Treg cell activation. (A) rTreg (CD44loCD62Lhi) and aTreg (CD44hiCD62Llo) cells were sorted to examine Foxp3–chromatin binding with CUT&RUN-seq or CUT&Tag-seq. Treg cells were gated to show CD44 and CD62L expression as well as Foxp3 protein levels after sorting. (B) A heatmap of Foxp3 CUT&RUN-seq showing three types of differential Foxp3 binding in aTreg and rTreg cells: increased (Up; P < 0.05, FC ≥ 2), constitutive (Cons; P > 0.5, 0.95 < FC < 1.05), and decreased (Down; P < 0.05, FC ≤ −2). Peak intensities were merged from two biological replicates. (C) Genomic distribution of Foxp3 peaks. Dis, distal regions (50 kb 5′ upstream or 3′ downstream); TES, transcription end sites. (D) Numbers of genes (with examples) associated with constitutive, increased (Up), and decreased (Down) Foxp3 binding in aTreg versus rTreg cells. These genes are defined by the nearest Foxp3 peaks to their transcription start sites. (E) Cross-comparison of gene expression (mRNA) and Foxp3–chromatin binding in aTreg and rTreg cells. Genes with significant changes (FC ≥ 2, FDR < 0.05) of both expression and Foxp3 binding are highlighted. Data were derived from two replicates per condition. (F) Distributions of Foxp3-binding modes (Up, Cons, Down, Other undetermined, and No binding) linked to differentially expressed genes (DEGs) in aTreg and rTreg cells defined in E. (G–I) Distribution of DEGs in aTreg and rTreg cells linked to Foxp3-binding modes: Cons (G), Up (H), and Down (I). For simplicity, only Treg-specific genes (i.e., P < 0.05 and |log2FC| > 0.58 between rTreg versus Tn cells or between aTreg versus Te cells) related to different Foxp3-binding modes are shown.
Figure 2.
Figure 2.
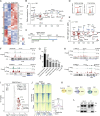
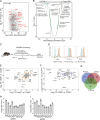
Constitutive Foxp3–chromatin binding regulates the basal function of Treg cells. (A) Expression patterns of genes with comparable expression levels in aTreg and rTreg cells defined in Fig. 1 G. Z scores of two biological replicates across samples are shown. (B) Ratios of gene expression levels of indicated clusters in published “wannabe” Treg cells and WT Treg cells isolated from heterozygous female mice (van der Veeken et al., 2020). Genes whose expression significantly changed (P ≤ 0.05) in wannabe Treg cells are highlighted: red, decreased; blue, increased. Ctla4 and Il2ra serve as controls. (C) Schematic of Foxp3 CRISPR deletion in nTreg cells. Treg cells were sorted from Foxp3gfp RosaCas9 mice. Cells were harvested on day 7 for RNA-seq. (D) Foxp3 expression in Treg cells transduced with negative control (NC) or Foxp3 sgRNAs. Data represent more than three experiments. (E) Ratios of gene expression of indicated clusters in sgFoxp3- and sgNC-transduced Treg cells. Genes whose expression significantly changed (P ≤ 0.05) are highlighted. Data were derived from two replicates per condition. Ctla4 and Il2ra are controls. (F) Foxp3 peaks at the Ikzf4 and Lrrc32 loci in rTreg and aTreg cells. Con., DNA sequence conservation in placental mammals. Data are representative of two replicates. (G) Functional annotation of selected genes (clusters C1–C3) linked to constitutive Foxp3 binding. (H) Foxp3 peaks at the Il2ra and Ctla4 loci. Empty arrowheads indicate constitutive Foxp3 binding, and filled arrowheads indicate increased Foxp3 binding in aTreg versus rTreg cells. Data are representative of two replicates. (I) DNA sequence motifs of transcription factors enriched at constitutive Foxp3-binding sites. (J and K) Comparison of Foxp3 and Ets1 peaks. Ets1 ChIP-seq data in bulk Treg cells are from Samstein et al. (2012). (L) Coimmunoprecipitation of Ets1 and Foxp3 in nTreg cells expanded in vitro for 7 days. Note: IgG and Ets1 bands partially overlap. Source data are available for this figure: SourceData F2.
Figure 3.
Figure 3.
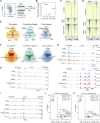
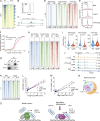
Dynamic Foxp3 binding regulates tunable gene expression in aTreg cells. (A) Expression patterns of genes that are upregulated and linked to increased Foxp3–chromatin binding in aTreg versus rTreg cells are defined in Fig. 1 H. (B) Functional annotation of genes in clusters C3–C5. Neg, negative. Proc, process. (C) Ratios of gene expression levels in resting and activated wannabe Treg and WT Treg cells (van der Veeken et al., 2020). (D) Schematic procedures of Foxp3 CRISPR deletion and restimulation of Treg cells by anti-CD3 and anti-CD28 antibodies. Treg cells were sorted from Foxp3gfp RosaCas9 mice. (E) Ratios of gene expression levels in Cas9-expressing Treg cells that received retroviral sgFoxp3 and sgNC with or without TCR/costimulation. Data are averages of two replicates. (F) Normalized expression levels of Klrg1, Tnfrsf8, and Tnfrsf9 in rTreg cells, aTreg cells, and activated and resting wannabe Treg cells (van der Veeken et al., 2020). CPM, count per million. Unpaired, two-tailed t tests; ***P < 0.001, ****P < 0.0001. n = 3 replicates. (G) Expression levels of indicated genes in sgNC- and sgFoxp3-transduced Treg cells with or without TCR restimulation. n = 2 replicates. (H) Cross-comparison of Treg and Tcon cells for genes that are downregulated and linked to decreased Foxp3–chromatin binding in aTreg cells versus rTreg cells defined in Fig. 1 I. (I) Foxp3 binding at the Gata1 locus in rTreg and aTreg cells. Data are representative of two replicates. Filled arrowhead indicates decreased Foxp3 binding in aTreg cells. (J) Comparison of Foxp3–chromatin binding and ATAC-seq in rTreg and aTreg cells. Data were derived from two replicates; P values represent unpaired, two-sample Wilcoxon tests.
Figure S2.
Figure S2.
Assessment of the role of dynamic Foxp3–chromatin binding in regulating gene expression. (A) Ratios of gene expression levels (assessed by RNA-seq) in resting and activated wannabe and Treg cells (van der Veeken et al., 2020) for gene clusters defined in (Fig. 3 H). Genes whose expression was significantly changed in wannabe Treg cells are highlighted (red, decreased; blue, increased). (B) Ratios of gene expression levels in Treg cells with or without Foxp3 CRISPR deletion for gene clusters defined in (Fig. 3 H). Treg cells were treated with or without TCR agonists for 3 h before RNA-seq. Genes whose expression significantly changed after Foxp3 deletion are highlighted. Data are averages of two replicates. (C) Comparison of the expression levels of Gata1 and Pde3b in rTreg, aTreg, and resting and activated wannabe Treg cells (rWannabe and aWannabe). CPM, count per million. (D and E) DNA sequence motifs for transcription factors enriched at regions with increased (D) or decreased (E) Foxp3 binding in aTreg versus rTreg cells. (F and G) Comparison of Foxp3 binding and chromatin accessibility (ATAC-seq) in aTreg and rTreg cells. Data were merged from two replicates.
Figure 4.
Figure 4.
Acute IL-2 and TCR signaling induces dynamic Foxp3–chromatin binding. (A) Schematic procedures for IL-2 and TCR stimulations of ex vivo isolated Treg cells. The rTreg cells were FACS-sorted from lymphoid organs of Foxp3gfp-DTR mice and stimulated with plate-bound anti-CD3 and anti-CD28 antibodies (1 µg/ml each) or recombinant IL-2 (500 U/ml) for 3 h before Foxp3 CUT&RUN-seq. Flow cytometry plot is reused (Fig. 1 A). (B) Principal component analysis (PCA) of Foxp3 CUT&RUN-seq results. n = 2 replicates. (C and D) Changes in Foxp3–chromatin binding in rTreg cells after 3 h of TCR (C) or IL-2 (D) stimulation. Increased (Up) and decreased (Down) Foxp3 binding is defined by P < 0.05, FC ≥ 2; and constitutive (Cons.) Foxp3 binding, by P > 0.5, 0.95 < FC < 1.05. (E and F) Comparison of the peaks (E) and linked genes (F) of different Foxp3–chromatin binding modes in aTreg (versus rTreg) and rTreg cells after IL-2 or TCR stimulation. (G–I) Representative Foxp3 peaks at the Il10 and Ctla4 (G), Il1rl1 (H), and Bcl2 (I) loci. Arrowheads indicate sites with increased Foxp3 binding in aTreg versus rTreg cells or in rTreg cells after IL-2 or TCR stimulation. Data represent two replicates. (J and K) DNA sequence motifs for transcription factors enriched at regions with increased Foxp3 binding in rTreg cells upon TCR (J) or IL-2 (K) stimulation.
Figure 5.
Figure 5.
Tumor microenvironment remodels Foxp3–chromatin binding linked to enhanced Treg suppressive function. (A–C) CD44 and Klrg1 expression in Treg and Tcon cells isolated from spleen, MC38 tumor, and tumor-draining lymph nodes (dLN). n = 5. Data represent more than three experiments. Paired, two-tailed t tests; **P < 0.01. tuTreg cells were used for CUT&RUN-seq. (D) Regions with increased Foxp3 binding in aTreg versus rTreg cells from lymphoid organs and in tuTreg versus aTreg cells from lymphoid organs. Unique 1: increased Foxp3 binding in aTreg versus rTreg cells (P < 0.05, FC ≥ 2) but not in tuTreg versus aTreg cells; unique 2: increased Foxp3 binding in tuTreg versus aTreg cells (P < 0.05, FC ≥ 2) but not in aTreg versus rTreg cells; overlap: increased Foxp3 binding in both aTreg versus rTreg cells and in tuTreg versus aTreg cells. Two replicates were merged for analysis. (E) Regions with decreased Foxp3 binding. Unique 1: reduced Foxp3 binding in aTreg versus rTreg cells (P < 0.05, FC ≤ −2) but not in tuTreg versus aTreg cells; unique 2: reduced Foxp3 binding in tuTreg versus aTreg cells (P < 0.05, FC ≤ −2) but not in aTreg versus rTreg cells; overlap: reduced Foxp3 binding in both aTreg versus rTreg cells and in tuTreg versus aTreg cells. Differences between tuTreg and aTreg cells in unique 1 group are not statistically significant. (F and G) Peaks (F) and genes (G) linked to increased (Up) and decreased (Down) Foxp3 binding in aTreg versus rTreg cells and in tuTreg versus aTreg cells. Representative genes are shown. (H and I) Foxp3 peaks at the Klrg1 (H) and Runx2 (I) loci. Arrowheads indicate sites with increased Foxp3 binding in tuTreg cells. Data are representative of two replicates. (J) Comparison of genes linked to increased Foxp3 binding in aTreg versus rTreg, tuTreg versus aTreg, and rTreg cells after TCR stimulation in vitro. (K) DNA sequence motifs for transcription factors enriched at regions with increased Foxp3 binding in the overlap and unique groups defined in D. (L) DNA sequence motifs for transcription factors enriched at regions with decreased Foxp3 binding in aTreg versus rTreg cells and in tuTreg versus aTreg cells, respectively defined as unique 1 and unique 2 groups in E. (M) Percentages of canonical forkhead motif (FKHM) or TnG repeats enriched at Foxp3-binding sites defined in D compared with other regions (background).
Figure 6.
Figure 6.
A role of direct Foxp3-DNA binding in Foxp3–chromatin interaction. (A) Magnified structure of Foxp3ΔN-DNA complex (PDB: 7TDX) highlighting the amino acid residues interacting with DNA. Mutations in Foxp3 M2, M4, and Δα-Helix are shown. Purified recombinant proteins were resolved by SDS-PAGE and visualized by Coomassie staining. (B and C) EMSA of recombinant Foxp3ΔN proteins (0.4 and 0.8 µM) after incubation with DNA probes (0.4 µM) of inverted-repeat FKHM (B) or (T3G)6 (C). Gel was visualized by SYBR Gold nucleic acid stain. *, DNA-BMP-Foxp3ΔN complexes. (D) Representative plots showing CD2 and Foxp3 expression in activated CD4 Tn (Th0) cells transduced with full-length WT and mutant Flag-Foxp3-IRES-CD2 retrovirus. (E) Foxp3 expression levels of Foxp3+ cells described in D. n = 4 technical replicates. Data represent more than two experiments. Unpaired, two-tailed t tests; ***P < 0.001, ****P < 0.0001. (F and G) Comparison of CD25 and Foxp3 expression in Th0 cells transduced with full-length WT and mutant Flag-Foxp3-IRES-CD2 retrovirus. Anti-Flag antibody was used to assess Foxp3 expression. No, no transduction. Isotype, FITC-isotype antibody. n = 4 technical replicates. (H and I) Relationship between CTLA-4 and Foxp3 expression in Th0 cells expressing full-length WT and mutant Flag-Foxp3-IRES-CD2. n = 4 technical replicates. (J) Comparison of Foxp3 binding by CUT&RUN-seq in Th0 cells expressing full-length WT or M4 mutant Flag-Foxp3. Two replicates were merged for analysis. (K–M) Foxp3 peaks at the Il2ra (K), Ctla4 (L), and Tnfrsf9 (M) loci in Th0 cells expressing full-length WT or M4 mutant Flag-Foxp3. Data represent one of two replicates. Source data are available for this figure: SourceData F6.
Figure 7.
Figure 7.
Proximity biotinylation captures the proteins near Foxp3. (A) Schematic of the PSI of Foxp3 by proximity ligation via biotin-phenoxyl radicals. 1° Ab, primary antibody; 2° Ab, secondary antibodies; BP, biotin-phenol; HRP, horseradish peroxidase; SA, streptavidin. (B) Assessment of the specificity of Foxp3 PSI with Th0 and iTreg cells. CD4 Tn cells from Foxp3gfp mice were used to generate Th0 or iTreg cells. After PSI reaction, cells were stained with SA-AlexaFluor-568. Numbers show median fluorescence intensities (MFIs) of GFP or SA in Th0 and iTreg cells. Th0 cells, CD4 Tn cells activated by TCR agonists and IL-2 in vitro. (C) Immunofluorescence images of Treg cells from Foxp3gfp mice treated with Foxp3-PSI and subsequently stained for SA-AlexaFluor-568, GFP-booster-FITC, and Lamin-AlexaFluor-647. (D) 37,333 accessible regions (ATAC-seq) in Treg cells are cross-compared with Foxp3 PSI-ChIP, traditional (tra) Foxp3-, H3K27ac-, H3K4me3-, and H3K27me3-ChIP peaks. Traditional Foxp3, H3K27ac, H3K4me3, and H2K27me3 ChIP-seq data are from Kitagawa et al. (2017). (E) Comparison of accessible chromatin regions (ATAC-seq peaks) in iTreg and nTreg cells. (F) Comparison of the peak sizes of Foxp3 PSI-ChIP, traditional Foxp3-ChIP, H3K27ac-ChIP, and ATAC-seq. Numbers show mean fragment lengths. Data were derived from two replicates. (G) PCA of Foxp3 PSI and histone H3 PSI TMT MS results. PC1 and PC2, respectively, account for 48.9% and 27.7% of the total variations. AU, arbitrary units. (H) Fractions of proteins identified by Foxp3 or H3 PSI MS among the genes expressed in ASC-treated iTreg cells, estimated by RNA-seq (RPKM ≥ 1.0). (I) Enriched proteins identified by Foxp3-PSI in iTreg versus Th0 cells and Foxp3-PSI versus H3-PSI in iTreg cells. Blue, Foxp3 known interactors. q, FDR-adjusted P value. Histone H3 PSI was used to assess the diffusion of BP radicals. Data were derived from two replicates. (J) Comparison of proteins revealed by Foxp3-PSI versus H3-PSI MS and published Foxp3 interactors (Rudra et al., 2012).
Figure S3.
Figure S3.
Functional annotation of proteins determined by Foxp3 PSI MS. (A) Proteins differentially enriched by Foxp3 versus histone H3 PSI MS are independent of their expression levels profiled by whole-cell TMT MS. Data were derived from two to three replicates per condition. (B) Gene Ontology terms of the proteins enriched by Foxp3 and histone H3 PSI MS. (C and D) Identification of the regulators of Foxp3, CTLA-4, and CD25 expression from the proteins identified by Foxp3 PSI MS using CRISPR screening. CD4 Tn cells isolated from Foxp3gfp RosaCas9 mice were induced to iTreg cells by TCR agonists, IL-2, and TGF-β in the presence of ASC. A retroviral sgRNA library targeting 1,493 genes enriched by Foxp3 PSI MS was transduced into iTreg cells on day 3. 5 days later, cells expressing high or low levels of Foxp3, CTLA-4, or CD25 were FACS-sorted to compare sgRNA representation with high-throughput sequencing. (E–G) Cross-comparison of the regulators of Foxp3 versus CD25 expression (E) or CD25 versus CTLA-4 expression (F). Overlaps of regulators are shown (G; FDR < 0.05). Data are derived from three replicates. (H and I) Validation of top candidate regulators of Foxp3 (H) and CD25 (I) expression in Cas9-expressing iTreg cells transduced with individual sgRNAs. CD4 Tn cells isolated from Foxp3gfp RosaCas9 mice were cultured in Treg-induction media. Cells were transduced with retroviral sgRNAs at day 1 and analyzed at day 5. Data show triplicates and means ± SDs and represent two experiments. Two-tailed, unpaired t tests; ns, no significance; **P < 0. 01, ***P < 0.001, ****P < 0.0001.
Figure 8.
Figure 8.
Dynamic proteins near Foxp3 upon IL-2 and TCR signaling. (A) Schematic of dynamic proteins near Foxp3 uncovered by Foxp3 PSI coupled with TMT-based MS. (B) Proteins enriched by SA beads in iTreg cells after IL-2 or TCR stimulation and Foxp3 PSI were resolved by SDS-PAGE followed by silver staining. Arrowhead indicates released SA. (C) Differentially represented proteins revealed by Foxp3 PSI MS after 30 min of IL-2 stimulation. Data were derived from three biological replicates. (D) Phospho-Stat5 (pStat5) staining after 30 min of IL-2 stimulation of CD4 T cells isolated from Foxp3gfp mice. Data represent more than three experiments. Numbers show MFI of pStat5 signal. (E) Proteins enriched in Foxp3 PSI after IL-2 stimulation (Foxp3 PSI P < 0.01). Changes in total protein level are included as a comparison. (F) Differentially represented proteins revealed by Foxp3 PSI MS after 3 h of TCR stimulation. Data were derived from three biological replicates. (G) Changes in protein levels in Foxp3 PSI and whole-cell lysate upon TCR stimulation. (H) A summary of dynamic proteins revealed by Foxp3 PSI MS upon TCR stimulation without significant changes of their total levels (P > 0.05). Source data are available for this figure: SourceData F8.
Figure S4.
Figure S4.
IL-2 and TCR signaling induce dynamic proteins near Foxp3. (A) Overlap of the proteins identified by Foxp3 PSI MS and whole-cell lysate MS. (B) Cross-comparison of differentially represented proteins after IL-2 stimulation identified by Foxp3 PSI MS versus whole-cell lysate MS. Data were derived from two or three replicates per condition. (C) Protein and mRNA levels measured by TMT MS or RNA-seq after IL-2 stimulation. iTreg cells induced from WT CD4 Tn cells in the presence of supplemented ASC were stimulated by IL-2 for 0.5 h before being harvested for RNA-seq (n = 2 biological replicates) or whole-cell lysate TMT MS (n = 3 biological replicates). (D) Top 30 factors depleted after IL-2 signaling in Foxp3 PSI MS (Foxp3 PSI FC < 1, P < 0.01, ranked by Foxp3 PSI FC). (E and F) Protein levels measured by TMT proteomics (E) or RNA-seq (F) in iTreg cells with or without TCR stimulation. iTreg cells induced from WT CD4 Tn cells in the presence of supplemented ASC were stimulated by TCR agonists for 3 h before being harvested for whole-cell lysate TMT MS (n = 3 biological replicates) or RNA-seq (n = 2 biological replicates). (G) Western blotting of indicated proteins in the following cellular fractions: cytoplasm (Cyto.), membrane (Mem.), nuclear (Nuc.), and chromatin (Chr.). iTreg cells induced from WT CD4 Tn cells in the presence of supplemented ASC were stimulated by TCR agonists for 3 h before being harvested for western blotting. Data represent two experiments. (H) Proteins enriched and depleted in Foxp3 PSI (p for PSI < 0.01) with significant changes of their total quantities after TCR stimulation (p for total proteins < 0.05). Source data are available for this figure: SourceData FS4.
Figure 9.
Figure 9.
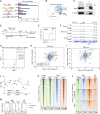
NFAT and AP-1 regulate Foxp3–chromatin binding and tunable Treg function. (A–C) Foxp3 binding in Treg cells from oil and CsA treated mice (A). Foxp3gfp mice received oil or CsA (30 mg/kg body weight) i.p. every 12 h twice. Treg cells were then sorted from spleens and lymph nodes for Foxp3 CUT&RUN-seq. Data were merged from three replicates. Foxp3 expression level was assessed in Treg cells (B). Representative Foxp3 peaks at the Il10 locus in one of three replicates are shown (C). (D and E) Comparison of Batf and Foxp3 binding and chromatin accessibility in rTreg and aTreg cells. Data were merged from two replicates. (F) Genes linked to Foxp3 and Batf binding are upregulated in aTreg cells compared with rTreg cells. Two-sample Kolmogorov–Smirnov (K–S) test. (G) Coimmunoprecipitation of Batf and Foxp3 in nTreg cells expanded in vitro for 7 days. Cells were re-stimulated by TCR agonists for 15 h before experiment. (H and I) Batf and Foxp3 binding and chromatin accessibility in Treg cells after CRISPR deletion of Batf. Unpaired two-sample Wilcoxon test. Data were derived from two replicates. (J) Foxp3 binding, chromatin-accessibility, and Batf binding at the Tnfrsf9 locus in Treg cells that received retroviral sgBatf or sgNC. Data are representative of two replicates. (K) Batf and Foxp3 peaks in Th0 cells expressing Batf (“B”), Flag-Foxp3 (“F”), or both (“B+F”). Differential Foxp3 peaks (P < 0.05, FC > 2) are shown. Data were derived from two replicates. (L and M) Relationships between CD25 (L) or CTLA-4 (M) and Flag-Foxp3 levels in Th0 cells expressing full-length Flag-Foxp3, Batf, or both (Foxp3+Batf). Anti-Flag antibody was used to assess Flag-Foxp3 expression. n = 4 replicates. Data represent two experiments. Two-way ANOVA. (N) Comparison of Batf peaks in aTreg cells (this study) and Th2 and Th17 cells (Ciofani et al., 2012; Iwata et al., 2017). (O) A hypothetical model of dynamic Foxp3–chromatin interaction. In the resting state, Foxp3 associates with chromatin via preexistent DNA-binding proteins (e.g., Ets1) to confer Treg basal function by regulating genes such as Il2ra (CD25) and Ctla4. Upon stimulation or differentiation, induced DNA-binding proteins (e.g., NFAT and AP-1) recruit Foxp3 or facilitate Foxp3–chromatin binding to regulate genes (e.g., Il10, Ctla4, and Klrg1) that enhance Treg suppression of autoimmunity and antitumor response. Direct Foxp3-DNA binding stabilizes Foxp3–chromatin interaction, although it alone is insufficient to confer stable interaction with chromatin in physiological settings. When these induced proteins degrade, Foxp3–chromatin binding and Treg function are reset to the basal level. Foxp3 complex may also be actively displaced by undetermined mechanisms. For simplicity, other Foxp3-interacting proteins are not shown. Source data are available for this figure: SourceData F9.
Figure S5.
Figure S5.
NFAT and AP-1 regulate Foxp3–chromatin binding. (A) DNA sequence motifs for transcription factors enriched at regions with significantly decreased Foxp3 binding (P < 0.05, FC > 2) in Treg cells from CsA-treated mice. (B) Peaks of Foxp3, Batf, and ATAC-seq that are significantly increased (Up; P < 0.05, log2FC ≥ 1) in aTreg versus rTreg cells. Unpaired, two-sample Wilcoxon test. (C) Co-immunoprecipitation of Batf and Foxp3 in HEK 293T cells ectopically expressing Batf and Foxp3. (D) Schematic procedures for Batf CRISPR deletion in nTreg cells. nTreg cells were sorted from RosaCas9 Foxp3gfp mice and transduced with sgNC or sgBatf after in vitro activation; 7 days later, cells were restimulated by TCR agonists for 3 h before being harvested for CUT&RUN-seq and ATAC-seq. (E) Assessment of Batf CRISPR depletion in Treg cells by flow cytometry. (F) Foxp3 and Batf peaks and chromatin accessibility (ATAC-seq) at the Il2ra locus in control (NC) or Batf-depleted (sgBatf) Treg cells. Arrowhead indicates reduced binding of Foxp3. Data represent two replicates. (G) DNA sequence motifs for transcription factors enriched at the regions with reduced Foxp3 binding in Batf CRISPR knockout (sgBatf) nTreg cells. (H and I) Differential gene expression resulting from Batf KO (WT versus Batf KO) (Xu et al., 2021) and Foxp3 CRISPR deletion (this study) (H) or Foxp3 depletion (aTreg versus aWannabe) (van der Veeken et al., 2020) (I). Representative genes involved in Treg cell function are labeled. (J) Comparison of the effects of Batf KO and Foxp3 CRISPR deletion on the expression (RNA-seq) of Ctla4, Tnfrsf9, and Il10. Data were derived from two replicates per condition. Two-tailed, unpaired t tests; *P < 0.05, **P < 0.01, ****P < 0.0001. (K) Batf binding in Treg, Th2, and Th17 cells at the regions with increased Foxp3 binding in aTreg and rTreg cells (defined in Fig. 1 B). Batf ChIP-seq data in Th2 cells are from Iwata et al. (2017) and those in Th17 cells from Ciofani et al. (2012). (L and M) Batf and Irf4 binding in the regions of aTreg and rTreg cells with different Foxp3-binding modes. Irf4 ChIP-seq data are from Vasanthakumar et al. (2017). Source data are available for this figure: SourceData FS5.

Comment in

References

    1. Anders, S., Pyl P.T., and Huber W.. 2015. HTSeq--a Python framework to work with high-throughput sequencing data. Bioinformatics. 31:166–169. 10.1093/bioinformatics/btu638 - DOI - PMC - PubMed
    1. Anderson, N.M., and Simon M.C.. 2020. The tumor microenvironment. Curr. Biol. 30:R921–R925. 10.1016/j.cub.2020.06.081 - DOI - PMC - PubMed
    1. Atsaves, V., Leventaki V., Rassidakis G.Z., and Claret F.X.. 2019. AP-1 transcription factors as regulators of immune responses in cancer. Cancers. 11:1037. 10.3390/cancers11071037 - DOI - PMC - PubMed
    1. Bai, B., Tan H., Pagala V.R., High A.A., Ichhaporia V.P., Hendershot L., and Peng J.. 2017. Deep profiling of proteome and phosphoproteome by isobaric labeling, extensive liquid chromatography, and mass spectrometry. Methods Enzymol. 585:377–395. 10.1016/bs.mie.2016.10.007 - DOI - PMC - PubMed
    1. Bai, B., Wang X., Li Y., Chen P.C., Yu K., Dey K.K., Yarbro J.M., Han X., Lutz B.M., Rao S., et al. . 2020. Deep multilayer brain proteomics identifies molecular networks in Alzheimer’s disease progression. Neuron. 105:975–991.e7. 10.1016/j.neuron.2019.12.015 - DOI - PMC - PubMed

Publication types

MeSH terms