. 2024 Jun 28;384(6703):eadl0370.
doi: 10.1126/science.adl0370. Epub 2024 Jun 28.

Mef2d potentiates type-2 immune responses and allergic lung inflammation

Affiliations

Mef2d potentiates type-2 immune responses and allergic lung inflammation

Aydan C H Szeto et al. Science. .

Abstract

Innate lymphoid cells (ILCs) and adaptive T lymphocytes promote tissue homeostasis and protective immune responses. Their production depends on the transcription factor GATA3, which is further elevated specifically in ILC2s and T helper 2 cells to drive type-2 immunity during tissue repair, allergic disorders, and anti-helminth immunity. The control of this crucial up-regulation is poorly understood. Using CRISPR screens in ILCs we identified previously unappreciated myocyte-specific enhancer factor 2d (Mef2d)-mediated regulation of GATA3-dependent type-2 lymphocyte differentiation. Mef2d-deletion from ILC2s and/or T cells specifically protected against an allergen lung challenge. Mef2d repressed Regnase-1 endonuclease expression to enhance IL-33 receptor production and IL-33 signaling and acted downstream of calcium-mediated signaling to translocate NFAT1 to the nucleus to promote type-2 cytokine-mediated immunity.


Conflict of interest statement

Competing interests: ANJM is on the scientific advisory board of SinoMab. The other authors declare that they have no competing interests.

Figures

Fig. 1
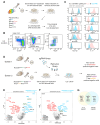
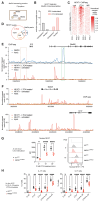
Fig. 1. CRISPR-Cas9 screen for regulators of ILC development and function
(A) Schematic of the optimised ILC culture protocol for CRISPR screening, validated using the 5x polychromILC mice. (B) Gating strategy and flow cytometric analysis of progeny cells following the ILC culture of sorted CLPs purified from 5x polychromILC mice. Data are representative of 2 independent experiments with n=3 biologically independent samples in each experiment. (C) Flow cytometric analysis of surface protein, transcription factor reporter protein and cytokine expression by ILC2s and ILC1/NK cells following the ILC culture as in (A) and (B). Flow plots are presented as histograms and the y-axis represents distribution normalized to mode. The lower level of GATA3 expression in ILC1/NK cells compared to ILC2s represented an opportunity to identify transcriptional regulators that control differentiative GATA3 expression during ILC development by comparing sgRNA distribution between GATA3 high versus low cells. Data are representative of 2 independent experiments with n=3 biologically independent samples in each experiment. (D) Schematic of the CRISPR-Cas9 screening protocol for the identification of Gata3 and Il13 regulators using the ILC culture. (E) Volcano plot showing known (black), positive (blue) and negative (red) regulators of Il13 expression, represented as -log(p-value) versus fold change. Mef2d and Zfp871 are highlighted in green. Data are pooled from 2 independent screens. (F) Volcano plot showing known (black), positive (blue) and negative (red) regulators of Gata3 expression, represented as -log(p-value) versus fold change. Mef2d is highlighted in green. Data are pooled from 2 independent screens. (G) Venn diagram summary of specific and shared regulators of Il13 and Gata3 expression identified from the CRISPR screens.
Fig. 2
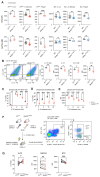
Fig. 2. Mef2d expression in lymphocytes is required for optimal innate and adaptive type-2 immune responses
(A) − (D) Quantification of lung cells from PBS or IL-33 treated Il7rCre or Mef2dIL7RKO mice: (A) ILC2s, (B) IL-13-expressing ILC2s, (C) eosinophils, (D) M2 macrophages and Arg1+CD11b+ DCs. Data are pooled from 2 independent experiments and represent mean ± SD; n=3 mice (PBS groups) and n=6-7 mice (IL-33 groups); individual data point denotes biological replicates. (E) − (I) Quantification of lung cell from naïve, papain or papain+2W1S treated Il7rCre- or Mef2dIL7RKO mice: (E) number of ILC2s and TH2 cells, (F) number of 2W1S-specific TH2 cells, (G) number of IL-5+IL-13+ ILC and T effector cells, (H) number of BAL and lung eosinophils, (I) number of lung Arg1+CD11b+ DCs and M2 macrophage. Data are pooled from 2 independent experiments and represent mean ± SD; n=6 mice in naïve and papain only groups, n=11-12 mice in papain+2W1S-treated groups; individual data point denotes biological replicates. Significance in (A) − (I) was determined using one-way ANOVA with Dunett’s post-hoc test; *P<0.05; **P<0.01; ***P<0.001; ****P<0.0001.
Fig. 3
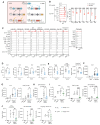
Fig. 3. Development of Boolean mouse strains for ILC2-specific gene targeting define the roles of Mef2d in innate and adaptive type-2 immunity
(A) Schematic of Boolean recombinase cascade with RFP readout. (B) Flow cytometric analysis of RFP expression by ILC2s in the lung (GATA3+ST2+), adipose (GATA3+ST2+), skin (integrinβ3+TCRγδ−), small intestinal lamina propria (GATA3+RORγt), colonic lamina propria (GATA3+RORγt), mesenteric lymph node (GATA3+RORγt) and bone marrow (ST2+CD25+). (C) Flow cytometric analysis of RFP expression by immune cell populations from various tissues. Where a cell population is not present or was not investigated in a particular tissue a histogram is replaced by a flat line in the relevant panel. (B) and (C) Representative gating strategies for cell populations investigated shown in fig. S3 and fig. S10 (Skin) and fig. S13 (liver NKT cells). Data are representative of 2 independent experiments with n=5 biologically independent samples in each experiment; mean ± SD. (D) Quantification of lung ILC2s as a percentage of ILC, percentage of CD45+ cells, number, and ILC2 GATA3 MFI (mean fluorescence intensity) from BIC or Mef2dILC2KO mice at homeostasis. Data are representative of 2 independent experiments and represent mean ± SD; n=3 mice in experiment 1, n=10 in experiment 2 (depicted here). (E) Quantification of lung ILC2, eosinophils, and Arg1+CD11b+ DCs from IL-33 treated BIC or Mef2dILC2KO mice. Data are pooled from 2 independent experiments and represent mean ± SD; n=13 mice in each group. (F) Quantification of lung ILC2s from PBS or A. Alternata-treated BIC or Mef2dILC2KO mice. Data are pooled from 3 independent experiments with n=3 mice in PBS groups, n=15 mice in A. Alternata groups; mean ± SD. (G) − (H) Quantification of lung cells from naive, papain or papain+2W1S treated BIC or Mef2dILC2KO mice: (G) number of ILC2s and total TH2 cells, (H) number of 2W1S-specific TH2 cells. Data are pooled from 2 independent experiments and represent mean ± SD; n=3 in naïve and papain only groups, n=11 in papain+2W1S-treated control group, n=8 in papain+2W1S- treated Mef2dILC2KO group. (I) − (J) Quantification of lung cells from PBS, papain or papain+2W1S treated Cd4Cre or Mef2dCD4KO mice: (I) number of ILC2, total TH2 cells and 2W1S-specific TH2 cells, (J) number of lung eosinophils, BAL eosinophils and lung Arg1+CD11b+ DCs. Data are representative of 2 independent experiments and represent mean ± SD; n=3 in naïve and papain only groups, n=5-6 in papain+2W1S-treated groups. Significance was determined using unpaired two-sided t-test [(B) − (E)] or one-way ANOVA with Dunett’s post-hoc test [(F) − (J)]; ns, not significant; *P<0.05; **P<0.01; ***P<0.001; ****P<0.0001; individual data point denotes biological replicates.
Fig. 4
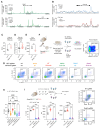
Fig. 4. Mef2d sustains high ST2 expression and optimal IL-33-mediated ILC2 responses
(A) Quantification of ILC2 ST2 and GATA3 MFI in various in vivo models from control or conditional Mef2d-deficient mice. Data are representative of 2-3 independent experiments with n=3-15 mice from different experiments as described in the legends of figures 2 & 3; mean ± SD. (B) Flow cytometric quantification of IL-13 and IL-5 expression following 3 days of culturing purified ILC2s in the presence of IL-33. Data are representative of 2 independent experiments with n=5 biologically independent samples in each experiment; mean ± SD. Gating strategy for scatter, singlets and live/dead cell exclusion shown in fig. S20A. (C) − (E) Flow cytometric quantification of (C) phospho-p38, (D) phospho-S6 and (E) phospho-GATA3 following IL-33 treatment for the indicated time. Data are representative of 2 independent experiments with n=5 biologically independent samples in each experiment; mean ± SD. (F) Schematic of the mixed bone marrow chimera experiment and representative gating strategy for the identification of Il7rCre- or Mef2dIL7RKO-derived ILC2s in the recipients. (G) Quantification of the proportion of Il7rCre- or Mef2dIL7RKO-derived ILC2s (left) and their GATA3 and ST2 MFI (right). Data are representative of 2 independent experiments with n=6-9 mice in each experiment; paired samples (Il7rCre- or Mef2dIL7RKO-derived ILC2s from the same recipients) are connected by a line. Significance in (A) − (G) was determined using unpaired two-sided t-test; ns, not significant; *P<0.05; **P<0.01; ***P<0.001; ****P<0.0001; individual data point denotes biological replicates.
Fig. 5
Fig. 5. Mef2d represses Regnase-1 transcription to maintain GATA3, ST2, and IL-13 expression.
(A) Representative binding profiles of Mef2d and GATA3 in ILC2s at the Gata3 (top) and Il1rl1 (bottom) loci. Data representative of 2 biological replicates. (B) Representative binding profiles of Mef2d in ILC2s and ATAC-seq track in Il7rCre or Mef2dIL7RKO ILC2s at the Zc3h12a locus. Data representative of 2 biological replicates. (C) Zc3h12a gene expression (from RNA-seq analysis) in Il7rCre or Mef2dIL7RKO ILC2s. Mean ± SD; individual data point denotes biological replicates. (D) Zc3h12a gene expression (from qPCR) in Il7rCre or Mef2dIL7RKO ILC2s. Mean ± SD; individual data point denotes biological replicates. (E) Il1rl1 gene expression (from RNA-seq analysis) in Il7rCre or Mef2dIL7RKO ILC2s. Mean ± SD; individual data point denotes biological replicates. (F) & (G) Schematic of the experimental procedure to produce single or double Mef2d, Gata3 and Zc3h12a CRISPR-targeted cells in the ILC culture assay by using sgRNA-encoding retroviruses carrying different fluorescent protein reporters and (G) representative flow cytometric plots to identify double CRISPR-KO ILCs. (H) Flow cytometric quantification of the proportion of Il13Tom and IL-13 protein expressing cells transduced with the indicated CRISPR sgRNA as in cells gated in (F) & (G). Data are representative of 2 independent experiments with n=2 biologically independent samples in each experiment and 3 different sgRNAs targeting each gene; individual data point denotes a unique combination of sgRNA pairs; mean ± SD. (I) Schematic of the experimental procedure to produce single or double Gata3 and Zc3h12a CRISPR-targeted ILC2s and representative flow cytometric plots to identify double CRISPR-KO ILC2s. Flow cytometric quantification of ST2, IL-13Tom and GATA3 MFI of ILC2s transduced with the indicated CRISPR sgRNA. Data are representative of 2 independent experiments with n=2 biologically independent samples in each experiment and 3 different sgRNAs targeting each gene; individual data point denotes a unique combination of sgRNA pairs; mean ± SD. Significance was determined using unpaired two-sided t-test [(C) − (E)] or one-way ANOVA with Tukey’s post-hoc test [(H) & (I)]; ns, not significant; *P<0.05; **P<0.01; ***P<0.001; ****P<0.0001.
Fig. 6
Fig. 6. A Mef2d-NFAT1 complex regulates calcium response and synergistic ILC2 cytokine production
(A) Identification of NFAT1 and Mef2a as Mef2d-interacting proteins using mass spectrometry of proteins co-immunoprecipitated with anti-Mef2d antibody from ILC2 lysate. The full network of identified interacting proteins is shown in fig. S22. (B) Mass spectrometry quantification of NFAT1 exclusive unique peptide count in Mef2d-immunoprecipitate in the cytoplasm and nucleus of ILC2s before and after LTC4 stimulation. (C) Heatmap representation of NFAT1 binding in ILC2s, with and without LTC4 stimulation, around the centre (±1.5 kb) of Mef2d peaks in ILC2s, ordered according to the LTC4 treated sample. (D) Venn diagram showing the overlap between Mef2d and NFAT1 (LTC4 treated and untreated) ChIP-seq peaks in ILC2s. Peak list was generated using two biological replicates. (E) Representative binding profiles of Mef2d and NFAT1 (LTC4 treated and untreated) in ILC2s at the Zc3h12a locus (top) and around the type-2 cytokine LCR region (bottom). Data representative of 2 biological replicates. (F) Representative binding profiles of NFAT1 (LTC4 treated and untreated) in ILC2s at the Gata3 (top) and Il1rl1 (bottom) loci. Data representative of 2 biological replicates. (G) Flow cytometric analysis of nuclear NFAT1 MFI of cultured ILC2s following LTC4 treatment at the indicated timepoints. Data are representative of 2 independent experiments with n=5 biologically independent samples in each experiment; mean ± SD. Gating strategy for scatter, singlets and live/dead cell exclusion shown in fig. S23G. (H) Flow cytometric quantification of ILC2 production of IL-13 and IL-5 following stimulation with the indicated molecules. Data are representative of 2 independent experiments with n=5 biologically independent samples in experiment 1 and n=10 biologically independent samples in experiment 2 (depicted here); mean ± SD. Significance in (G) & (H) was determined using unpaired two-sided t-test; ns, not significant; **P<0.01; ***P<0.001; ****P<0.0001; individual data point denotes biological replicates.

References

    1. Walker JA, McKenzie ANJ. TH2 cell development and function. Nat Rev Immunol. 2018;18:121–133. - PubMed
    1. Paul WE, Zhu J. How are T(H)2-type immune responses initiated and amplified? Nat Rev Immunol. 2010;10:225–235. doi: 10.1038/nri2735. - DOI - PMC - PubMed
    1. Zhu J. GATA3 Regulates the Development and Functions of Innate Lymphoid Cell Subsets at Multiple Stages. Front Immunol. 2017;8:1571. doi: 10.3389/fimmu.2017.01571. - DOI - PMC - PubMed
    1. Ho IC, Tai TS, Pai SY. GATA3 and the T-cell lineage: essential functions before and after T-helper-2-cell differentiation. Nat Rev Immunol. 2009;9:125–135. doi: 10.1038/nri2476. - DOI - PMC - PubMed
    1. Yang Q, Saenz SA, Zlotoff DA, Artis D, Bhandoola A. Cutting edge: Natural helper cells derive from lymphoid progenitors. J Immunol. 2011;187:5505–5509. doi: 10.4049/jimmunol.1102039. - DOI - PMC - PubMed

Publication types

MeSH terms