. 2024 Jun 28;384(6703):1482-1488.
doi: 10.1126/science.adm7607. Epub 2024 Jun 27.

Homeocurvature adaptation of phospholipids to pressure in deep-sea invertebrates

Affiliations

Homeocurvature adaptation of phospholipids to pressure in deep-sea invertebrates

Jacob R Winnikoff et al. Science. .

Abstract

Hydrostatic pressure increases with depth in the ocean, but little is known about the molecular bases of biological pressure tolerance. We describe a mode of pressure adaptation in comb jellies (ctenophores) that also constrains these animals' depth range. Structural analysis of deep-sea ctenophore lipids shows that they form a nonbilayer phase at pressures under which the phase is not typically stable. Lipidomics and all-atom simulations identified phospholipids with strong negative spontaneous curvature, including plasmalogens, as a hallmark of deep-adapted membranes that causes this phase behavior. Synthesis of plasmalogens enhanced pressure tolerance in Escherichia coli, whereas low-curvature lipids had the opposite effect. Imaging of ctenophore tissues indicated that the disintegration of deep-sea animals when decompressed could be driven by a phase transition in their phospholipid membranes.


Conflict of interest statement

Competing interests: Authors declare that they have no competing interests.

Figures

Fig. 1.
Fig. 1.. Ecological and physiological evidence for pressure specialization in ctenophores.
(A) Disintegration of the deep-constrained ctenophore Bathocyroe aff. fosteri at atmospheric pressure. The left image was taken in the specimen’s native water at 2°C, immediately after recovery from the ROV. The right image is of the same animal and was taken 10 minutes later at 4°C. Scale bars, 5 mm. Inset shows disintegration of the ectodermal tissue. (B) Depth distributions of four ctenophore species with narrow, broad, shallow, and deep depth ranges. (C) Live ex vivo tissue mounts stained with solvatochromic C-Laurdan membrane label and imaged at increasing temperatures. Images are a composite of two emission ranges, which are used to calculate GP ratios. In Bolinopsis microptera, which occurs from 0–2000 m, GP value decreases with increasing temperature indicating a more fluid lamellar phase. In Bathocyroe, which occurs down to >3500 m but not shallower than 200 m, GP displays a sharp increase between 2 and 10°C, concurrent with a catastrophic collapse of membrane morphology. This increase in GP patterns is observed in synthetic lipid systems undergoing inversion (Figs. S3C, S8D). Scale bars, 10 μm.
Fig. 2.
Fig. 2.. Biophysical signatures of depth-adaptation.
(A) Schematic of the pipeline carried out on a set of ctenophores collected in different P-T regimes. Polar lipids were isolated from collected animals and analyzed by HPSAXS for phase properties and HPFS for membrane fluidity. (B) Representative SAXS profiles used to determine the phase of total polar lipid dispersions from the shallow Arctic ctenophore Beroe cucumis (profiles shown at 4°C), the deep-constrained Platyctenida sp. T (4°C), and the shallow-constrained Leucothea pulchra (15°C). Profiles are colored by phase composition and baselines are offset for clarity. The broad peak indicated in Platyctenida sp. T results from the overlap of two close peaks characteristic of the HII phase. The three main phases are shown in the inset cartoons. (C) Phase change diagrams for the same dispersions based on SAXS data. Points mark measured states and asterisks indicate the native P-T for each animal. (D) C-Laurdan GP values for liposomes from the same samples measured across a P-T grid. Within lamellar phase regions, GP reflects lipid ordering, with lower values corresponding to more fluid membranes. Near native conditions, GP pressure-sensitivity was greater in shallow than in deep samples. This sensitivity is reflected by the proximity of contour lines.
Fig. 3.
Fig. 3.. Lipidomic analysis of ctenophore phospholipids.
(A) Plot showing the depth and temperature regimes of the 66 ctenophores in the dataset. Each data point represents the mean for one of the 17 species collected; all error bars are +/− SEM. Subsets of the collections made ≤10°C and ≤250 m depth, shaded in gray, were used to assess depth and temperature trends, respectively. Collection locales are marked on the globe in black. (B) High relative abundance of PPE is correlated with both deep-cold and shallow-warm habitats. Structure of the PPE alkenyl ether linkage is inset. Ordinary least-squares regressions (OLS, solid lines) and phylogenetically generalized ones (GLS, dashed lines) are shown with their corresponding P-values; an asterisk indicates significance at the α0.05 level. (C) Examples of independent lipidomic depth-adaptation in three ctenophore clades, delimited with gray lines. Phylogenetics have revealed that ctenophores have depth-specialized on multiple occasions. Within each clade, deeper cold species have higher fractions of PPE and PE, and lower fractions of PC and lysolipids. Temperature specialization of a shallow, tropical representative of genus Bolinopsis is also shown. (D) Phospholipid total chain length index (CLI) and unsaturation (double bond index; DBI) as a function of depth and temperature. Deeper cold lipidomes feature longer and more unsaturated acyl chains, while colder shallow lipidomes feature shorter and more unsaturated acyl chains. Regressions are shown as in B.
Fig. 4:
Fig. 4:. Exploring the role of lipid curvature in deep-sea lipidomes enriched in PPE.
(A) Lipid phase ratios estimated from HPSAXS data plotted as a function of pressure and of the PPE headgroup. At the temperatures tested, PPE was HII-phase and PE was Lα-phase at 1 bar regardless of whether the sn-2 acyl chain was poly- or monounsaturated. The polyunsaturated phospholipids were chosen as the closest commercially available analogues to those in ctenopohres; 5 mole percent PG was added to bring the inverted phase transition within an instrumentally achievable P-T domain. Each black triangle denotes an individual X-ray exposure taken during a pressure sweep in the indicated direction. Black squares at upper right are exposures taken at maximum pressure. (B) Spontaneous curvature (c0) values measured for PPE and PE species with a monounsaturated sn-2 chain. Cartoons by the vertical axis illustrate the relationship between c0 and lipid shape. PPE shows a stronger negative curvature than PE and the effect of pressure on both is identical. Neutral-plane c0 was inferred by fitting global models to HPSAXS profiles of the lipids (20%) hosted in a di-oleoyl PE (DOPE) HII phase and relaxed with 10.7% w/w 9(Z)-tricosene. (C) Representative c0 values for phospholipid classes. These were used along with linear corrections for sn-1 acyl chain structure (Materials and Methods) to estimate the mean phospholipid curvature at 1 bar (c0¯) for all measured lipidomes. (D) The robust correlation of c0¯ with habitat depth among all animals sampled; deeper lipidomes feature a higher degree of lipidome curvature. Habitat temperature does not predict c0¯. Regressions are shown as in Fig. 3. (E) Comparison of simulated lipidomes modeled after a cold, shallow species (B. infundibulum) and a deep species (Platyctenida sp. T) Pressure-dependent properties include area per lipid (APL) strain relative to 1 bar, average lipid translational diffusion rate (DT), and the first moment of the computed lateral stress profile, which is equal to kbc0. All simulations were run at 20°C. For kbc0, the pressure equivalency of shallow and deep systems is indicated with a dashed line. Simulation snapshots and additional details are shown in Fig. S7. (F) A homeocurvature adaptation model in which a more negative baseline (1 bar) lipidome curvature is required to offset the effects of high pressure on lipid shape. For both shallow and deep lipidomes, physiological membrane states (dashed boxes) contain a mixture of bilayer and non-bilayer lipids, but the chemistry of these species must differ to maintain this arrangement. When shallow membranes are compressed, lipidome curvature is lost, potentially disrupting membrane dynamics and plasticity. When deep membranes are decompressed, negative lipidome curvature increases, destabilizing membrane structure.
Fig. 5.
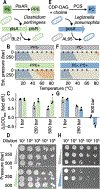
Fig. 5.. Testing the principles of pressure adaptation in engineered bacterial cells.
(A) Heterologous synthesis of PPE, using plasmid-based expression of the plsAR PE reductase from Clostridium, enhances E. coli lipidome curvature and its propensity to invert into HII, as assayed by SAXS as a function of temperature. (B) Phase diagrams of E. coli polar lipids (inner and outer membrane) in PPE- (BL21 + pET28a, gray) and PPE+ (BL21 + pPlScp, green) strains. To facilitate comparison with the pressure treatments, these diagrams are extrapolated along a pressure axis using published temperature-pressure equivalencies (24). (C) Growth of PPE-lacking and PPE-containing E. coli in microaerobic culture under pressure. The difference in pressure-sensitivity of growth was significant (P = 0.009, multiple regression with F-test). (D) Post-decompression survival was similarly rendered pressure-insensitive by PPE (compare lower right colonies in both panels.) (E) Non-native synthesis of PC, using plasmid-based expression of the PC synthase (PCS) from Legionella in the PE-free background AL95, reduces lipidome curvature and propensity to invert into HII. (F) Pressure-extrapolated phase diagrams of E. coli polar lipids in PC- (AAL9256 with an integrated PBAD-pssA cassette, gray) and PE-, PC+ (AL95 + pPCSlp, blue) strains. (G) Growth and (H) survival were assessed as in C and D, except that outgrowth prior to pressurization was aerobic. The difference in pressure-sensitivity of growth was significant (p = 0.002), and the PC strain was inviable at 500 bar. Strain pairs were chosen to minimize differences in genetic background and promoters were identical within each pair.

References

    1. Yancey PH, Gerringer ME, Drazen JC, Rowden AA, Jamieson A, Marine fish may be biochemically constrained from inhabiting the deepest ocean depths. Proc. Natl. Acad. Sci 111, 4461–4465 (2014). - PMC - PubMed
    1. Somero GN, Adaptations to High Hydrostatic Pressure. Annu. Rev. Physiol 54, 557–577 (1992). - PubMed
    1. Cossins AR, Macdonald AG, The adaptation of biological membranes to temperature and pressure: Fish from the deep and cold. J. Bioenerg. Biomembr 21, 115–135 (1989). - PubMed
    1. Morein S, Andersson A-S, Rilfors L, Lindblom G, Wild-type Escherichia coli Cells Regulate the Membrane Lipid Composition in a “Window” between Gel and Non-lamellar Structures. J. Biol. Chem 271, 6801–6809 (1996). - PubMed
    1. Wikström M, Kelly AA, Georgiev A, Eriksson HM, Klement MR, Bogdanov M, Dowhan W, Wieslander Å, Lipid-engineered Escherichia coli Membranes Reveal Critical Lipid Headgroup Size for Protein Function. J. Biol. Chem 284, 954–965 (2009). - PMC - PubMed

Publication types