. 2024 Jul 26;385(6707):438-446.
doi: 10.1126/science.adj2537. Epub 2024 Jun 27.

GLP-1 increases preingestive satiation via hypothalamic circuits in mice and humans

Affiliations

GLP-1 increases preingestive satiation via hypothalamic circuits in mice and humans

Kyu Sik Kim et al. Science. .

Abstract

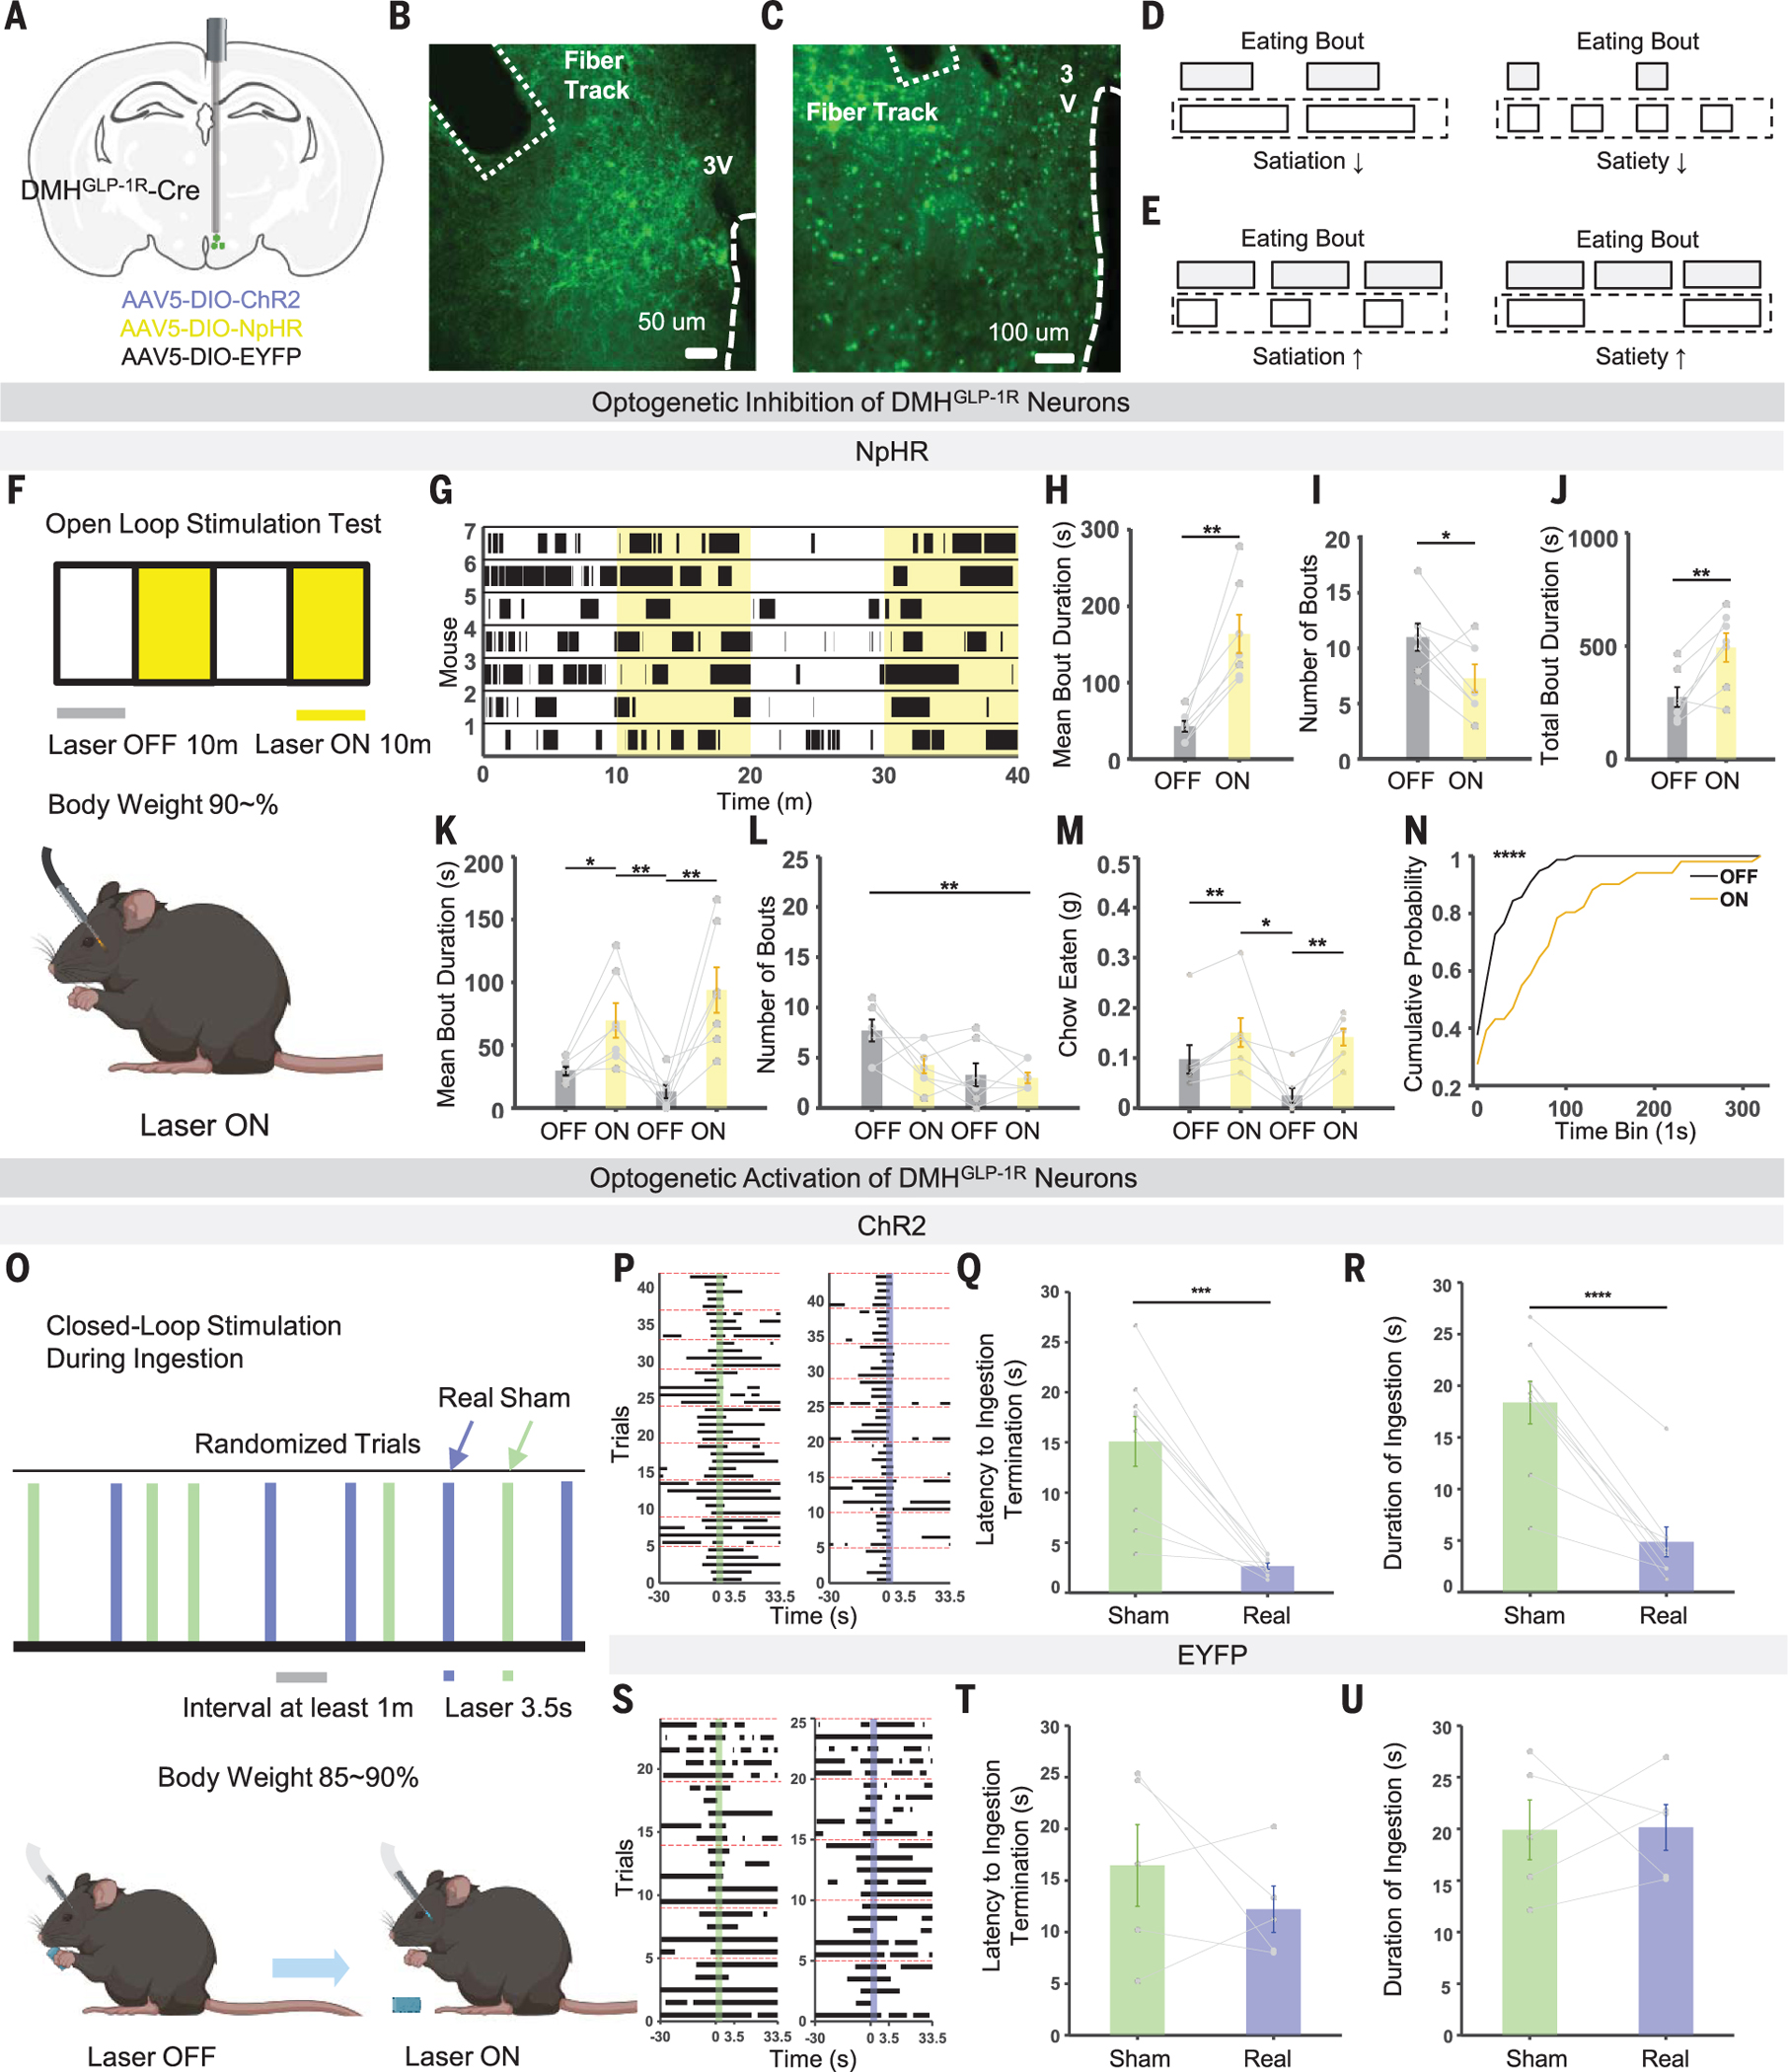
Glucagon-like peptide-1 (GLP-1) receptor agonists (GLP-1RAs) are effective antiobesity drugs. However, the precise central mechanisms of GLP-1RAs remain elusive. We administered GLP-1RAs to patients with obesity and observed a heightened sense of preingestive satiation. Analysis of human and mouse brain samples pinpointed GLP-1 receptor (GLP-1R) neurons in the dorsomedial hypothalamus (DMH) as candidates for encoding preingestive satiation. Optogenetic manipulation of DMHGLP-1R neurons caused satiation. Calcium imaging demonstrated that these neurons are actively involved in encoding preingestive satiation. GLP-1RA administration increased the activity of DMHGLP-1R neurons selectively during eating behavior. We further identified that an intricate interplay between DMHGLP-1R neurons and neuropeptide Y/agouti-related peptide neurons of the arcuate nucleus (ARCNPY/AgRP neurons) occurs to regulate food intake. Our findings reveal a hypothalamic mechanism through which GLP-1RAs control preingestive satiation, offering previously unexplored neural targets for obesity and metabolic diseases.


Conflict of interest statement

Competing interests: K.W.W. is a shareholder of Novo Nordisk and Eli Lilly. All other authors declare no competing interests

Figures

Fig. 1.
Fig. 1.. GLP-1R agonist treatment in humans increases preingestive satiation.
(A) Schematic of human GLP-1RA treatment. (B) Satiation index of prospective food ingestion. Mean and individual values are represented as thick and thin lines, respectively (n = 28). (C and D) Quantification of difference in prospective food ingestion score of each phase compared to baseline. (n = 28). (E and F) Linear regression and analysis of covariance (ANCOVA) analysis of preoral (E) or preingestive (F) satiation index and baseline satiation index. Dots are individual scores (n = 28). r, correlation coefficient. (G) GLP-1R in the human hypothalamus as visualized with immunofluorescence. The DMH region is magnified. 3V, third ventricle, ot, optic tract. (H) Representative image showing tdTomato expression in a GLP-1R–Cre mouse. The hypothalamus (left) and magnified DMH region (right) are shown. Error bars indicate SEM. *P < 0.05; **P < 0.01; ***P < 0.001; ****P < 0.0001.
Fig. 2.
Fig. 2.. DMHGLP−1R neurons are sufficient and necessary for satiation.
(A) Schematic of viral injection into DMH. (B and C) Representative viral injection image of AAV5-DIO-NpHR (B) and AAV5-DIO-ChR2 (C). (D and E) Schematic of satiation and satiety effects on eating bouts. (F) Schematic of open-loop stimulation. (G) Raster plot of eating bouts during open-loop stimulation. The duration of laser stimulation is indicated in yellow; black indicates eating bouts (n = 7). (H to J) Total quantification of mean bout duration (H), number of bouts (I), and total bout duration (J) from (G). (K to M) Quantification from each OFF and ON section in (G) for mean bout duration (K), number of bouts (L), and total bout duration (M). (N) Cumulative probability distribution of eating bouts. (O) Schematic of closed-loop stimulation during ingestion [enhanced yellow fluorescent protein (EYFP) n = 5, channelrhodopsin 2 (ChR2) n = 9]. (P) Raster plot of eating bouts in ChR2-expressing DMHGLP−1R-Cre mice. Real stimulation is shown in blue and sham stimulation in green; black indicates eating bouts. (Q and R) Quantification of latency to termination ingestion (Q) and duration of ingestion (R) from (P) after laser delivery. (S) Raster plot of eating bouts in EYFP-expressing DMHGLP−1R −1R-Cre mice. (T and U) Quantification of latency to termination ingestion (Q) and duration of ingestion (R) from (S) after laser delivery. Error bars indicate SEM. *P < 0.05; **P < 0.01; ***P < 0.001; ****P < 0001.
Fig. 3.
Fig. 3.. DMHGLP−1R neural activity encodes preingestive satiation.
(A) Schematic of fiber photometry in DMHGLP−1R-Cre male mice. The numbers indicate the wavelength of LED light sources. (B) Representative viral injection image of the optical fiber tract above the DMH. (C) Schematic of the multiphase test. (D) Quantification from first trial of day 1 and last trial of day 2. (E) Representative calcium traces from DMHGLP−1R neurons on day 1. ΔF/F0, normalized calcium signals. (F) Quantification of the first trials from day 1 (n = 6). (G) Representative calcium traces from DMHGLP−1R neurons on day 2. (H) Quantification of the last trials from day 2 (n = 6). (I) Schematic of the T-maze test. (J) Representative trace of DMH GLP-1R neuronal signals during T-maze test from one mouse. (K) Quantification of mean z-score from the nongoal or goal side. (L) Quantification of the preference ratio to goal side, showing a behavior change to conditioning (Con) and extinction (Ext). (M) Representative viral injection image of GRIN lens insertion above the DMH. (N) Schematic of microendoscopic calcium imaging. DAQ, data acquisition. (O) Heatmap of neural activities from a representative trial from one mouse. The bars along the top indicate the duration of each phase; the bars on the right indicate neuronal type defined from choice probability. (P) Histogram of significant choice probability values (113 of 150 cells from six mice). (Q) Proportion of neurons from (P). (R) Representative contour map of mean neural activity during the ingestion (left) and no-ingestion (right) phases. (S) Representative single-cell traces from preingestion (green) and ingestion (purple) neurons. (T) Heatmap of neural activity of all trials from representative preingestion (top) and ingestion (bottom) neurons. Shown on the left is a heatmap of the ingestive trials, where purple indicates ingestion start and end. Shown on the right is a heatmap of the no-ingestive trials, where purple indicates food zone in and out. Error bars indicate SEM. *P < 0.05; **P < 0.01.
Fig. 4.
Fig. 4.. GLP-1R agonist injection activates DMHGLP−1R neurons only during eating behavior.
(A) Schematic of the GLP-1RA injection test. (B) Quantification of time until ingestion. (C) Representative calcium trace of GLP-1R neurons for saline (left) and GLP-1RA (right) injection. (D) Quantification of base neural activity changes (n = 5). (E, G, and I) Mean ΔF/F0 of the first trial after saline (light blue) or GLP-1RA (red) injection during food accessibility (E), seeking start (G), or ingestion start (I). (F, H, and J) Quantification based on (E), (G), and (I), respectively. (K) Representative z-score traces after saline (light blue) and GLP-1RA (red) injection. (L, N, and P) Quantification of maximum z-score in all trials after food accessibility (L), seeking start (N), and ingestion start (P). (M, O, and Q) Cumulative probability distribution of z-scores in all trials after food accessibility (M), seeking start (O), and ingestion start (Q). (R) Quantification during food accessibility, seeking start, and ingestion start after saline (light blue) or GLP-1RA (red) injection. (S) Raster plot of eating bouts after saline or GLP-1RA injection along with optogenetic inhibition. (T to V) Quantification of mean bout duration (T), number of bouts (U), and amount of chow eaten (V). Error bars indicate SEM. *P < 0.05; **P < 0.01; ****P < 0.0001.
Fig. 5.
Fig. 5.. GLP-1 agonist activates DMHGLP−1R-ARCNPY/AgRP circuits to induce satiation.
(A) Photoactivation of DMHGLP−1R afferents to ARC (top left) evokes GABAergic inhibitory postsynaptic currents (top right), and hyperpolarizes and decreases the APF (bottom) of ARCNPY/AgRP neurons. (B) Representative trace from hM3Dq delivered GLP-1R cre::NPY-hrGFP mice (top left) showing depolarization of a DMHGLP−1R neuron (top right) and hyperpolarization of an ARCNPY/AgRP neuron (bottom left) by CNO bath application. Quantification of resting membrane potential (RMP) of ARCNPY/AgRP neurons in brain slices containing hM3Dq virus–expressing DMHGLP−1R neurons before aCSF and during CNO bath application (bottom right, n = 8). aCSF, artificial cerebrospinal fluid. (C) Representative fluorescence image demonstrating DMHGLP−1R neurons → ARC neurons provide dense axo-somatic innervation of ARCNPY/AgRP neurons. Scale bars are 200 mM and 20 mM (magnified image). (D) Schematic of DREADD virus injection into the DMH bilaterally (left). Representative fluorescence image demonstrating virus expression in the DMH (middle). Food intake of GLP-1R-cre mice with DREADD virus expression in the DMH in response to CNO or saline injection (right; control n = 5, hM3Dq n = 4, hM4Di n = 6). Scale bar is 200 mM. (E) Representative traces (left) and quantification of change of RMP (right) in DMHGLP−1R neurons by liraglutide (top; n = 5) or leptin (bottom; n = 5) bath application (liraglutide: depolarization 5/8, no response 2/8, and hyperpolarization 1/8; leptin: depolarization 5/9, no response, 3/9, and hyperpolarization, 1/9). (F) Representative trace of RMP and APF of DMHGLP−1R neurons 24 hours after saline injection (top left) or liraglutide injection (bottom left). Quantification of RMP (top right) and APF (bottom right) (saline n = 14, liraglutide n = 14). AP, action potential. (G) Schematic of DREADD virus injection into the DMH of GLP-1R–Cre mice or ARC (top left) of AgRP-Cre mice (top right). Quantification of change in body weight (bottom left) and food intake (bottom right) from DREADD-expressing GLP-1R–Cre and AgRP-Cre mice in response to liraglutide or saline injections. The saline-injected group received saline every 4 hours for 24 hours (six times total), whereas the liraglutide-injected group received CNO every 4 hours for 24 hours (Control GLP-1R n = 5, hM4Di GLP-1R n = 6, hM3Dq AgRP n = 3). (H) Schematic of DREADD virus injection into the DMH of GLP-1R–Cre::NPY-GFP mice (top). Quantification of the change in membrane potential of DMHGLP−1R (bottom left) or ARCNPY (bottom right) neurons by CNO (DMHGLP−1R, n = 6; ARCNPY, n = 9), liraglutide (DMHGLP−1R, n = 8; ARCNPY, n = 10), or CNO and liraglutide (DMHGLP−1R, n = 6; ARCNPY, n = 9) bath application. Error bars indicate SEM. *P < 0.05; **P < 0.01; ***P < 0.001.

References

    1. Skvortsova A, Veldhuijzen DS, Kloosterman IEM, Pacheco-López G, Evers AWM, Neurosci. Biobehav. Rev. 126, 447–464 (2021). - PubMed
    1. Bilman E, van Kleef E, van Trijp H, Crit. Rev. Food Sci. Nutr. 57, 2825–2834 (2017). - PubMed
    1. Williams DL, Endocrinology 151, 445–447 (2010). - PMC - PubMed
    1. Morewedge CK, Huh YE, Vosgerau J, Science 330, 1530–1533 (2010). - PubMed
    1. Müller TD et al., Mol. Metab. 30, 72–130 (2019). - PMC - PubMed

Publication types

MeSH terms

Substances