. 2024 Jun 27;20(6):e1012195.
doi: 10.1371/journal.pcbi.1012195. eCollection 2024 Jun.

Prioritizing drug targets by perturbing biological network response functions

Affiliations

Prioritizing drug targets by perturbing biological network response functions

Matthew C Perrone et al. PLoS Comput Biol. .

Abstract

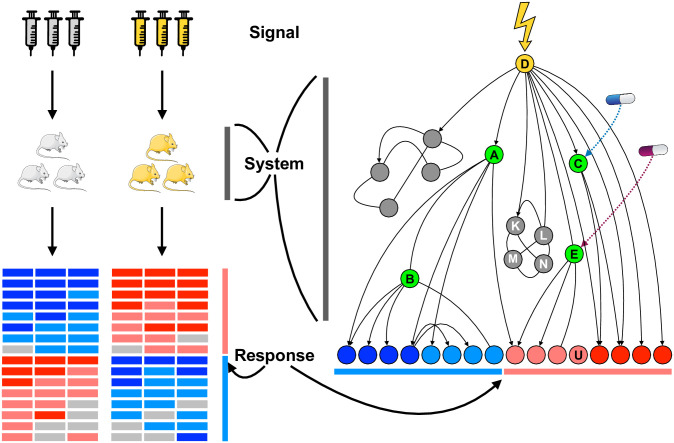
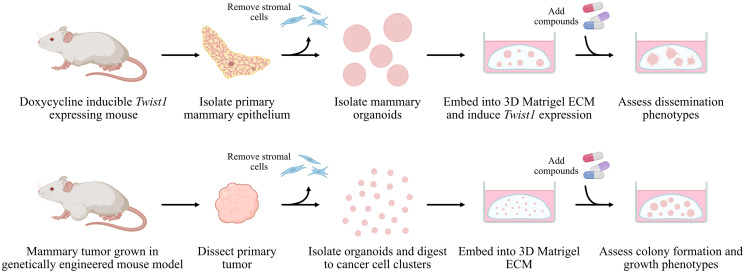
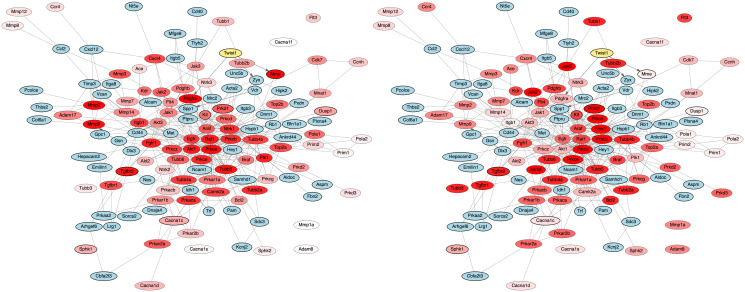
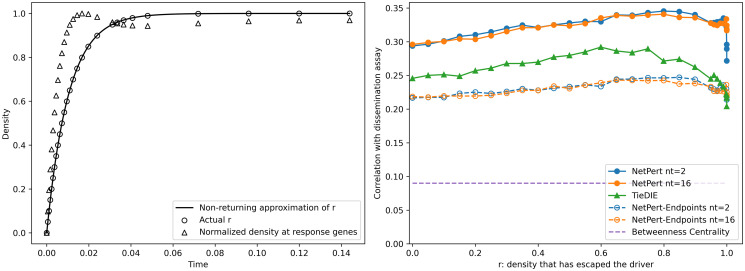
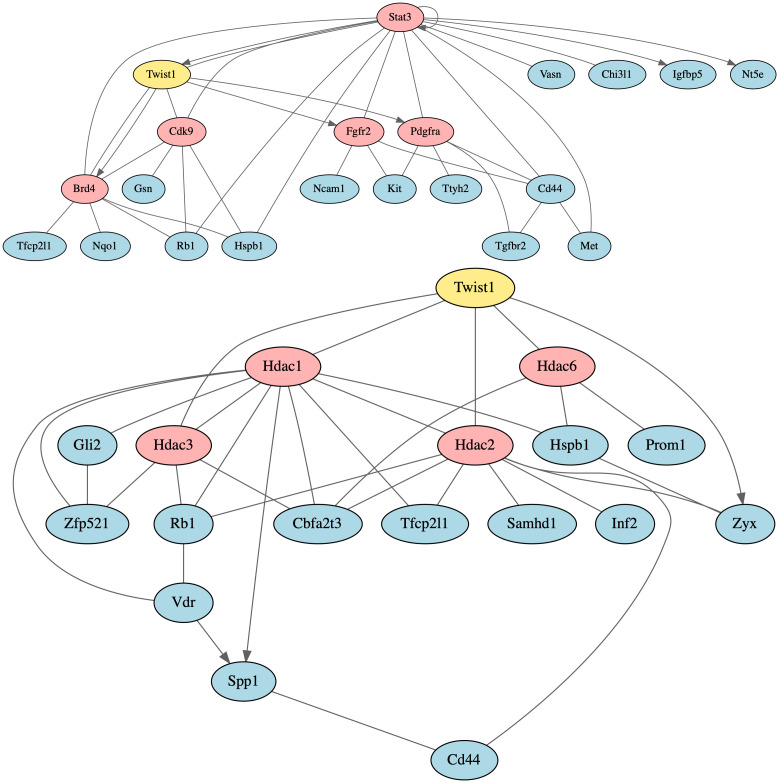
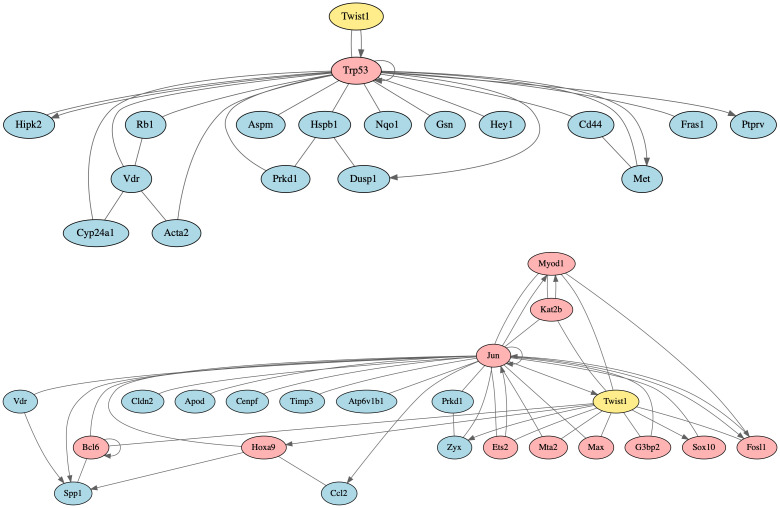
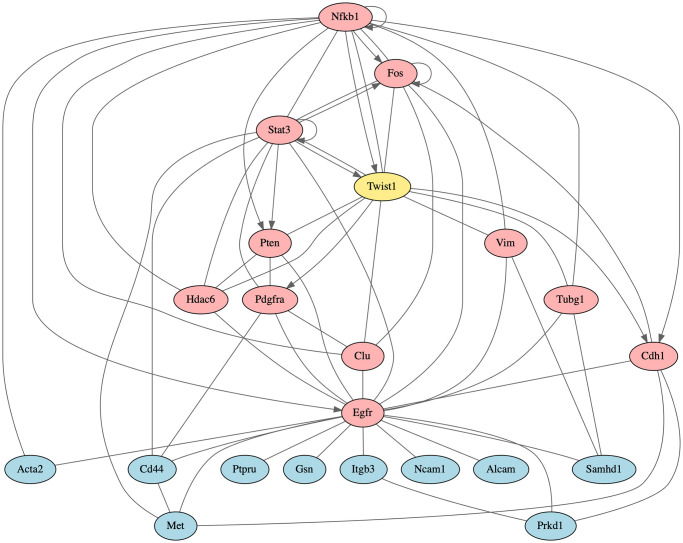
Therapeutic interventions are designed to perturb the function of a biological system. However, there are many types of proteins that cannot be targeted with conventional small molecule drugs. Accordingly, many identified gene-regulatory drivers and downstream effectors are currently undruggable. Drivers and effectors are often connected by druggable signaling and regulatory intermediates. Methods to identify druggable intermediates therefore have general value in expanding the set of targets available for hypothesis-driven validation. Here we identify and prioritize potential druggable intermediates by developing a network perturbation theory, termed NetPert, for response functions of biological networks. Dynamics are defined by a network structure in which vertices represent genes and proteins, and edges represent gene-regulatory interactions and protein-protein interactions. Perturbation theory for network dynamics prioritizes targets that interfere with signaling from driver to response genes. Applications to organoid models for metastatic breast cancer demonstrate the ability of this mathematical framework to identify and prioritize druggable intermediates. While the short-time limit of the perturbation theory resembles betweenness centrality, NetPert is superior in generating target rankings that correlate with previous wet-lab assays and are more robust to incomplete or noisy network data. NetPert also performs better than a related graph diffusion approach. Wet-lab assays demonstrate that drugs for targets identified by NetPert, including targets that are not themselves differentially expressed, are active in suppressing additional metastatic phenotypes.


Conflict of interest statement

I have read the journal’s policy and the authors of this manuscript have the following competing interests: JSB is a founder of and advisor to Neochromosome, Inc., and its parent company Opentrons Labworks, Inc. JSB is an advisor to Dextera Biosciences, Inc. AJE has unlicensed patents related to the use of K14 as a biomarker in breast cancer, US20140336282A1, and for the use of antibody therapeutics in cancer, US2018104331A1. AJE is a consultant for BioNTech. AJE’s spouse is an employee of Immunocore.

Figures

Fig 1
Fig 1. NetPert overview.
The NetPert method represents an experiment as an input signal (top) and output response (bottom) governed by a system response function (middle). Real-world experiment, left: chemical or genetic inputs pair a control treatment (grey syringes) with one or more experimental drivers (yellow syringes). The system, depicted as mouse biological replicates, may comprise cell lines, organoids, or whole animals. Responses are often measured as differential gene expression of the experimental signal relative to the control, here represented as a heatmap, one column for each biological replicate, and rows clustered showing genes that are significantly up-regulated or down-regulated by the signal. Computational network model, right: The system is represented by genes and proteins (circles) connected by pairwise protein-protein interactions (line segments) and gene-regulatory interactions (arrows). The driver gene (labeled ‘D’ in yellow) corresponds to the known target of the signal, and the response genes at the bottom correspond to the up-regulated (red circles) and down-regulated genes (blue circles) from the experiment. Drugs can perturb the signaling response. Genes A, B: Gene A is directly attached to the driver and to a response gene, a category named DIR for driver-intermediate-response; gene B is on a path with two intermediates and is termed DIIR. Genes C, E: Gene C is not on any shortest paths from driver to response genes. Betweenness centrality ignores genes that are not on shortest paths, but NetPert can rank them highly. If genes C and E are targeted by known drugs, depicted as pills, NetPert suggests drug repurposing candidates. Genes K, L, M, N: While highly connected clusters often generate high rankings in network-based methods, NetPert only considers the KLMN cluster to the extent that it contributes to the response function of regulated genes. Gene U: This response gene is unconnected in the network model, possibly due to incompleteness of interaction databases and forms of regulation not yet incorporated into the network model.
Fig 2
Fig 2. Wet-lab assays with genetically engineered mouse models of breast cancer were used to test the ability of chemical perturbations to stop metastatic phenotypes.
Top panel, dissemination assays: Mammary tissue from a Twist1-inducible mouse model was dissected and stromal cells were removed to generate epithelial organoids. Larger organoids of 200–500 cells were isolated and embedded into 3D Matrigel growth medium. Following activation of Twist1, organoid dissemination upon treatment with compounds was quantified relative to untreated controls [21]. Bottom panel, colony formation assays: Mammary tumors from a genetically engineered mouse model were dissected, depleted of stromal cells, and used to generate epithelial organoids. Organoids were digested to clusters of 2–10 cancer cells and embedded into 3D Matrigel. The ability of organoids to form colonies subsequent to treatment with compounds was quantified relative to untreated controls.
Fig 3
Fig 3. NetPert prioritization vs dissemination assay results.
Subnetwork of intermediate proteins (shade of red) tested in the dissemination assay [21], driver Twist1 (yellow, bold outline), differentially expressed response genes (shade of red, bold outline) that are either part of the network and tested in the assay, and differentially expressed response genes (blue, bold outline) that have a direct interaction with a tested intermediate protein. Gene-regulatory interactions (solid line with arrow head). Protein-protein interactions (solid line). Left panel: NetPert rankings of tested intermediates and differentially expressed response genes that are part of the network (shade of red). The deeper the red shade, the higher the ranking. Right panel: Dissemination assay results of tested intermediates and differentially expressed response genes that are part of the network (shade of red). The deeper the red shade, the greater the inhibition of dissemination by small molecules targeting a protein.
Fig 4
Fig 4. Diffusion time.
Left panel: The density that has left the driver (open circles) and its approximation by the non-returning approximation (solid line) are shown as a function of the diffusion time. The total density at response genes (open triangles) is shown normalized to its maximum value, which occurs when approximately 80% of the density has left the driver. Right panel: Correlation with dissemination assay results [21] versus amount of density that has left the driver for NetPert, NetPert-Endpoints, TieDIE, and betweenness centrality.
Fig 5
Fig 5. JAK/STAT signaling and HDAC subnetworks.
The protein TWIST1 (yellow), a driver of metastatic phenotypes, signals through non-differentially-expressed intermediates (red) to cause differential expression of response genes (blue). Lines indicate protein-protein interactions and directed arrows represent gene-regulatory interactions. Top panel: In a colony formation assay, compounds targeting BRD4 and CDK9 eliminated colony formation entirely. Compounds targeting FGFR2 reduced colony formation to 34–74% of untreated control; compounds targeting PDGFRA reduced colony formation to 34–67% of untreated; and a compound targeting STAT3 reduced colony formation to 10% of untreated. Bottom panel: Compounds targeting HDAC1, HDAC2, HDAC3, and HDAC6 eliminated colony formation entirely.
Fig 6
Fig 6. Subnetworks of TRP53 and JUN.
Driver Twist1 (yellow). Gene-regulatory interactions (solid line with arrow head). Protein-protein interactions (solid line). Top panel: Trp53 (red); the differentially expressed genes (blue) that are TRP53 targets or proteins interact with TRP53. Bottom panel: Jun (red); the top 10 differentially expressed genes (blue) ranked by NetPert that interact with Jun and are sensitive to Jun perturbations with Twist1 as the driver; and the top 10 intermediate genes (red) ranked by NetPert that interact with Twist1 and Jun that Jun is sensitive to with Twist1 as the driver and Jun as the response.
Fig 7
Fig 7. Subnetwork of EGFR.
Egfr (red); driver Twist1 (yellow); the top 10 differentially expressed genes (blue) ranked by NetPert that interact with Egfr and are sensitive to Egfr perturbations with Twist1 as the driver; and the top 10 intermediate genes (red) ranked by NetPert that interact with Twist1 and Egfr that Egfr is sensitive to with Twist1 as the driver and Egfr as the response. Gene-regulatory interactions (solid line with arrow head). Protein-protein interactions (solid line).

Similar articles

Cited by

References

    1. Shamir ER, Pappalardo E, Jorgens DM, Coutinho K, Tsai WT, Aziz K, et al.. Twist1-induced dissemination preserves epithelial identity and requires E-cadherin. Journal of Cell Biology. 2014;204(5):839–856. doi: 10.1083/jcb.201306088 - DOI - PMC - PubMed
    1. Cheung KJ, Padmanaban V, Silvestri V, Schipper K, Cohen JD, Fairchild AN, et al.. Polyclonal breast cancer metastases arise from collective dissemination of keratin 14-expressing tumor cell clusters. Proceedings of the National Academy of Sciences. 2016;113(7):E854–E863. doi: 10.1073/pnas.1508541113 - DOI - PMC - PubMed
    1. Padmanaban V, Krol I, Suhail Y, Szczerba BM, Aceto N, Bader JS, et al.. E-cadherin is required for metastasis in multiple models of breast cancer. Nature. 2019;573(7774):439–444. doi: 10.1038/s41586-019-1526-3 - DOI - PMC - PubMed
    1. Ewald AJ, Brenot A, Duong M, Chan BS, Werb Z. Collective Epithelial Migration and Cell Rearrangements Drive Mammary Branching Morphogenesis. Developmental Cell. 2008;14(4):570–581. doi: 10.1016/j.devcel.2008.03.003 - DOI - PMC - PubMed
    1. Ewald AJ, Huebner RJ, Palsdottir H, Lee JK, Perez MJ, Jorgens DM, et al.. Mammary collective cell migration involves transient loss of epithelial features and individual cell migration within the epithelium. Journal of Cell Science. 2012;125(11):2638–2654. doi: 10.1242/jcs.096875 - DOI - PMC - PubMed

Substances