. 2024 Sep:75:103251.
doi: 10.1016/j.redox.2024.103251. Epub 2024 Jun 20.

NADPH Alters DUOX1 Calcium Responsiveness

Affiliations

NADPH Alters DUOX1 Calcium Responsiveness

Gregory E Conner. Redox Biol. 2024 Sep.

Abstract

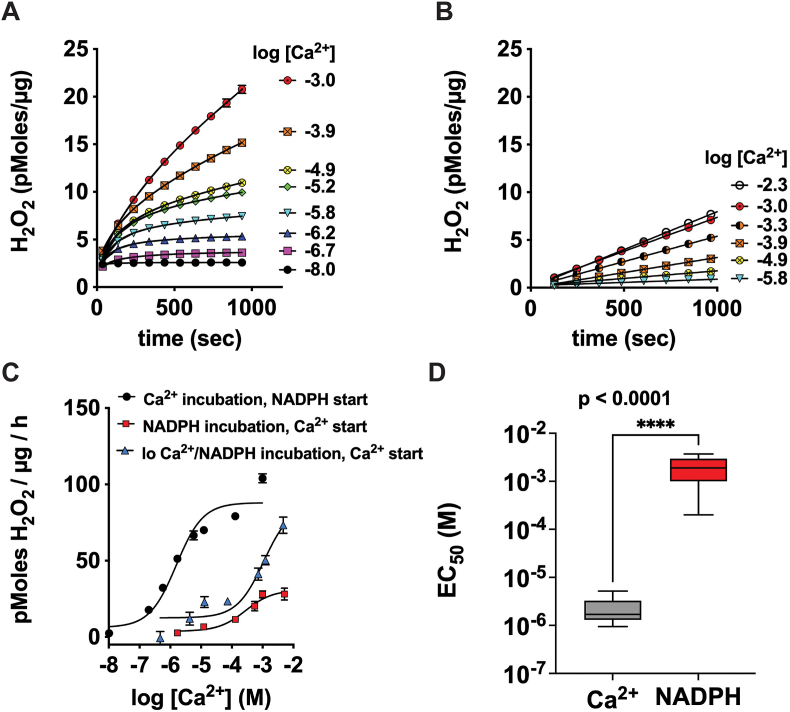
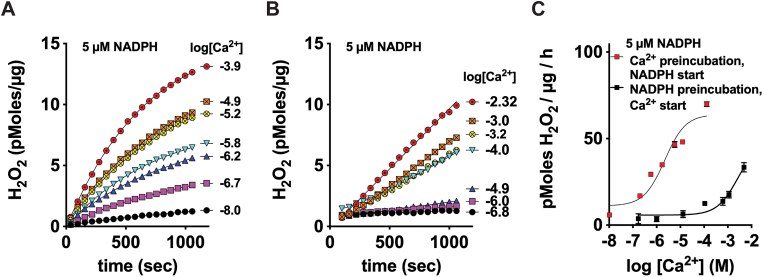
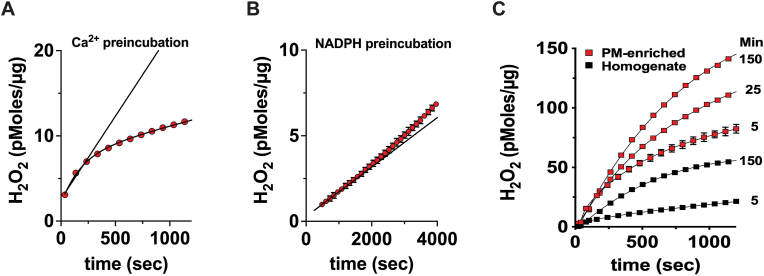
Hydrogen peroxide is a key element in redox signaling and in setting cellular redox tone. DUOX1 and DUOX2, that directly synthesize hydrogen peroxide, are the most abundant NADPH oxidase transcripts in most epithelia. DUOX1 and DUOX2 hydrogen peroxide synthesis is regulated by intracellular calcium transients and thus cells can respond to signals and initiate responses by increasing cellular hydrogen peroxide synthesis. Nevertheless, many details of their enzymatic regulation are still unexplored. DUOX1 and DUOXA1 were expressed in HEK293T cells and activity was studied in homogenates and membrane fractions. When DUOX1 homogenates or membranes were pre-incubated in NADPH and started with addition of Ca2+, to mimic intracellular activation, progress curves were distinctly different from those pre-incubated in Ca2+ and started with NADPH. The Ca2+ EC50 for DUOX1's initial rate when pre-incubated in Ca2+, was three orders of magnitude lower (EC50 ∼ 10-6 M) than with preincubation in NADPH (EC50 ∼ 10-3 M). In addition, activity was several fold lower with Ca2+ start. Identical results were obtained using homogenates and membrane fractions. The data suggested that DUOX1 Ca2+ binding in expected physiological signaling conditions only slowly leads to maximal hydrogen peroxide synthesis and that full hydrogen peroxide synthesis activity in vivo only can occur when encountering extremely high concentration Ca2+ signals. Thus, a complex interplay of intracellular NADPH and Ca2+ concentrations regulate DUOX1 over a wide extent and may limit DUOX1 activity to a restricted range and spatial distribution.

Keywords: DUOX; Hydrogen peroxide; NADPH oxidase.


Conflict of interest statement

Declaration of competing interest The authors declare that they have no known competing financial interests or personal relationships that could have appeared to influence the work reported in this paper.

Figures

Image 1
Graphical abstract
Fig. 1
Fig. 1
Preincubation of homogenates in NADPH alters DUOX1 Ca2+ sensitivity. Panel A, Homogenates were preincubated with increasing [Ca2+] and reactions were started by addition of 50 μM NADPH. Resorufin fluorescence was measured at timed intervals and H2O2 calculated from parallel standard curves. Progress curves were fit to a double exponential (equation 3 in Ref. [35], viz. Supplemental methods) using Graphpad Prism 9. Panel B, homogenates were preincubated with 50 μM NADPH and reactions were started by addition of increasing [Ca2+]. Resorufin fluorescence was measured at timed intervals and H2O2 calculated as in panel A. Panel C, EC50's for Ca2+ were obtained by fitting initial rates of reactions to a 3-parameter dose response curve using Graphpad Prism 9 for reactions shown in panel A preincubated in various [Ca2+] and started with NADPH (1.6 μM, CI95 = 0.9–2.9 μM, black circles in panel C); using reactions shown in panel B preincubated in NADPH and started with various [Ca2+] (0.3 mM, CI95 = 0.4–2.6 mM, red squares panel C); and using reactions preincubated with sequential addition of 100 nM Ca2+ followed by NADPH and finally starting reactions with addition of various higher [Ca2+] (progress curves not shown) (0.96 mM, CI95 = 0.34–2.2 mM, blue triangles panel C). Panels A - C are mean values of triplicate assays ± S.D. from a single experiment. Some error bars are within the symbols. Panel D, mean EC50 values from repeated experiments, as described in panel A (Ca2+ preincubation) and B (NADPH preincubation), were respectively, 2.3 ± 1.3 μM (SD), n = 16 and 1.9 ± 1.2 mM (SD), n = 5, p < 0.0001, Mann-Whitney test.
Fig. 2
Fig. 2
Preincubation of PM-enriched fractions in NADPH alters DUOX1 Ca2+ sensitivity. Panel A, PM-enriched fractions were preincubated with increasing [Ca2+] and reactions were started by addition of 5 μM NADPH. Resorufin fluorescence was measured at timed intervals and H2O2 calculated from parallel standard curves. Progress curves were fit to a double exponential (equation 3 in Ref. [35], viz. Supplemental methods) using GraphPad Prism 9. Panel B, Homogenates were preincubated with 5 μM NADPH and reactions were started by addition of increasing [Ca2+]. Resorufin fluorescence was measured at timed intervals and H2O2 calculated as in panel A. Panel C, The EC50 was calculated from Ca2+ dose response curves: using reactions shown in panel A preincubated in various [Ca2+] and started with NADPH (2.2 μM, CI95 = 0.9–5.6 μM, red circles in panel C) and using reactions shown in panel B preincubated in NADPH and started with various [Ca2+] (2.5 mM, CI95 = 1.2–8.2 mM, black squares panel C). EC50's for Ca2+ were obtained by fitting initial rates of reactions to a 3-parameter dose response curve using GraphPad Prism 9. Panels A-C are mean values of triplicates ± S.D. from a single experiment. Some error bars are within the symbols.
Fig. 3
Fig. 3
DUOX1 progress curves are nonlinear. Panel A, Homogenates were preincubated in 12 μM Ca2+ and reactions were started with 50 μM NADPH, and in Panel B, homogenates were preincubated in 50 μM NADPH and started by addition of Ca2+ to 12 μM. Lines represent the slope over the first three data points. Preincubation in Ca2+ showed an initial burst of activity followed by a slower rate. Conversely, preincubation with NADPH showed a lower initial rate that slowly increased with longer reaction times. Panel C. Homogenates (black squares) or PM-enriched fractions (red squares) were preincubated in 12 μM Ca2+ for 5, 25 or 150 min as indicated in the graph before starting with 50 μM NADPH addition. Preincubation in Ca2+ increased the activity. Plotted values are means of triplicate assays. Some error bars are within the symbols.

References

    1. Sies H. Hydrogen peroxide as a central redox signaling molecule in physiological oxidative stress: oxidative eustress. Redox Biol. 2017;11:613–619. PubMed PMID: 28110218. - PMC - PubMed
    1. Morand S., Ueyama T., Tsujibe S., Saito N., Korzeniowska A., Leto T.L. Duox maturation factors form cell surface complexes with Duox affecting the specificity of reactive oxygen species generation. Faseb. J. 2009;23(4):1205–1218. PubMed PMID: 19074510. - PMC - PubMed
    1. Conner G.E. Regulation of dual oxidase hydrogen peroxide synthesis results in an epithelial respiratory burst. Redox Biol. 2021;41 PubMed PMID: 33743241. - PMC - PubMed
    1. Rigutto S., Hoste C., Grasberger H., Milenkovic M., Communi D., Dumont J.E., Corvilain B., Miot F., De Deken X. Activation of dual oxidases Duox1 and Duox2: differential regulation mediated by camp-dependent protein kinase and protein kinase C-dependent phosphorylation. J. Biol. Chem. 2009;284(11):6725–6734. PubMed PMID: 19144650. - PMC - PubMed
    1. Wu J.X., Liu R., Song K., Chen L. Structures of human dual oxidase 1 complex in low-calcium and high-calcium states. Nat. Commun. 2021;12(1):155. PubMed PMID: 33420071. - PMC - PubMed

LinkOut - more resources