. 2024 Aug;23(8):100809.
doi: 10.1016/j.mcpro.2024.100809. Epub 2024 Jun 25.

Proximity Labeling Proteomics Reveals Kv1.3 Potassium Channel Immune Interactors in Microglia

Affiliations

Proximity Labeling Proteomics Reveals Kv1.3 Potassium Channel Immune Interactors in Microglia

Christine A Bowen et al. Mol Cell Proteomics. 2024 Aug.

Abstract

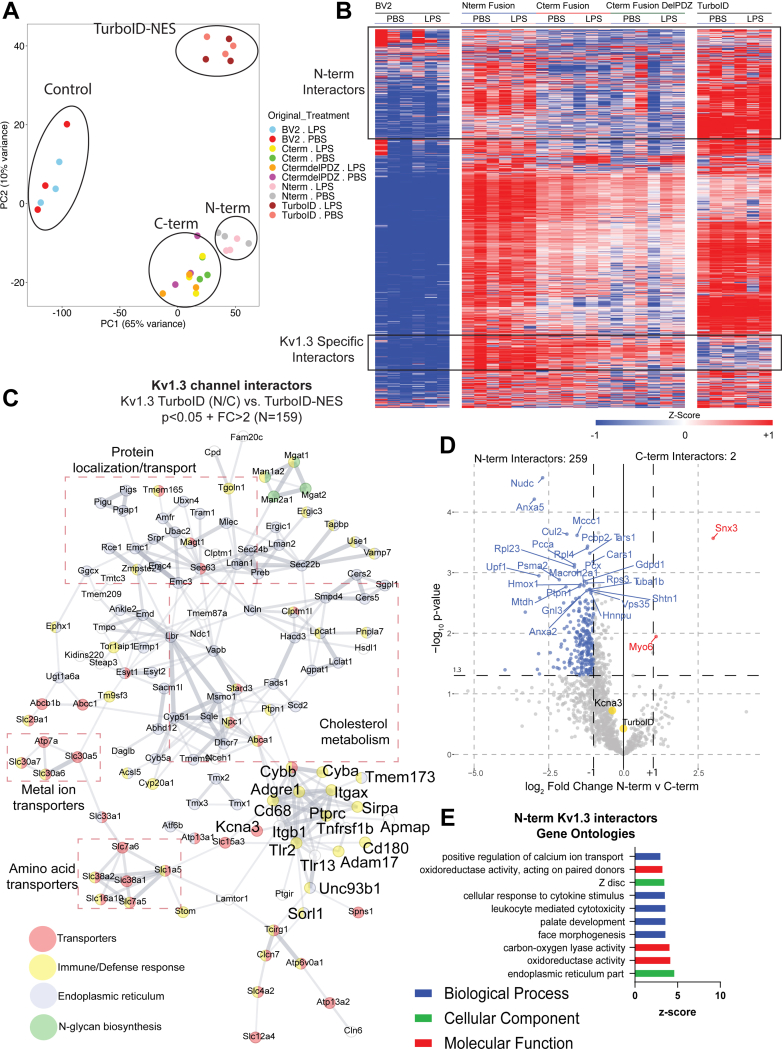
Microglia are resident immune cells of the brain and regulate its inflammatory state. In neurodegenerative diseases, microglia transition from a homeostatic state to a state referred to as disease-associated microglia (DAM). DAM express higher levels of proinflammatory signaling molecules, like STAT1 and TLR2, and show transitions in mitochondrial activity toward a more glycolytic response. Inhibition of Kv1.3 decreases the proinflammatory signature of DAM, though how Kv1.3 influences the response is unknown. Our goal was to identify the potential proteins interacting with Kv1.3 during transition to DAM. We utilized TurboID, a biotin ligase, fused to Kv1.3 to evaluate potential interacting proteins with Kv1.3 via mass spectrometry in BV-2 microglia following TLR4-mediated activation. Electrophysiology, Western blotting, and flow cytometry were used to evaluate Kv1.3 channel presence and TurboID biotinylation activity. We hypothesized that Kv1.3 contains domain-specific interactors that vary during a TLR4-induced inflammatory response, some of which are dependent on the PDZ-binding domain on the C terminus. We determined that the N terminus of Kv1.3 is responsible for trafficking Kv1.3 to the cell surface and mitochondria (e.g., NUDC, TIMM50). Whereas, the C terminus interacts with immune signaling proteins in a lipopolysaccharide-induced inflammatory response (e.g., STAT1, TLR2, and C3). There are 70 proteins that rely on the C-terminal PDZ-binding domain to interact with Kv1.3 (e.g., ND3, Snx3, and Sun1). Furthermore, we used Kv1.3 blockade to verify functional coupling between Kv1.3 and interferon-mediated STAT1 activation. Overall, we highlight that the Kv1.3 potassium channel functions beyond conducting the outward flux of potassium ions in an inflammatory context and that Kv1.3 modulates the activity of key immune signaling proteins, such as STAT1 and C3.

Keywords: Kv1.3 potassium channel; microglia; neurodegeneration; neuroinflammation; proximity labeling.


Conflict of interest statement

Conflict of interest H. W. is an inventor on a University of California patent claiming PAP-1 for immunosuppression. This patent has been abandoned because of its short remaining patent life. The authors declare no competing interests.

Figures

None
Graphical abstract
Fig. 1
Fig. 1
Transfected cells show Kv1.3 channel activity and biotinylation of proximal proteins.A, schematic of experimental design. HEK-293 cells were transfected with Kv1.3-turboID fusion constructs for 24 h and then exposed to biotin for 24 h. Cells were then lysed in 8 M urea and pulled-down using magnetic beads fused to streptavidin prior to mass spectrometry. B, constructs of Kv1.3 fusion with TurboID. Each fusion construct contains TurboID, a 15-amino acid linker, a V5 tag, and Kv1.3. The N-terminal fusion has TurboID located on the N terminus of Kv1.3, and the C-terminal fusion has TurboID located on the C-term of Kv1.3. C, electrophysiology of HEK-293 cells transfected with Kv1.3-TurboID constructs shows similar biophysical properties and pharmacological responses to the Kv1.3 inhibitor PAP-1. D, averaged current traces showing N-terminal and C-terminal fusions induce a slight slowing of current inactivation, whereas the C-terminal fusion enhances the activation compared with WT control. E, the voltage dependence of activation of Kv1.3 channels fused to TurboID shows a small shift in the depolarized direction compared with the WT control. F, TurboID fusing reduces use-dependent inactivation. G, table highlighting changes in biophysical properties with TurboID fusion to Kv1.3. Statistical significance denotes p < 0.05 (∗) and p < 0.01 (∗∗). H, immunofluorescence (IF) of HEK-293 cells transfected with Kv1.3-TurboID constructs. IF highlights colocalization of biotinylated proteins (tagged with streptavidin) with V5-tagged TurboID. I, streptavidin (680) Western blot shows high biotin labeling with the presence of TurboID (n = 3). HEK-293, human embryonic kidney 293 cell line.
Fig. 2
Fig. 2
Kv1.3 interactors in HEK-293 cells show that the N terminus is associated with protein processing and the C terminus is involved in signaling.A, principal component analysis (PCA) of mass spectrometry of biotinylated proteins shows distinct separation between control and Kv1.3-TurboID transfected cells. B, differential abundance analysis of N-terminal interactors shows about 1600 protein interacting with Kv1.3. C, differential abundance analysis of C-terminal interactors shows about 1700 proteins interacting with Kv1.3. D, differential abundance comparison between N- and C-terminal interactors shows 32 proteins interacting more with the N terminus of Kv1.3 and 40 proteins interacting with the C terminus of Kv1.3. E, STRING analysis shows close associations with N-terminal interactors. Gene Ontology highlights that many of these proteins are associated with metabolic processing. F, STRING analysis and GSEA analysis show that many of the C-terminal interactors are associated with signal transduction. Darker colors represent statistical significance in GSEA results, lighter color indicates an interactor that is not present in GSEA lists but interacting with Kv1.3, and edge thickness represents confidence of interactions based on the literature. Differential abundant proteins were calculated using paired t test, where log p value >1.3 and Log2 fold change (FC) of ±1 were considered significant. n = 3. ∗∗p < 0.01, ∗∗∗ p< 0.001. GSEA, gene set enrichment analysis; HEK-293, human embryonic kidney 293 cell line.
Fig. 3
Fig. 3
BV-2 cells transduced with Kv1.3-TurboID constructs show the presence of biotinylation and channel activity.A, schematic of experimental design. BV-2 cells were transduced with Kv1-3 constructs described in Fig 1B and selected for plasmid uptake using puromycin. Cells were then exposed to LPS to induce an inflammatory response and biotin to allow for biotinylation of proximal proteins. B, quantitative RT–PCR of Kcna3 transcript shows increased Kcna3 mRNA expression in Kv1.3-TurboID transduced cell lines compared with control and Gapdh. C, flow cytometry of biotinylated proteins using Streptavidin-488 shows high biotinylation in Kv1.3-TurboID transduced cell lines independent of LPS exposure. D, Western blot depicting Streptavidin-680 labeling, which highlights biotinylation increase in the presence of TurboID. Ponceau staining shows no change in protein concentration across samples. E, scattered plot shows increased channel density in BV-2 cells transduced with Kv1.3-TurboID constructs. F, inhibition of Kv1.3 by PAP-1, a Kv1.3-selective small molecule inhibitor, following transduction o f Kv1.3-TurboID constructs. G, exemplifying current traces showin g changes in inactivation and activation kinetics in transduced Kv1.3-TurboID cells. H, fractional currents show reduced use-dependent current reduction of Kv1.3 currents in Kv1.3-TurboID transduced cells. I, voltage-dependent activation of Kv1.3 is shown to be shifted in the depolarized direction in cells transduced by Kv1.3-TurboID constructs. J, table summarizing electrophysiology results. Statistical significance denotes p < 0.05 (∗), p < 0.01 (∗∗), and p < 0.001 (∗∗∗). LPS, lipolysaccharide.
Fig. 4
Fig. 4
Microglial Kv1.3 have distinct N-terminal and C-terminal interactors.A, principal component analysis (PCA) of mass spectrometry of biotinylated proteins shows distinct clustering of controls, TurboID, Kv1.3 N-term fusion, and Kv1.3 C-term fusion. B, heat map of biotinylated proteins, designed by Morpheus, shows distinct clusters of Kv1.3-specific interactors, Kv1.3 N-terminal specific interactors, and Kv1.3 C-terminal interactors. Individual proteins were colored based on z-score, where the darker shades of red indicate +1 and the darker shades of blue indicates −1. Hierarchical clustering arranged proteins based on groups. C, STRING analysis highlights proteins differentially interacting with Kv1.3 over global TurboID expression. Color indicates protein type. Associated protein groups are boxed. D, differential enrichment analysis (DEA) of proteins enriched with Kv1.3 N-terminal fusion and Kv1.3 C-terminal fusion indicates about 250 N-terminal interactors and 2 C-terminal interacIs. E, gene set enrichment analysis (GSEA) analysis shows most of the interacting proteins with the N terminus of Kv1.3 appear to be a part of calcium transport and oxidoreductase activity. Differential abundant proteins were calculated using paired t test, where log p value >1.3 and Log2 fold change (FC) of ±1 were considered significant (n = 3).
Fig. 5
Fig. 5
Inflammatory exposure results in a PDZ-binding domain–dependent interactions with the C terminus of Kv1.3.A, differential enrichment analysis (DEA) between N-terminal interactors and N-terminal interactors with LPS exposure highlights minimal change in N-terminal interactors with LPS exposure. B, DEA between C-terminal interactors and C-terminal interactors shows 27 proteins interacting with the C-term of Kv1.3 during homeostasis and 36 proteins interacting with the C terminus during an LPS-induced inflammatory response. C, gene set enrichment analysis (GSEA) shows protein transport and processing terms downregulated during an LPS response. D, GSEA shows an upregulation of immune signaling terms associated with the C terminus of Kv1.3 during LPS immune stimulation. E, DEA comparison of Kv1.3 C-terminal interactors and C-terminal interactors with the PDZ-binding domain removed shows 70 proteins downregulated and 16 upregulated with deletion of the PDZ-binding domain. F, GSEA of proteins downregulated with the deletion of the PDZ-binding domain are mostly associated with immune-signaling response and protein packaging. G, GSEA of proteins upregulated with deletion of the Kv1.3 C-terminal PDZ-binding domain shows terms associated with lipid biosynthesis and alcohol metabolism. Differential abundant proteins were calculated using paired t test, where log p value >1.3 and Log2 fold change (FC) of ±1 were considered significant. LPS, lipopolysaccharide.
Fig. 6
Fig. 6
Confirmation of Kv1.3 interactions with mitochondria and immune signaling.A, validation of mitochondria enrichment in the subcellular fractions obtained during the isolation process from untransduced BV-2 cells (negative control) and BV-2 cells transduced with Kv1.3-TurboID constructs (N-term, C-term, and C-termΔPDZ). Total homogenates (0) were fractionated to heavy membranes (A1), crude mitochondria (A2), and mitochondria-enriched fractions (A3) by sequential centrifugation and then analyzed by Western blot using HSP60 as a mitochondrial marker. B, quantification of HSP60 comparing total homogenates (0) to mitochondria-enriched fractions (A3). p Value for two-sided unpaired t test is indicated. C, representative blot of V5 tag (TurboID fusion) in fractions 0–A3 from BV-2 cells transduced with Kv1.3-TurboID constructs. D, STRING analysis of Kv1.3 interactors crossreferenced to MITOCARTA 3.0 database highlights many proteins interacting with Kv1.3 associated with the mitochondria and the functional and physical interactions. E, schematic of standard and adapted Luminex assay. Standard assay includes a bead attached to a capture antibody that binds to the protein of interest, then a biotinylated antibody binds to the protein of interest to form a sandwich. Streptavidin with a fluorophore binds to the biotin. This estimates how much of a protein is in a sample. The adapted assay includes a capture antibody with bead and then adds streptavidin with the fluorophore directly to the protein of interest. The adapted assay captures abundance of proteins interacting with Kv1.3 directly. F, adapted Luminex assay of intracellular C3 shows an increased interaction with Kv1.3 at a resting state. G, standard Luminex assay of proteins isolated from BV-2 cells transduced with Kv1.3-TurboID highlights an increase in intracellular C3 with the overexpression of Kv1.3, independent of LPS exposure. H, standard LuMINEX assay of pSTAT1 shows activation of pSTAT1 in the presence of IFN-γ, a known activator of the STAT1 signaling pathway. In the presence of LPS and IFN-γ, the removal of the PDZ-binding domain in Kv1.3 leads to a decrease in the presence of pSTAT1. I, Western blot analysis of whole cell lysate from BV-2 cells expressing N-terminal Kv1.3-TurboID shows reduced STAT1 phosphorylation upon induction with IFN-γ post Kv1.3 blockade with PAP-1. No changes were observed in the total STAT level. J, Quantification of pSTAT1 shows decrease of IFN-γ response with PAP-1 exposure using densitometry. K, densitometry analysis shows total STAT1 is unchanged by IFN-γ exposure or PAP-1 exposure. Significance was calculated utilizing unpaired t test. ∗ p < 0.05, ∗∗p < 0.01, ∗∗∗p < 0.001, ∗∗∗∗p < 0.0001. n = 3. IFN-γ, interferon gamma, LPS, lipopolysaccharide; pSTAT1, phosphorylated STAT1.
Fig. 7
Fig. 7
Schematic of Kv1.3 interactors in microglia during homeostatic and neuroinflammatory states. During homeostasis, many of the interactors of Kv1.3 are shared. The N terminus appears to be responsible for protein processing and tracking to the mitochondria, whereas the C terminus has some PDZ-binding domain–specific interactors that are largely associated with intracellular processing. During LPS stimulation of an immune response, the N terminus of Kv1.3 has very little change in the interacting partners, whereas the C terminus has PDZ-binding domain–dependent interactors associated with immune signaling. LPS, lipopolysaccharide.

References

    1. Woodburn S.C., Bollinger J.L., Wohleb E.S. The semantics of microglia activation: neuroinflammation, homeostasis, and stress. J. Neuroinflammation. 2021;18:258. - PMC - PubMed
    1. Schafer D.P., Lehrman E.K., Kautzman A.G., Koyama R., Mardinly A.R., Yamasaki R., et al. Microglia sculpt postnatal neural circuits in an activity and complement-dependent manner. Neuron. 2012;74:691–705. - PMC - PubMed
    1. Keren-Shaul H., Spinrad A., Weiner A., Matcovitch-Natan O., Dvir-Szternfeld R., Ulland T.K., et al. A unique microglia type associated with restricting development of Alzheimer’s disease. Cell. 2017;169:1276–1290.e17. - PubMed
    1. Deczkowska A., Keren-Shaul H., Weiner A., Colonna M., Schwartz M., Amit I. Disease-associated microglia: a universal immune sensor of neurodegeneration. Cell. 2018;173:1073–1081. - PubMed
    1. Rangaraju S., Gearing M., Jin L.W., Levey A. Potassium Channel Kv1.3 is highly expressed by microglia in human Alzheimer’s disease. J. Alzheimer’s Dis. 2015;44:797–808. - PMC - PubMed