. 2024 Aug 27;52(15):8643-8660.
doi: 10.1093/nar/gkae558.

PCAF promotes R-loop resolution via histone acetylation

Affiliations

PCAF promotes R-loop resolution via histone acetylation

Seo Yun Lee et al. Nucleic Acids Res. .

Abstract

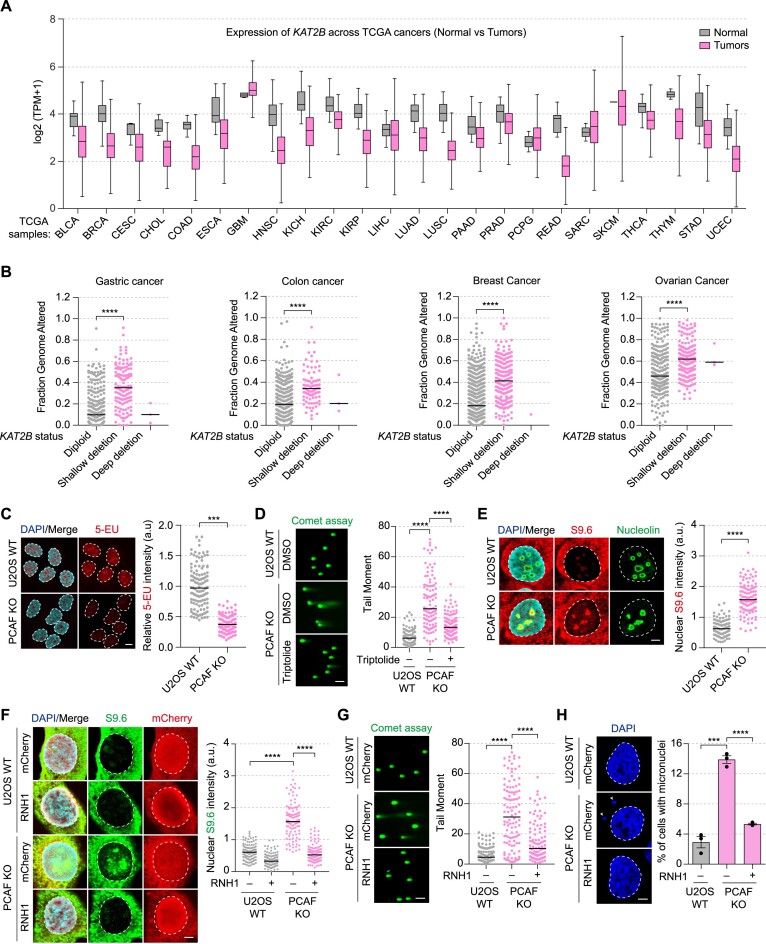
R-loops cause genome instability, disrupting normal cellular functions. Histone acetylation, particularly by p300/CBP-associated factor (PCAF), is essential for maintaining genome stability and regulating cellular processes. Understanding how R-loop formation and resolution are regulated is important because dysregulation of these processes can lead to multiple diseases, including cancer. This study explores the role of PCAF in maintaining genome stability, specifically for R-loop resolution. We found that PCAF depletion promotes the generation of R-loop structures, especially during ongoing transcription, thereby compromising genome stability. Mechanistically, we found that PCAF facilitates histone H4K8 acetylation, leading to recruitment of the a double-strand break repair protein (MRE11) and exonuclease 1 (EXO1) to R-loop sites. These in turn recruit Fanconi anemia (FA) proteins, including FANCM and BLM, to resolve the R-loop structure. Our findings suggest that PCAF, histone acetylation, and FA proteins collaborate to resolve R-loops and ensure genome stability. This study therefore provides novel mechanistic insights into the dynamics of R-loops as well as the role of PCAF in preserving genome stability. These results may help develop therapeutic strategies to target diseases associated with genome instability.

Plain language summary

R-loops are harmful DNA-RNA hybrid structures that cause genome instability, disrupting normal cell functions. This study explored the role of the protein PCAF in resolving R-loops to maintain genome stability. The researchers found that depleting PCAF leads to increased R-loop formation, especially during transcription, compromising the genome. Mechanistically, PCAF facilitates histone acetylation, recruiting proteins like MRE11, EXO1, FANCM and BLM to R-loop sites. These proteins collaborate to resolve R-loop structures. The findings suggest that PCAF, histone acetylation, and these repair proteins work together to untangle R-loops and preserve genome integrity. Understanding this process provides insights into R-loop dynamics and PCAF's role in genome maintenance, potentially leading to therapeutic strategies for diseases associated with genome instability, such as cancer.


Figures

Graphical Abstract
Graphical Abstract
Figure 1.
Figure 1.
KAT2B (PCAF) is suppressed in human cancer, which accelerates genomic instability. (A) The pan-cancer analysis in the UALCAN database showed KAT2B expression in different cancers. (B) Fraction of Genome Altered in TCGA Gastric, Colon, Breast, Ovarian cohort. Black bars indicate the median and statistical significances were analyzed by two-tailed unpaired t-test. ****P < 0.0001. (C) Loss of PCAF suppresses the transcription process. The transcription level was confirmed by nascent 5-EU incorporation, and 5-EU intensity was normalized to the mean of the U2OS WT value. Representative images are shown in the left panel and quantification in the right panel (from >100 cells). ***P < 0.001. The scale bar indicates 10 μm. (D) Loss of PCAF triggers DNA breaks in a transcription-dependent manner. U2OS WT and PCAF KO cells were treated with transcription inhibitor (Triptolide; 1 μM, 3 h) and DNA breaks were monitored by neutral comet assay (left panel). Tail moments were calculated, and statistical analysis was performed by the Mann–Whitney test (right panel). The black bar indicates the median from >100 cells. ****P < 0.0001. Scale bar indicates 100 μm. (E) PCAF deficiency induces R-loops. R-loop levels were determined using immunofluorescence (IF) with S9.6 antibody (left panel). Nuclear S9.6 intensity was quantified by ImageJ and normalized to U2OS WT (right panel). The black bar indicates the median from > 100 cells. ****P < 0.0001. Scale bar indicates 5 μm. (F) IF images and quantification of WT and PCAF KO cells stained with S9.6 (green) and RNase H1 (mCherry). Diminution of the nuclear S9.6 signal by RNase H1 (RNH1) overexpression confirmed the signal specificity. Data analysis was performed as in Figure 1E. ****P < 0.0001. (G) DNA breaks in PCAF KO cells were generated by R-loop accumulation. DNA breaks were measured by neutral comet assay and representative images are shown in the left panel. Data was analyzed by the Mann–Whitney test for significance. Black bars indicate the median from >100 cells. ****P < 0.0001. The scale bar indicates 100 μm. (H) PCAF-mediated R-loop accumulation leads to genome instability. PCAF-deficient cells were analyzed for micronuclei formation in the presence or absence of RNase H1 (RNH1). Data represent the mean ± S.E.M. Scale bar indicated 5 μm.
Figure 2.
Figure 2.
The recruitment of MRE11/EXO1 is necessary for PCAF at R-loop sites. (A) Functional analysis examined the relationship between PCAF and R-loop regulating factors. Cells were transfected with indicated siRNAs and then evaluated for DNA breaks by neutral comet assay. Black bars represent the median from >100 cells, with significance assessed by the Mann–Whitney test. ****P < 0.0001, n.s., not significant. Scale bar indicates 100 μm. (B, C) R-loop PLA assay with MRE11 (B) and EXO1 (C) antibodies. U2OS WT and PCAF KO cells were treated with CPT (10 μM, 2 h) and then subjected to a PLA assay to assess the physical closeness with the R-loop. The representative images are shown in the left panel, and the relative PLA intensity was quantified using ImageJ (right panel). Data were analyzed by the Mann–Whitney test for significance. Black bars indicate the median from >100 cells. ****P < 0.0001. The scale bar indicates 5 μm.
Figure 3.
Figure 3.
PCAF-mediated histone acetylation is required to prevent R-loop accumulation. (A) Diagram of PCAF domain structure. (B) Site-specific mutation of PCAF HAT domain (PCAF YFAA) for inhibiting acetylation activity. (C) Comet assay of PCAF KO cells expressing GFP-PCAF WT or catalytic inactive mutant (YFAA). PCAF KO Cells were transfected with GFP-tagged PCAF WT or YFAA, and DNA breaks were analyzed by neutral comet assay (left panel, quantified in the right panel). Statistical analysis of DNA breaks was carried out using the Mann–Whitney test (from >100 cells). ****P < 0.0001. n.s., not significant. The scale bar indicates 100 μm. (D) Acetylation activity of PCAF is necessary for R-loop resolution. GFP-PCAF WT and YFAA were transfected into PCAF KO cells and then stained with S9.6/GFP antibodies. The nuclear S9.6 intensity was measured using ImageJ, and statistical analysis was performed by the Mann–Whitney test (from >100 cells). ****P < 0.0001. n.s., not significant. Scale bar indicates 5 μm. (E) Western blotting for endogenous PCAF and H4K8ac after R-loop IP. U2OS WT and PCAF KO cells were harvested and immunoprecipitated with the S9.6 antibody. PCAF and H4K8ac levels were detected in the input and R-loop IP samples. IgG was used as IP control. (F) Evaluation of the H4K8ac levels in the R-loop site. PLA assay between S9.6 and H4K8ac was performed after CPT (10 μM, 2 h) treatment, and the relative PLA intensity was calculated by ImageJ. Data was analyzed by the Mann–Whitney test, and the black bar indicated the median from >100 cells. ****P < 0.0001. Scale bar indicates 5 μm.
Figure 4.
Figure 4.
MRE11 and EXO1 were recruited to R-loop sites through binding to H4K8ac. (A) Schematic illustrations of MRE11 WT and mutant (H4K8ac binding mutant; △1). (B) Analysis of the interaction with the R-loop was conducted using MRE11 WT or mutant (H4K8ac binding mutant; △1). MRE11-deficient cells were transfected with SFB-NLS-MRE11 WT and mutant (△1), followed by immunoprecipitated with S9.6 antibody. The input and IP samples were detected using Flag and H4K8ac antibodies. (C) PLA assays were conducted between S9.6 and Flag-MRE11. Cells were transfected with SFB vectors for 24 h and changed with the new medium. Cells were further incubated and treated with DMSO or CPT (10 μM, 2 h) before PLA assay. Relative PLA intensity was analyzed using the Mann–Whitney test, and the black bar indicates the median from > 100 cells. ****P < 0.0001, ***P < 0.001, **P < 0.01. The scale bar indicates 5 μm. (D) H4K8ac binding activity of MRE11 is required for R-loop resolution. R-loop levels were analyzed by dot blot assay against anti-S9.6 and quantified. Parallel ssDNA dot blots provided a loading control, and the S9.6 signal was normalized to ssDNA level and EV control. Statistical significances were analyzed by a two-tailed unpaired t-test (mean ± S.E.M.). ****P < 0.0001. (E) Domain diagram of EXO1 WT and H4K8ac binding mutant (△PIN). (F) R-loop IP was performed for EXO1 WT and mutant (H4K8ac binding mutant; △PIN). EXO1-depleted cells were transfected with SFB-NLS EXO1 (WT or mutant) and harvested for R-loop IP. The recruitment of EXO1 to R-loop sites was observed using western blotting against anti-Flag and anti-H4K8ac. (G) PLA assay was performed in EXO1-deficient cells and analyzed as in Figure 4C. (H) The R-loop levels were assessed using a dot blot assay. EXO1-depleted cells were transfected with the indicated SFB vectors and analyzed as in Figure 4D.
Figure 5.
Figure 5.
PCAF recruits Fanconi Anemia (FA)-associated helicases to the R-loop site. (A–D) The recruitment of FANCM (A and B) and BLM (C and D) was analyzed by ChIP-qPCR assay at R-loop prone loci (β-actin, BTBD19 and TFPT) in MRE11 or EXO1 knockdown cells. Data are presented as mean ± S.E.M. (N = 3) and statistical significance is indicated as ****P < 0.0001, ***P < 0.001, **P < 0.01, *P < 0.05. (E, F) Representative images and quantification of the R-loop PLA assay. Cells were treated with either DMSO or CPT (10 μM, 2 h), and PLA foci were detected (E, FANCM; F, BLM). Relative PLA intensity was analyzed using the Mann–Whitney test, and the black bar indicates the median from > 100 cells. ****P < 0.0001. The scale bar indicates 5 μm. (G–J) The recruitment of FANCM and BLM was analyzed by ChIP-qPCR assay at R-loop prone loci (β-actin, BTBD19 and TFPT). ChIP assays were performed in U2OS WT and PCAF KO cells, and immunoprecipitation was carried out using FANCM (G and H) or BLM (I and J) antibodies. Data are presented as mean ± S.E.M.; N = 3. **P < 0.01, *P < 0.05.
Figure 6.
Figure 6.
PCAF can remove pathogenic R-loops in BRCA1-, SETX-depleted cells. (A, B) Dot blot assays were performed for PCAF WT or YFAA overexpressed cells. The R-loop levels were assessed following the knockdown of BRCA1 (A) or SETX (B) and overexpression of PCAF WT or YFAA. R-loop signal was detected using the S9.6 antibody and quantified. The normalization of S9.6 intensity was performed relative to ssDNA levels and siCtrl-EV control. Statistical significances were analyzed using a two-tailed unpaired t-test. ****P < 0.0001. ***P < 0.001. (C, D) R-loop levels were detected by S9.6 IF and quantified. Cells were transfected with siRNA for BRCA1 or SETX and the expression vector for WT or YFAA mutant of PCAF. Nuclear R-loops were captured using IF with S9.6 antibody (left panel) and intensity was quantified by ImageJ (right panel). Data represents the median from >100 cells and statistical significance was analyzed by the Mann–Whitney test. ****P < 0.0001. The scale bar indicates 5 μm. (E, F) DNA breaks were measured by neutral comet assay after BRCA1 (E) or SETX (F) knockdown. Cells were transfected with the expression vector for SFB-tagged PCAF WT or YFAA mutant with siRNA against BRCA1 or SETX. Tail moments were analyzed by the Mann–Whitney test and black bars represent the median from >100 cells. ****P < 0.0001. The scale bar indicates 100 μm.
Figure 7.
Figure 7.
Model for PCAF mediated R-loop resolution. Histone acetyltransferase PCAF is responsible for acetylating histone H4K8, which facilitates the recruitment of MRE11 and EXO1 to R-loop sites. The recruitment of these proteins then leads to the recruitment of Fanconi anemia proteins FANCM and BLM, which act as a helicase to unwind the RNA-DNA hybrid structure. The coordinated actions of these proteins, facilitated by PCAF-mediated histone acetylation, prevent genome instability caused by unresolved R-loops.

References

    1. Garcia-Muse T., Aguilera A.. R loops: from physiological to pathological Roles. Cell. 2019; 179:604–618. - PubMed
    1. Santos-Pereira J.M., Aguilera A.. R loops: new modulators of genome dynamics and function. Nat. Rev. Genet. 2015; 16:583–597. - PubMed
    1. Marnef A., Legube G.. R-loops as Janus-faced modulators of DNA repair. Nat. Cell Biol. 2021; 23:305–313. - PubMed
    1. Petermann E., Lan L., Zou L.. Sources, resolution and physiological relevance of R-loops and RNA-DNA hybrids. Nat. Rev. Mol. Cell Biol. 2022; 23:521–540. - PubMed
    1. Wells J.P., White J., Stirling P.C.. Loops and their composite cancer connections. Trends Cancer. 2019; 5:619–631. - PubMed