. 2024 Jun 28;5(1):24.
doi: 10.1186/s43556-024-00187-x.

Single-cell transcriptomic profiling reveals decreased ER protein Reticulon3 drives the progression of renal fibrosis

Affiliations

Single-cell transcriptomic profiling reveals decreased ER protein Reticulon3 drives the progression of renal fibrosis

Shuai Guo et al. Mol Biomed. .

Abstract

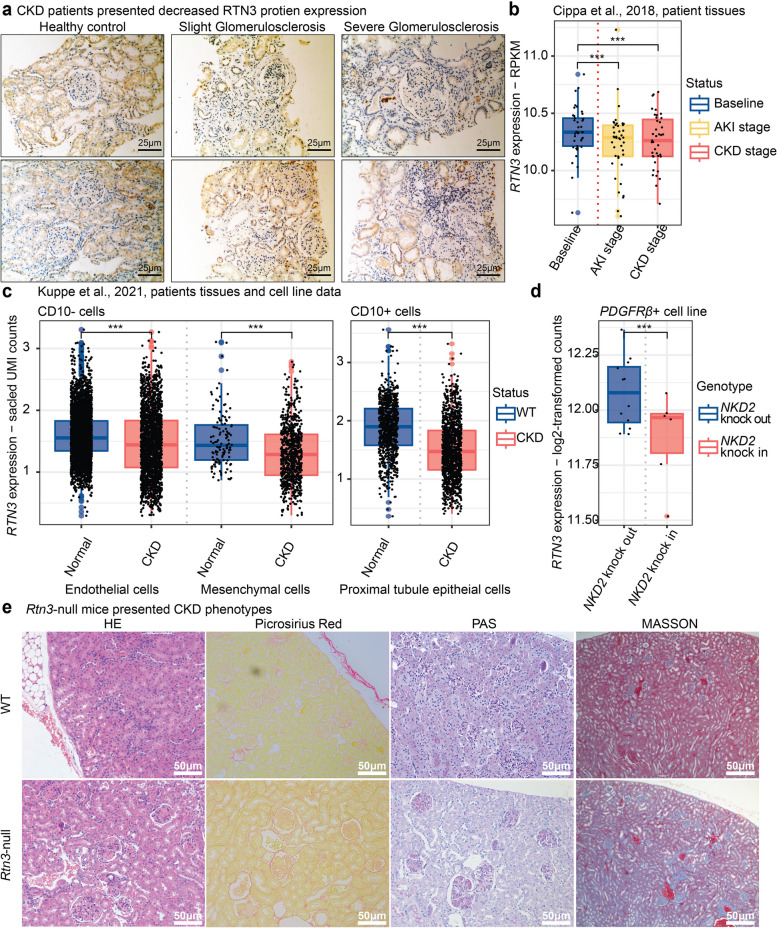
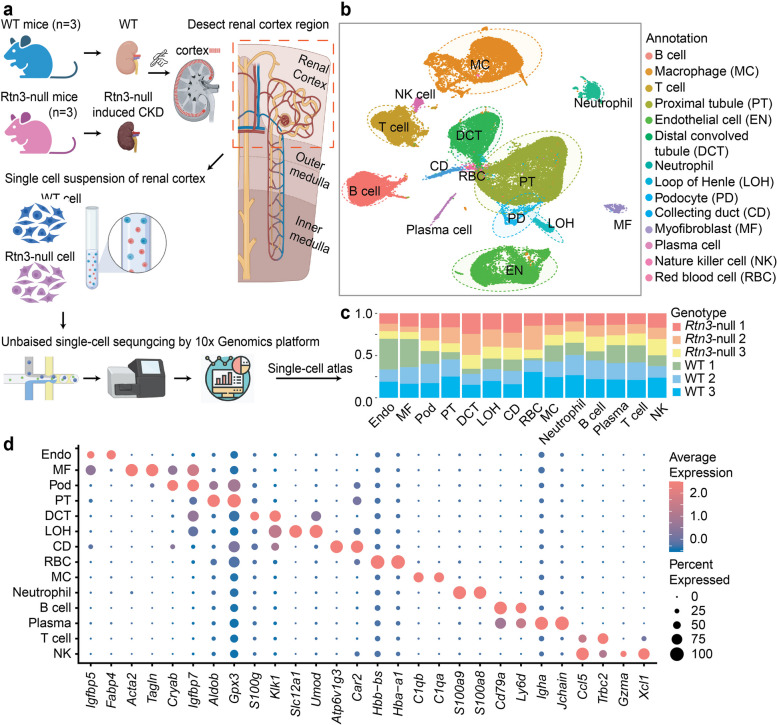
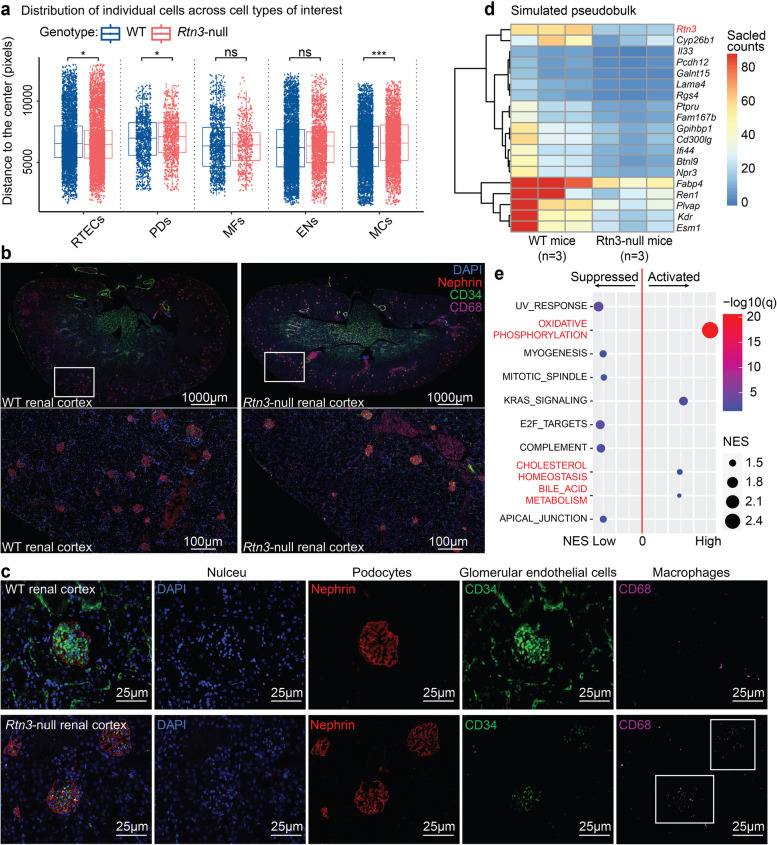
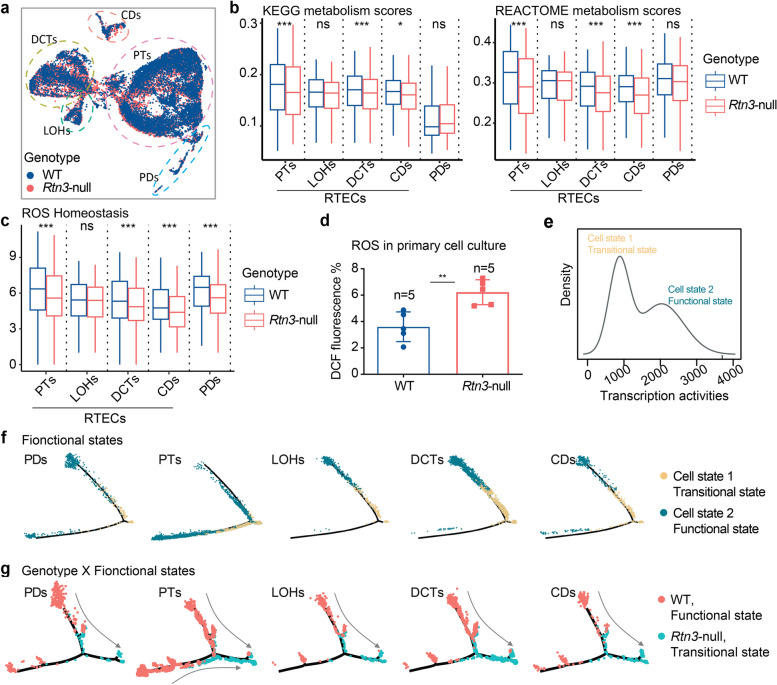
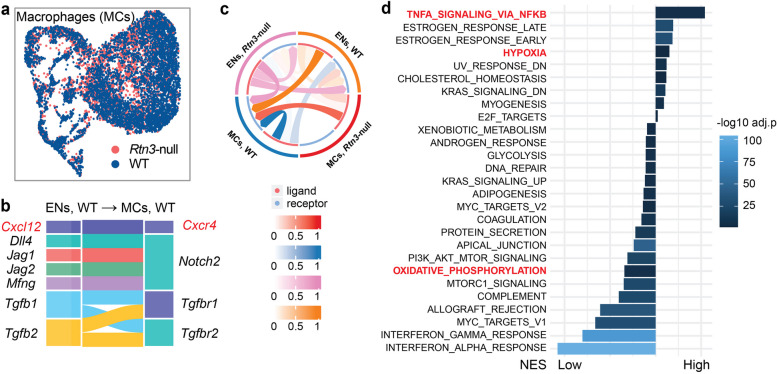
Chronic kidney disease (CKD) poses a significant global health dilemma, emerging from complex causes. Although our prior research has indicated that a deficiency in Reticulon-3 (RTN3) accelerates renal disease progression, a thorough examination of RTN3 on kidney function and pathology remains underexplored. To address this critical need, we generated Rtn3-null mice to study the consequences of RTN3 protein deficiency on CKD. Single-cell transcriptomic analyses were performed on 47,885 cells from the renal cortex of both healthy and Rtn3-null mice, enabling us to compare spatial architectures and expression profiles across 14 distinct cell types. Our analysis revealed that RTN3 deficiency leads to significant alterations in the spatial organization and gene expression profiles of renal cells, reflecting CKD pathology. Specifically, RTN3 deficiency was associated with Lars2 overexpression, which in turn caused mitochondrial dysfunction and increased reactive oxygen species levels. This shift induced a transition in renal epithelial cells from a functional state to a fibrogenic state, thus promoting renal fibrosis. Additionally, RTN3 deficiency was found to drive the endothelial-to-mesenchymal transition process and disrupt cell-cell communication, further exacerbating renal fibrosis. Immunohistochemistry and Western-Blot techniques were used to validate these observations, reinforcing the critical role of RTN3 in CKD pathogenesis. The deficiency of RTN3 protein in CKD leads to profound changes in cellular architecture and molecular profiles. Our work seeks to elevate the understanding of RTN3's role in CKD's narrative and position it as a promising therapeutic contender.

Keywords: Cell-cell communication; Chronic kidney disease (CKD); Endothelial-to-mesenchymal transition (EndoMT); Reactive oxygen species (ROS); Reticulon-3; Single-cell transcriptomics.


Conflict of interest statement

The authors declare that they have no known competing financial interests or personal relationships that could have appeared to influence the work reported in this paper.

Figures

Fig. 1
Fig. 1
Decreased expression of RTN3 in human CKD conditions. a IHC showing RTN3 protein level in human kidney samples in different medical conditions. Left panel, healthy controls (n = 2); middle panel, slight glomerulosclerosis (n = 2); and right panel, sever glomerulosclerosis (n = 2). b Box plot illustrating RTN3 expression at different stages in 42 renal transplant recipients. Blue represents baseline stage, yellow indicates AKI stage, and red denotes CKD stage. c Box plot showing RTN3 expression between normal and CKD groups across different cell types, including endothelial cells, mesenchymal cells (comprising fibroblasts and myofibroblasts), and proximal tubule epithelial cells (PTs) - blue for normal and red for CKD group. d Comparison of RTN3 expression in NKD2 KO and NKD2 OE human cell lines - blue represents the NKD2 KO cell line (rescue group) and red represents the NKD2 OE cell line (CKD model). e IHC showing Rtn3 -null mice presenting CKD phenotypes and renal fibrosis. Statistical analyses were conducted using Student’s t-test, with significance determined as *P < 0.05, ** P < 0.01, *** P < 0.001
Fig. 2
Fig. 2
The cell atlas of renal cortex in healthy and Rtn3-null mice. a Schematic diagram of the scRNAseq data generation workflow. Three healthy and three Rtn3-null renal cortex tissues were surgically isolated. The collected tissue samples were then digested into single cells suspension and sequenced using the 10x Genomics platform. This schematic was created using BioRender.com. b UMAP for 14 cell types of 47,885 captured cells in WT and Rtn3-null samples after quality controls. c Stacked box plot displaying the origin of samples corresponding to each annotated cell type. d Dot plot illustrating the expression levels of marker genes for each annotated cell type
Fig. 3
Fig. 3
The cellular and molecular architecture of renal cortex in healthy and Rtn3-null mice. a Box plots illustrating the spatial distribution of various cell types, estimated via CellTrek. Each cell’s distance was determined using Euclidean distance calculations from each spot to the central coordinates. b and c Multiplex immunohistochemical staining indicating the cellular distribution within the renal cortex of both WT and Rtn3-null mice. Blue, DAPI, nuclei; Red, Nephrin, PDs; Green, CD34, ECs; Purple, CD68, MCs. d Pseudo-bulk representation simulated by summing up all cells within each scRNAseq data set. e GSEA identifying both activated and suppressed pathways in the Rtn3-null group. Statistical analyses were conducted using Student’s t-test, with significance determined as *P < 0.05, **P < 0.01, ***P < 0.001. Instances where statistical difference is not significant are marked as ns
Fig. 4
Fig. 4
Rtn3-null induces states transition of renal epithelial cells through upregulating Lars2. a UMAP depicting renal epithelial cells (RTECs and PDs) across healthy and Rtn3-null samples. b Box plots showing the scores of KEGG and REACTOME metabolism between healthy and Rtn3-null cells. c Box plots presenting the ROS homeostasis scores contrasting healthy and Rtn3-null cells. d ROS levels in wild-type control (n=5) and Rtn3-null primary renal cells (n=5). e A fitted density plot showcasing the cell transcriptional activities, modelled using a Gaussian finite mixture model with two mixtures. f and g. Depiction of the lineage relationship in (f) functional states and (g) genotype X functional states, with arrows indicating potential cell transition directions. Statistical analyses were conducted using Student's t-test, with significance determined as *P< 0.05, **P< 0.01, ***P< 0.001. Instances where statistical difference is not significant are marked as ns
Fig. 5
Fig. 5
Molecular mechanisms under the cell states transition in renal epithelial cells. a A heatmap showcasing the differential gene expression across various cell types between functional and transitional cells. b Tracing the expression of Lars2 along the cell lineage. c WB showing the increased Lars2 protein in Rtn3-null renal cortex. d IHC staining showing the in-situ Lars2 protein between WT and Rtn3-null renal cortex. e Violin plots revealing the expression of mitochondrial genes between WT and Rtn3-null cells. f A ligand-receptor interaction heatmap between transitional Rtn3-null cells and functional WT cells. Statistical analyses were conducted using Student’s t-test, with significance determined as *P < 0.05, **P < 0.01, ***P < 0.001. Instances where statistical difference is not significant are marked as ns
Fig. 6
Fig. 6
Rtn3-null induces endothelial-to-mesenchymal transition. a UMAP representation of renal endothelial cells across both healthy and Rtn3-null samples. b A heatmap illustrating the differential gene expression between healthy and Rtn3-null endothelial cells. c A bar plot reflecting KEGG pathway scores for Rtn3-null endothelial cells. d A violin plot exhibiting ECM remodeling scores in comparison between healthy and Rtn3-null endothelial cells. e Predicted lineage relationships between healthy and Rtn3-null endothelial cells, with arrows indicating potential directions. f A display of ECM remodeling pathway scores (Top), alongside Vim (middle) and S100a4 (bottom) expression scores mapped along the predicted lineage. g and h Western blot and IHC validation of Vim protein levels in healthy versus Rtn3-null endothelial cells. Statistical analyses were conducted using Student’s t-test, with significance determined as *P < 0.05, **P < 0.01, ***P < 0.001
Fig. 7
Fig. 7
The cell-cell communication of myofibroblasts. a UMAP visualization of renal MFs across both healthy and Rtn3-null samples. b Cell-cell communication plot exhibiting interactions between PDs and MFs (left), PTs and MFs (middle), and ENs and MFs (right). c, d, and e. Illustrate baseline cell-cell communication pathways under normal conditions: (c) Functional PDs to WT MFs; (d) Functional PTs to WT MFs; (e) WT ENs to WT MFs
Fig. 8
Fig. 8
The cell-cell communication between macrophages and endothelial cells. a UMAP visualization of renal MCs across both healthy and Rtn3-null samples. b Cell-cell communication plot exhibiting interactions between ENs and MCs under different genotypes. c Illustrate baseline cell-cell communication pathways under normal conditions: WT ENs to WT MCs. d A bar plot reflecting KEGG pathway scores for Rtn3-null MCs. PDs, Podocytes; PTs, Proximal Tubule Epithelial Cells; ENs, Endothelial Cells; MCs, macrophages; WT, Wild type

References

    1. Kalantar-Zadeh K, Jafar TH, Nitsch D, Neuen BL, Perkovic V. Chronic kidney disease. Lancet. 2021;398:786–802. doi: 10.1016/S0140-6736(21)00519-5. - DOI - PubMed
    1. Balzer MS, Rohacs T, Susztak K. How many cell types are in the kidney and what do they do? Annu Rev Physiol. 2022;84:507. doi: 10.1146/ANNUREV-PHYSIOL-052521-121841. - DOI - PMC - PubMed
    1. Fan LL, Du R, Liu JS, Jin JY, Wang CY, Dong Y, et al. Loss of RTN3 phenocopies chronic kidney disease and results in activation of the IGF2-JAK2 pathway in proximal tubular epithelial cells. Experimental Mol Med 2022. 2022;54:5. doi: 10.1038/s12276-022-00763-7. - DOI - PMC - PubMed
    1. Kuppe C, Ibrahim MM, Kranz J, Zhang X, Ziegler S, Perales-Patón J, et al. Decoding myofibroblast origins in human kidney fibrosis. Nature. 2021;589:281. doi: 10.1038/S41586-020-2941-1. - DOI - PMC - PubMed
    1. Panizo S, Martínez-Arias L, Alonso-Montes C, Cannata P, Martín-Carro B, Fernández-Martín JL, et al. Fibrosis in chronic kidney disease: Pathogenesis and consequences. Int J Mol Sci. 2021;22:1–19. doi: 10.3390/IJMS22010408. - DOI - PMC - PubMed

Publication types

MeSH terms