. 2024 Jun 27;15(1):5442.
doi: 10.1038/s41467-024-49286-x.

Expression of tumor antigens within an oncolytic virus enhances the anti-tumor T cell response

Affiliations

Expression of tumor antigens within an oncolytic virus enhances the anti-tumor T cell response

Mason J Webb et al. Nat Commun. .

Abstract

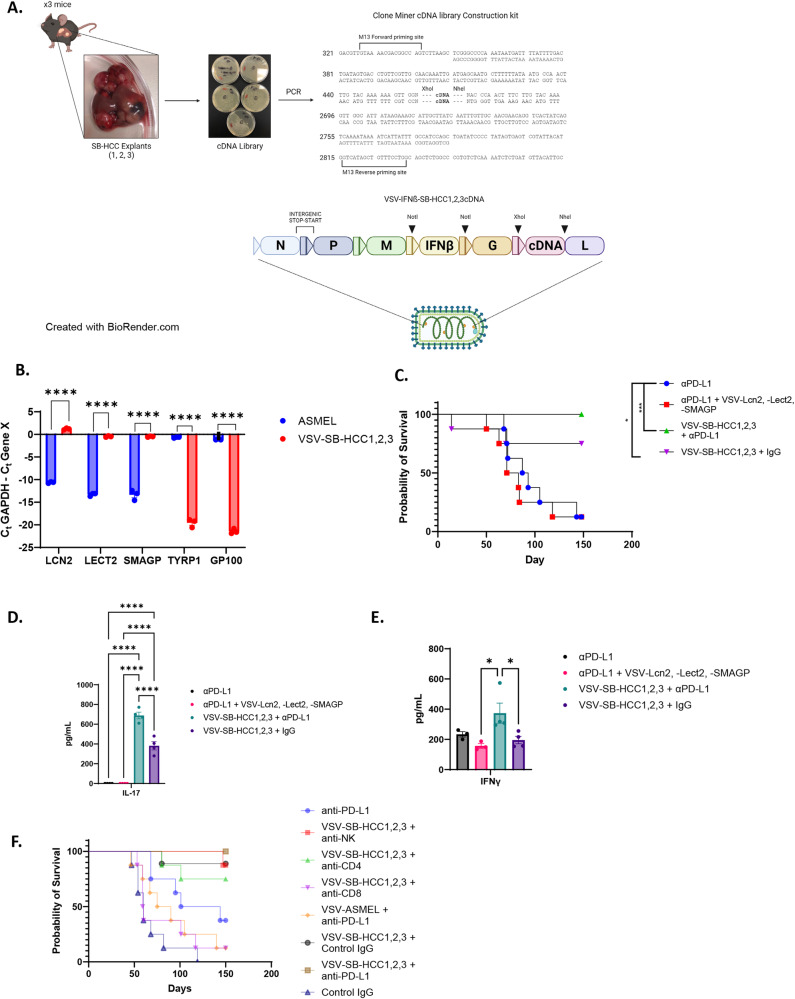
Although patients benefit from immune checkpoint inhibition (ICI) therapy in a broad variety of tumors, resistance may arise from immune suppressive tumor microenvironments (TME), which is particularly true of hepatocellular carcinoma (HCC). Since oncolytic viruses (OV) can generate a highly immune-infiltrated, inflammatory TME, OVs could potentially restore ICI responsiveness via recruitment, priming, and activation of anti-tumor T cells. Here we find that on the contrary, an oncolytic vesicular stomatitis virus, expressing interferon-ß (VSV-IFNß), antagonizes the effect of anti-PD-L1 therapy in a partially anti-PD-L1-responsive model of HCC. Cytometry by Time of Flight shows that VSV-IFNß expands dominant anti-viral effector CD8 T cells with concomitant relative disappearance of anti-tumor T cell populations, which are the target of anti-PD-L1. However, by expressing a range of HCC tumor antigens within VSV, combination OV and anti-PD-L1 therapeutic benefit could be restored. Our data provide a cautionary message for the use of highly immunogenic viruses as tumor-specific immune-therapeutics by showing that dominant anti-viral T cell responses can inhibit sub-dominant anti-tumor T cell responses. However, through encoding tumor antigens within the virus, oncolytic virotherapy can generate anti-tumor T cell populations upon which immune checkpoint blockade can effectively work.


Conflict of interest statement

The authors declare no competing interests.

Figures

Fig. 1
Fig. 1. The hMet + S45Y ß-Catenin sleeping beauty transposon system induces liver tumors which are infiltrated by PD-1+ CD8 T cells.
Following hydrodynamic injection of hMet + S45Y ß-Catenin plasmids, animals were euthanized at 4 and 7 weeks for pathologic studies. A Livers (animals A1 and A4) demonstrated appreciable neoplasia with a well-differentiated morphology and minimal immune infiltration by week 4. This progressed by week 7 (animals C1 and C4) with neoplastic cells overtaking the majority of the tumor, with large pseudo-cysts, fat deposits, and signs of extramedullary hematopoiesis (more prominent in C4). B Livers from a control mouse and from a mouse 7 weeks after hMet + S45Y ß-Catenin hydrodynamic tail-vein injection. C, D Following hydrodynamic injection of hMet + S45Y ß-Catenin, animals were euthanized at day 22 and day 29 and analyzed for CD8+ (p = 0.0162) (C) and CD4+ (p > 0.1) (D) T cells by flow cytometry. D Similar to (C), tumor-infiltrating CD4 T cells were evaluated. E, F Proportions of CD8+ (Tim3- PD1- Naïve vs. Day 22 and 29, p < 0.0001; Tim3 + PD1+ Naïve vs. Day 22 and 29, p < 0.0001) (E) and CD4+ (p > 0.1 except for Tim3- PD1- Naïve vs. Day 22, p = 0.0260) (F) T cells expressing Tim3 and/or PD1+ in livers of tumor bearing or tumor naïve mice at days 22 and day 29. G Proportions of PD-L1+ CD86+ dendritic cells (DCs) in mice 22 and 29 days after hMet + S45Y ß-Catenin injection compared to tumor naïve mice. (PD-L1 + CD86+ Naïve vs. Day 22, p = 0.0054; PD-L1 + CD86- Naïve vs. Day 29, p = 0.0028; PD-L1 + CD86- Day 22 vs. Day 29, p = 0.0002). H Hematoxylin and eosin staining combined with PD-L1 immunohistochemistry of the livers of FVB mice at weeks 4, 5, 6, and 7 after hMet + S45Y ß-Catenin hydrodynamic tail-vein injection. 10x magnification. Significance for (C, D) determined by ordinary one-way ANOVA, data are presented as mean values +/− SEM. Significance for (EG) was determined by 2-way ANOVA with multiple comparisons using Tukey’s multiple comparisons test, data are presented as mean values +/− SEM.
Fig. 2
Fig. 2. Responsiveness of SB-HCC to CD8-mediated immune checkpoint blockade is abolished by VSV virotherapy.
Animals in all arms underwent hydrodynamic injection of hMet + S45Y ß-Catenin at day 0. N = 67 animals (AC). AC Control IgG or anti-PD-L1 ICI therapy was initiated at day 21 for 6 doses (days 21, 23, 25, 28, 30, 31) in non-depleted mice or in mice depleted of CD8 (A), CD4 (B) or NK cells (C) as shown (8 total doses). Survival with time is shown. D Mice hydrodynamically injected with hMet + S45Y ß-Catenin at day 0 were treated with PBS or VSV-mIFNß on days 21, 23, and 25 (3 doses, 108 pfu/dose), followed by control IgG isotype or anti-PD-L1 on days 28, 30, 32, 35, 37, 39 (6 doses, 200 µg per dose). Survival with time is shown. E Mice hydrodynamically injected with hMet + S45Y ß-Catenin at day 0 were treated with control IgG isotype or anti-PD-L1 on days 21, 23, 25, 28, 30, 33 (6 doses, 200 µg per dose) and with PBS or VSV-mIFNß on days 40, 42 and 44 (3 doses, 108 pfu/dose). Survival with time is shown. Significance was determined through survival curve comparison testing using a log-rank Mantel-Cox test.
Fig. 3
Fig. 3. IT treatment with VSV-mIFNß generates a dominant anti-viral CD8 T cell response which replaces the anti-tumor T cell response.
A Treatment regimen. Following hydrodynamic injection of hMet + S45Y ß-Catenin on day 0, animals were treated with anti-PD-L1 on day 21 for 6 doses concurrently with VSV-mIFNß for 3 doses. All animals were euthanized on day 38. Livers were processed into single-cell suspensions and analyzed by the Mayo CyTOF core facility. N = 16, 4 animals per group, groups were pooled for Rphenograph tSNE analysis, 22 groups. Scatterplot and mean heat map shown. B Following initial analysis (A), 9 distinct immune populations were identified and pooled data was re-analyzed using FlowSOM tSNE analysis. ‘Exhausted CD8 T cells’ were identified by expression of CD8, Tim-3, LAG-3, CD39, and PD-1 expression, ‘B cells’ by CD38 and CD19; ‘CD4 T cells’ by CD4; ‘Memory CD4 T Cells’ by CD4, CCR7, and CD62L; ‘Memory CD8 T Cells’ by CD8, CCR7, and CD62L; ‘NK Cells’ by NK1.1; ‘NKT Cells’ by NK1.1 and CD8; and ‘Anti-viral CD8 T Cells’ by CD8, GranzB, and PD-L1. C Pooled analysis of lymphocytes within livers of tumor-free mice, first 10,000 events. D Pooled analysis of lymphocytes within livers of SB-HCC-bearing mice, first 10,000 events. E Pooled analysis of lymphocytes within livers of SB-HCC bearing mice treated with anti-PD-L1, first 10,000 events. F Pooled analysis of lymphocytes within livers of SB-HCC-bearing mice treated with anti-PD-L1 and VSV-mIFNß, first 10,000 events.
Fig. 4
Fig. 4. Expression of a HCCTAA within VSV overcomes the loss of anti-TAA CD8 + T cells by VSV virotherapy.
A, B Following hydrodynamic injection of HCC-OVA (day 0), mice were treated with anti-PD-L1 (day 6 for 6 doses). On day 23 livers (A) and spleens (B) were processed to single-cell suspensions and analyzed by flow cytometry for SIINFEKL tetramer positive CD8 + T cells. (n = 12, 4 per group, representative flow data shown). CE Following hydrodynamic injection of HCC-OVA (day 0), mice were treated with anti-PD-L1 (day 6 for 6 doses) followed by VSV-GFP or VSV-IFNß (3 doses, days 18,20,22). On day 23 livers (Naïve vs. HCC-OVA + isotype p = 0.0004, HCC-OVA + isotype vs. HCC-OVA + αPDL1 p = 0.0037; HCC-OVA + αPDL1 vs. HCC-OVA + VSV-GFP, HCC-OVA + αPDL1 + VSV-GFP, HCC-OVA + VSV-mIFNβ, and HCC-OVA + αPDL1 + VSV- mIFNβ p < 0.0001) (D) and spleens (Naïve vs. HCC-OVA + αPDL1 p = 0.0111; HCC-OVA + αPDL1 vs. HCC-OVA + VSV-GFP p = 0.0345, HCC-OVA + VSV-mIFNβ p = 0.0091, and HCC-OVA + αPDL1 + VSV- mIFNβ p = 0.0226) (E) were analyzed by flow cytometry for SIINFEKL tetramer positive CD8 + T cells. (n = 28, 4 animals per group, data are presented as mean values +/− SEM). FH Following hydrodynamic injection of HCC-OVA (day 0), mice were treated with anti-PD-L1 (day 23, 6 doses) followed by VSV expressing ovalbumin (VSV-OVA) for 3 doses (day 90, 92, 94). On day 98 livers and spleens were analyzed by flow cytometry for SIINFEKL tetramer positive CD8 + T cells. (n = 12, 4 per group, data are presented as mean values +/− SEM. Representative flow data is shown as well as the pooled ratio of SIINFEKL-tetramer+ to VSV-N+ CD8 T cells). Tumor-Free + Isotype + VSV-OVA vs. HCC + αPDL1 + VSV-OVA p = 0.0032. HCC + Isotype + VSV-OVA vs. HCC + αPDL1 + VSV-OVA p = 0.0074. G Tumor-Free + Isotype + VSV-OVA vs. HCC + αPDL1 + VSV-OVA p = 0.0059. HCC + Isotype + VSV-OVA vs. HCC + αPDL1 + VSV-OVA p = 0.0162. H Significance was determined through ordinary one-way ANOVA with Tukey’s multiple comparison tests, flow gating strategies shown in Supplementary Fig. 4.
Fig. 5
Fig. 5. Putative HCCTAA selected for high-level expression and MHC binding affinity.
A SB-HCC tumor-bearing mice were euthanized on day 18 with livers harvested for RNA extraction. RNA samples were then subjected to RNA-seq analysis, identifying 10 highest relative gene expression compared to non-tumor bearing livers. B, C The 10 most-expressed genes identified and full-length sequences were filtered through NET MHC 2.0 binding affinity algorithm to identify octamer or nonamer peptides whose binding affinity for H2Kb (B) or H2Kd (C) was below a threshold of 500 nM, and whose corresponding wild-type peptides had a binding affinity to the same molecules above 500 nM. These corresponded to Lcn2, Lect2, and SMAGP. D, E C57Bl/6 mice (n = 12, 3 per group, data are presented as mean values +/− SEM) were injected intravenously with 107 plaque-forming units (pfu) of VSV-mIFNß, VSV-Lcn2, VSV-Lect2, or VSV-SMAGP. 10 days later 106 splenocytes were co-cultured with a 1:1:1 mixture of SB-HCC explants 1, 2 and 3 at an effector:target (E:T) ratio of 10:1. Supernatants were assayed 48 h later for IL-17 (D) or IFNγ (VSV-mIFNβ vs VSV-Lcn2 p = 0.0040) (E). Significance was determined through ordinary one-way ANOVA with Tukey’s multiple comparison tests. Statistical significance was set with * indicating a p value less than 0.05, ** <0.01, *** <0.001, and **** <0.0001.
Fig. 6
Fig. 6. VSV expressing the putative HCCTAA Lcn2 improves upon therapy with VSV-IFNß in combination with ICI.
A Following hydrodynamic injection of hMet + S45Y ß-Catenin (day 0), mice was treated with anti-PD-L1 (200 µg/injection; days 5, 7, 9, 12, 14, 16) followed by 107pfu of VSV-IFNß, VSV-IFNß-Lcn2 or with 3 × 106 pfu each of (VSV-IFNß-Lect2 + VSV-IFNß-Lcn2 + VSV-IFNß-Smagp) (day 21, 22, 23). N = 32. B, C In a repeat of the protocol of (A), spleens were harvested 10 days following the last dose of virus and 106 splenocytes were co-cultured with SB-HCC 1,2,3 tumor targets at an effector:target ratio of 10:1 with supernatant assayed 48 h later for (B) IL-17 and (C) IFNγ. N = 15, data are presented as mean values +/− SEM, VSV-mIFNβ + αPDL1 vs. αPDL1 p = 0.0018, αPDL1 vs. VSV-Lcn2, -Lect2, -SMAGP + αPDL1 p = 0.0006. Significance for (A) was determined through survival curve comparison testing using a log-rank Mantel-Cox test and (B, C) was determined through ordinary one-way ANOVA with Tukey’s multiple comparison tests.
Fig. 7
Fig. 7. VSV-SB-HCC1,2,3 cures mice with SB-HCC mediated by CD8 T cells and associated with Th1 and Th17 responses.
A cDNA from three murine Sleeping Beauty HCC tumor-bearing livers, (SB HCC 1,2&3 Library), was pooled, cloned and amplified by PCR. The Library was then cloned into the VSV backbone plasmid between the Xho1 and Nhe1 sites. Figure created with BioRender.com under CC BY-NC-ND. B Composition of the VSV-derived ASMEL and SB HCC 1,2&3 Libraries was validated using PCR from the equivalent of 108 pfu of the VSV-ASMEL or VSV-SB HCC 1,2&3 with gene specific primers to the HCC-specific Lcn2, Lect2, and Smagp genes or to the melanoma specific TYRP1 and GP100 genes. All p values noted are <0.0001. C Following hydrodynamic injection of hMet + S45Y ß-Catenin (day 0), animals were treated on days 21, 23, 25, 28, 30, 32 with anti-PD-L1 (100 µg/injection) with, or without, 107 pfu of VSV-SB-HCC1,2,3 or 3 × 106 pfu each of (VSV-IFNß-Lect2 + VSV-IFNß-Lcn2 + VSV-IFNß-Smagp) on days 38,40,42. (N = 32, 8 mice per group). D, E 106 splenocytes were co-cultured with a 1:1;1 mixture of live SB-HCC 1,2,3 explant cells as targets at an effector:target ratio of 10:1 with supernatant assayed 48 h later for (D) IL-17 and (E) IFNγ. (N = 12, 3 mice per group, for (D) all p values noted are <0.0001, for (E) αPDL1 + VSV-Lcn2, -Lect2, -SMAGP vs. VSV-SB-HCC1,2,3 + αPDL1 p = 0.0230, VSV-SB-HCC1,2,3 + αPDL1 vs. VSV-SB-HCC1,2,3 + IgG p = 0.0437) (F). Following hydrodynamic injection of hMet + S45Y ß-Catenin (day 0), animals were treated on days 21, 23, 25, 28, 30, 32 with control isotype IgG or with anti-PD-L1 (200 µg/injection) with, or without, PBS or 107pfu ASMEL (VSV-melanoma cDNA library) or 107 pfu VSV-SB-HCC1,2,3 on days 38,40,42. Depleting antibodies were given concurrently with either anti-PD-L1 or IgG isotype control for 6 doses. (N = 65, 8 mice per group except VSV-SB-HCC1,2,3 + Control IgG, n = 9). Significance comparisons for (Fig. S8) are included in the Supplement, (B) was determined using 2-way ANOVA with multiple comparisons using Tukey’s multiple comparisons test, (C, F) were determined through survival curve comparison testing using a log-rank Mantel-Cox test, and (D, E) were determined through ordinary one-way ANOVA with Tukey’s multiple comparison tests.

Update of

References

    1. Llovet JM, et al. Hepatocellular carcinoma. Nat. Rev. Dis. Prim. 2021;7:6. doi: 10.1038/s41572-020-00240-3. - DOI - PubMed
    1. Global Burden of Disease Liver Cancer Collaboration, et al. The burden of primary liver cancer and underlying etiologies from 1990 to 2015 at the global, regional, and national level: results from the global burden of disease study 2015. JAMA Oncol. 2017;3:1683–1691. doi: 10.1001/jamaoncol.2017.3055. - DOI - PMC - PubMed
    1. Rahib L, et al. Projecting cancer incidence and deaths to 2030: the unexpected burden of thyroid, liver, and pancreas cancers in the United States. Cancer Res. 2014;74:2913–2921. doi: 10.1158/0008-5472.CAN-14-0155. - DOI - PubMed
    1. Finn RS, et al. Atezolizumab plus bevacizumab in unresectable hepatocellular carcinoma. N. Engl. J. Med. 2020;382:1894–1905. doi: 10.1056/NEJMoa1915745. - DOI - PubMed
    1. Li Q, Han J, Yang Y, Chen Y. PD-1/PD-L1 checkpoint inhibitors in advanced hepatocellular carcinoma immunotherapy. Front. Immunol. 2022;13:1070961. doi: 10.3389/fimmu.2022.1070961. - DOI - PMC - PubMed

MeSH terms