. 2024 Jun 27;15(6):456.
doi: 10.1038/s41419-024-06841-0.

MicroRNA miR-20a-5p targets CYCS to inhibit apoptosis in hepatocellular carcinoma

Affiliations

MicroRNA miR-20a-5p targets CYCS to inhibit apoptosis in hepatocellular carcinoma

Olaniyi Olarewaju et al. Cell Death Dis. .

Abstract

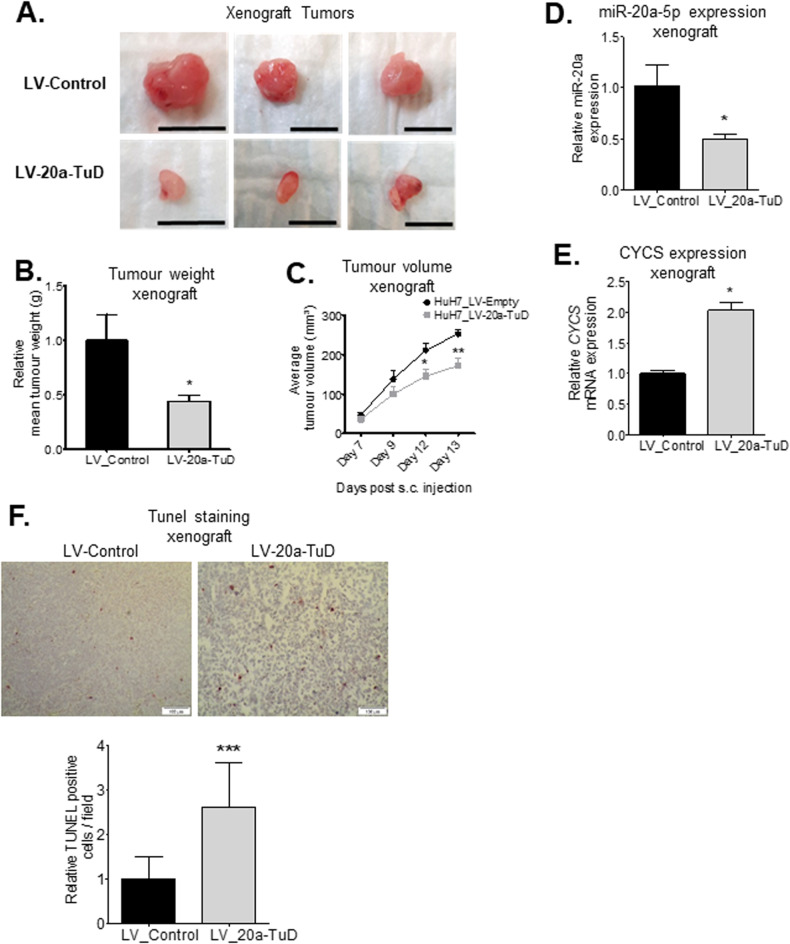
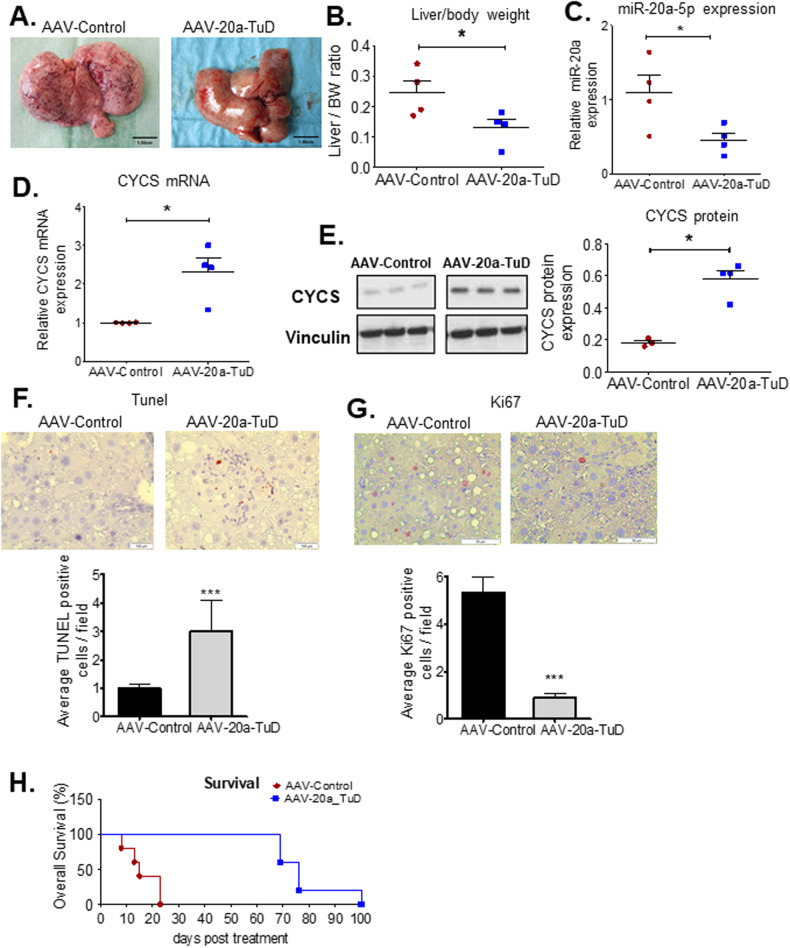
Hepatocellular carcinoma is a primary liver cancer, characterised by diverse etiology, late diagnoses, and poor prognosis. Hepatocellular carcinoma is mostly resistant to current treatment options, therefore, identification of more effective druggable therapeutic targets is needed. We found microRNA miR-20a-5p is upregulated during mouse liver tumor progression and in human hepatocellular carcinoma patients. In this study, we elucidated the therapeutic potential of targeting oncogenic miR-20a-5p, in vivo, in a xenograft model and in two transgenic hepatocellular carcinoma mouse models via adeno-associated virus-mediated miR-20a-Tough-Decoy treatment. In vivo knockdown of miR-20a-5p attenuates tumor burden and prolongs survival in the two independent hepatocellular carcinoma mouse models. We identified and validated cytochrome c as a novel target of miR-20a-5p. Cytochrome c plays a key role in initiation of the apoptotic cascade and in the electron transport chain. We show for the first time, that miR-20a modulation affects both these key functions of cytochrome c during HCC development. Our study thus demonstrates the promising 'two birds with one stone' approach of therapeutic in vivo targeting of an oncogenic miRNA, whereby more than one key deregulated cellular process is affected, and unequivocally leads to more effective attenuation of HCC progression and significantly longer overall survival.


Conflict of interest statement

The authors declare no competing interests.

Figures

Fig. 1
Fig. 1. MicroRNA miR-20a-5p is a potential oncogenic miRNA, overexpressed during tumor progression.
A RT-qPCR validation of miR-20a expression in liver tissue samples from stages of tumor development and regression. **, P < 0.001 and ***, P < 0.0001. B–D Comparison of miR-20a expression between tumor and adjacent liver tissue in a human HCC sample set (n = 19 patients). All 38 samples were run in triplicate (3 technical replicates) per miRNA/U6 internal control. **, P = 0.009. E WST-1 assay to determine differences in proliferation between miR-scramble and miR-20a-Inhibitor treated Huh7 cells (n = 6 independent biological replicates/group). *, P < 0.01; **, P < 0.001 and ***, P < 0.0001. F Wound-healing assay, shows a larger wound width correlating with impaired cell migration in the miR-20a-Inhibitor treated Huh7 cells compared to scramble treated cells at both 24 h and 48 h time points (n = 8 independent biological replicates per group and time point). **, P < 0.005 and ***, P < 0.0005. G Colony forming (Soft agar) assay to determine transforming ability of Huh7 cells treated with miR-Scramble and miR-20a-Inhibitor (data is from n = 3 independent biological replicates per treatment group from two independent experiments, i.e. n = 6 biological replicates/group).**, P = 0.002. H MiR-20a-inhibitor-treated LT2M cells form fewer liver tumor organoids than those treated with the scramble control. Graph shows average number of organoids/field/treatment group (Scramble = 21 fields, miR-20a-Inhibitor = 20 fields). (n = 3 biological replicates per treatment group). * P = 0.038. Unless otherwise specified, n= total number of independent biological replicates per group. Data in (A, B, E-H) are presented as mean ± SEM. P values were determined by two-tailed Student’s t test.
Fig. 2
Fig. 2. MiR-20a knockdown has anti-oncogenic effects on HCC cells.
A QPCR quantification of miR-20a expression shows miR-20a downregulation following transduction of Huh7 with lentivirus LV-20a-TuD (n = 3 independent biological replicates/group). ***, P < 0.0001. B WST-1 assay shows decreased cell proliferation in LV-20a-TuD cells compared with control over 24 h, 48 h, and 72 h time points (n = 5 independent biological replicates/group). *, P = 0.05. **, P < 0.005. C Cell migration determined by wound healing assay shows a larger wound area, correlating with impaired cell migration in LV-20a-TuD cells at 24 h; 48 h and 72 h time points (n = 5 independent biological replicates per group and time point). *, P < 0.01 and **, P < 0.005. D Soft agar colony forming assay comparing the transforming ability of LV-20a-TuD cells with LV-Control Huh7 cells (n = 8). ***, P < 0.0001. E Glucose uptake was measured, and compared between LV-20a-TuD cells and control (n = 6). *, P = 0.01. F Lactate quantification shows increased extracellular accumulation (upper, ***, P < 0.0001), and decreased intracellular levels (lower, **, P = 0.0018) of lactate in LV-20a-TuD cells (n = 12). G OCR/ECAR ratio following OCR and ECAR assays shows a slightly lower ratio in the LV-20a-TuD cells compared with control cells plotted over time (in minutes) (n = 8). H Representative plots and graph from flow cytometry analyses showing ANNEXIN V positive cells (upper, ***, P < 0.0002) and 7-AAD positive cells (lower, ***, P < 0.0002) in LV-Control and LV-20a-TuD cells (n = 3). I Caspase 3/7 activity assay showing elevated activity in LV-20a-TuD cells (n = 5). *, P < 0.01. Unless otherwise specified, n= total number of independent biological replicates per group. Data in (A–F, H, I) are presented as mean ± SEM. P values were determined by two-tailed Student’s t test.
Fig. 3
Fig. 3. Identification of cytochrome c as a novel and direct target of miR-20a.
A CYCS mRNA expression quantified by qPCR shows higher expression of CYCS in LV-20a-TuD cells (n = 3). ***, P < 0.0001. B Representative microscope images of cytochrome c immunofluorescence staining (left) and Western blot (right) show increased CYCS protein expression in LV-20a-TuD cells compared to LV-Control (n = 3). *, P < 0.02. C Schematic showing alignment of miR-20a with its wild-type binding site in the Homo sapiens CYCS 3’UTR sequence as well as the mutated binding site. D Validation of CYCS as a bona fide target of miR-20a by luciferase assay following cloning the human CYCS 3´UTR containing either the wild-type or mutated binding site, in the pmirglo vector (n = 5 per group). **, P < 0.005; *, P < 0.05. E Schematic showing alignment of miR-20a with its wild-type binding site in the mouse Cycs 3´UTR as well as the deleted binding site. F Validation of murine Cycs as a bona fide target of miR-20a with the luciferase assay following cloning of the mouse Cycs 3´UTR containing either the wild-type or deleted binding site (n = 5 per group). ***, P < 0.0001; **, P < 0.005. Unless otherwise specified, n= total number of independent biological replicates per group. Data are presented as mean ± SEM. P values were determined by two-tailed Student’s t test.
Fig. 4
Fig. 4. Restoration of miR-20a expression results in cytochrome c downregulation.
QPCR data showing. A Overexpression of miR-20a in the LV-20a-TuD cells following the transfection of miR-20a mimic (n = 3). ***, P < 0.0002. B Complete downregulation of CYCS expression following miR-20a overexpression (n = 3). ***, P < 0.0002. C Representative microscope images of cytochrome c immunofluorescence staining (left) and Western blot (right) also show strong downregulation of CYCS protein when miR-20a is overexpressed (n = 3). *, P = 0.02. QPCR quantification of mRNA expression of (D) anti-apoptotic BCL-xL and BCL-2 (n = 3 independent biological replicates /group/gene) and (E) apoptosis effectors BAX and BAK (n = 3 independent biological replicates /group/gene). **, P = 0.002. F qPCR mRNA quantification of effector Caspases 3 and 7 shows deregulation of expression following miR-20a modulation (n = 3). **, P < 0.004; ***, P < 0.0004. G, H ATP production measured by luminescence assays in (G). Scramble-transfected LV-Control cells and LV-20a-TuD cells ± Scr or miR-20a mimic treatment (n = 10) ***, P < 0.0001, and in (H). LV-Control and LV-20a-TuD cells and LV-20a-TuD cells ±non-targeting (Scr) siRNA (n = 7) or Cyt c siRNA treatment (n = 9). ***, P < 0.0001. I–J Heat maps of (I) apoptosis and (J). OXPHOS genes following hierarchical clustering of gene expression data from Huh7 cells treated with either Scramble control or miR-20a-5p inhibitor. Clear differential regulation of apoptotic and OXPHOS related genes is seen between the two groups. n= number of independent biological samples/replicates per treatment group and number of separate samples sent for expression profiling. Data in (A, B, D–H) are presented as mean ± SEM. P values were determined by two-tailed Student’s t test.
Fig. 5
Fig. 5. Knockdown of miR-20a attenuates tumor growth in a xenograft tumor model.
A Representative images of xenograft tumors generated from LV-Control and LV-20a-TuD cells show a clear decrease in LV-20a-TuD tumor growth. B Graph shows significantly lower mean tumor weights of xenograft tumors from Huh7 LV-20a-TuD cells relative to those developed from Huh7 LV-Control and LV-20a-TuD cells in immunodeficient BALB/c nude mice (n = 5/group). *, P < 0.04. C Average tumor volume of all xenograft tumors per group are plotted at each time point of measurement, from the point of visible measurable tumor growth. *, P < 0.01 and **, P < 0.001. D qPCR quantification of miR-20a expression shows xenograft tumors developed from Huh7 LV-20a-TuD tumor tissues continue to show significantly lower miR-20a levels (n = 5/group). *, P < 0.002. E qPCR quantification shows significantly higher CYCS mRNA expression in LV-20a-TuD tumor tissues (n = 5/group). *, P < 0.001. F Representative images (20X magnification) of TUNEL staining on tissue sections from Huh7-LV-Control and Huh7-LV-20a-TuD xenograft tumors. Graph showing average TUNEL positive cells per field in Huh7-LV-20a-TuD xenograft tumors relative to the Huh7-LV-Control group. ***, P < 0.0002. n = number of mice per treatment group. Data are presented as mean ± SEM. P values were determined by two-tailed Student’s t test.
Fig. 6
Fig. 6. In vivo knockdown of miR-20a results in attenuation of tumor burden and prolongs survival in the LT2/MYC HCC mouse model.
AAV-20a-TuD-treated MYC/LT2 mice show a clear attenuation of tumor development following AAV-20a-TuD treatment compared to AAV-Control mice as seen by (A). Different representative images of tumor-bearing livers from both groups. B Decreased relative total tumor area (n = 4), as calculated in Image J. *, P < 0.05. C Liver to body weight ratio (n = 4). *, P < 0.05, and (D). A decrease in AST/ALT ratio (n = 4). *, P < 0.05. E qPCR quantification of miR-20a expression in AAV-Control and AAV-20a-TuD treated MYC/LT2 mouse liver tumors (n = 4) confirms miR-20a knockdown in vivo. *, P < 0.05. FG Representative images (×20 magnification) of liver tumor tissue sections from AAV-Control and AAV-20a-TuD treated MYC/LT2 mice following immunohistochemical staining for F. TUNEL (n = 30 fields/group) and (G) Ki67 (n = 40 fields/group), with corresponding graphs. Both, ***, P < 0.0001. H Kaplan-Meier survival analysis shows a significant increase in median survival of AAV-20a-TuD treated mice compared to AAV-Control mice (n = 6). Log-rank (Mantel-Cox) test was used to compare both treatment groups. *, P = 0.02. n= unless specified, number of mice per treatment group. Data in (BG) are presented as mean ± SEM. P values were determined by two-tailed Student’s t test.
Fig. 7
Fig. 7. Depletion of miR-20a significantly attenuates tumor burden and prolongs survival also in the LT2/RAS HCC mouse model.
A Representative gross images of LT2/RAS mice liver tumors from AAV-Control and AAV-20a-TuD treated mice showing an attenuation of tumor development following AAV-20a-TuD treatment. This is also reflected in (B) decreased liver/body weight ratio (n = 4). *, P < 0.05. qPCR analyses of liver tumor tissues from AAV-Control and AAV-20a-TuD treated LT2/RAS mice (n = 4) to determine expression of (C). miR-20a *, P < 0.05 and (D). Cycs levels (n = 4). *, P < 0.05. E Western blot shows significant increase in CYCS protein expression in AAV-20a-TuD mice (n = 4) compared to AAV-Control mice (n = 3). *, P < 0.01. F Representative images (20X magnification) of TUNEL stained liver tumor tissue sections and the graph showing average TUNEL positive cells per field in AAV-20a-TuD mice relative to the AAV-Control group (n = 4 mice/group, 12 fields counted per mouse per group). ***, P = 0.0002. G Representative images (×20 magnification) of Ki67 stained liver tumor tissue sections from the AAV-Control and AAV-20a-TuD treated mice with the graph showing average Ki67 positive cells per field (n = 4 mice/group, 10 fields counted per mouse / group). ***, P < 0.0001. n= number of mice per treatment group. H AAV-20a-TuD treated LT2/RAS mice show a significant increase in median survival compared to AAV-Control mice, as determined by Kaplan-Meier survival analysis (n = 5 mice per group) using the Log-rank (Mantel-Cox) test to compare both treatment groups. **, P = 0.0027. Data in (BG) are presented as mean ± SEM, two-tailed Student’s t test.
Fig. 8
Fig. 8. Schematic summarizing the primary findings of our study, shows in vivo inhibition of miR-20a-5p has a promising therapeutic inhibitory effect on HCC development.
MiR-20a-5p inhibition increased expression of its direct target, CYCS, thereby leading to an increase in apoptosis and initiating a metabolic shift within tumor cells.

References

    1. Sung H, Ferlay J, Siegel RL, Laversanne M, Soerjomataram I, Jemal A, et al. Global cancer statistics 2020: GLOBOCAN estimates of incidence and mortality worldwide for 36 cancers in 185 countries. CA Cancer J Clin. 2021;71:209–49. doi: 10.3322/caac.21660. - DOI - PubMed
    1. Yang JD, Hainaut P, Gores GJ, Amadou A, Plymoth A, Roberts LR. A global view of hepatocellular carcinoma: trends, risk, prevention and management. Nat Rev Gastroenterol Hepatol. 2019;16:589–604. doi: 10.1038/s41575-019-0186-y. - DOI - PMC - PubMed
    1. Komoll RM, Hu Q, Olarewaju O, von Dohlen L, Yuan Q, Xie Y, et al. MicroRNA-342-3p is a potent tumour suppressor in hepatocellular carcinoma. J Hepatol. 2021;74:122–34. doi: 10.1016/j.jhep.2020.07.039. - DOI - PubMed
    1. Lim L, Balakrishnan A, Huskey N, Jones KD, Jodari M, Ng R, et al. MicroRNA-494 within an oncogenic microRNA megacluster regulates G1/S transition in liver tumorigenesis through suppression of mutated in colorectal cancer. Hepatology. 2014;59:202–15. doi: 10.1002/hep.26662. - DOI - PMC - PubMed
    1. Hu S, Balakrishnan A, Bok RA, Anderton B, Larson PE, Nelson SJ, et al. 13C-pyruvate imaging reveals alterations in glycolysis that precede c-Myc-induced tumor formation and regression. Cell Metab. 2011;14:131–42. doi: 10.1016/j.cmet.2011.04.012. - DOI - PMC - PubMed

Publication types

Associated data