. 2024 Jun 27;15(1):5345.
doi: 10.1038/s41467-024-49360-4.

Farnesyltransferase inhibition overcomes oncogene-addicted non-small cell lung cancer adaptive resistance to targeted therapies

Affiliations

Farnesyltransferase inhibition overcomes oncogene-addicted non-small cell lung cancer adaptive resistance to targeted therapies

Sarah Figarol et al. Nat Commun. .

Abstract

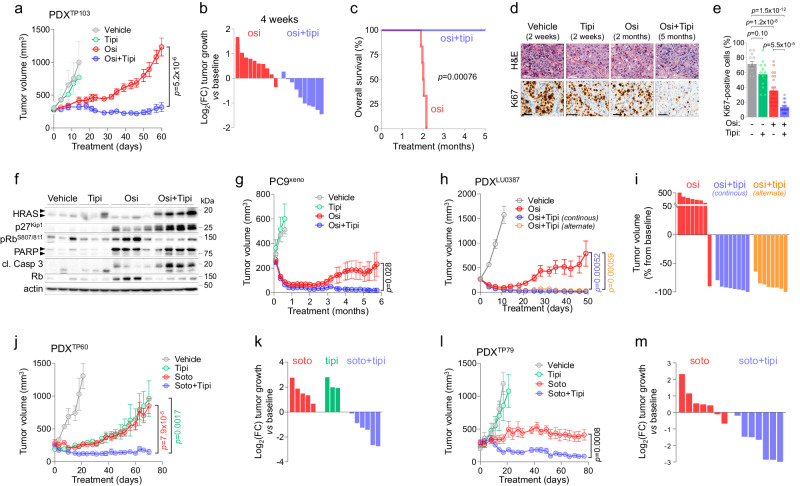
Drug-tolerance has emerged as one of the major non-genetic adaptive processes driving resistance to targeted therapy (TT) in non-small cell lung cancer (NSCLC). However, the kinetics and sequence of molecular events governing this adaptive response remain poorly understood. Here, we combine real-time monitoring of the cell-cycle dynamics and single-cell RNA sequencing in a broad panel of oncogenic addiction such as EGFR-, ALK-, BRAF- and KRAS-mutant NSCLC, treated with their corresponding TT. We identify a common path of drug adaptation, which invariably involves alveolar type 1 (AT1) differentiation and Rho-associated protein kinase (ROCK)-mediated cytoskeletal remodeling. We also isolate and characterize a rare population of early escapers, which represent the earliest resistance-initiating cells that emerge in the first hours of treatment from the AT1-like population. A phenotypic drug screen identify farnesyltransferase inhibitors (FTI) such as tipifarnib as the most effective drugs in preventing relapse to TT in vitro and in vivo in several models of oncogenic addiction, which is confirmed by genetic depletion of the farnesyltransferase. These findings pave the way for the development of treatments combining TT and FTI to effectively prevent tumor relapse in oncogene-addicted NSCLC patients.


Conflict of interest statement

O.C. reports research funding from Kura Oncology through a sponsored research contract. L.K. reports personal fees from Kura Oncology during the conduct of the study and personal fees from Kura Oncology outside the submitted work. FB is an employee and stockholder of Kura Oncology. JM reports personal fees/advisory board membership from Roche and Bristol Myers Squibb, and AstraZeneca, advisory board membership and research funding (institution), personal fees/advisory board membership from Pfizer, Novartis, Amgen, Takeda, Daiichi Sankyo, the healthcare business of Merck KGaA, Darmstadt, Germany, grants/funding (institution) from Roche/Genentech, Bristol Myers Squibb, Pierre Fabre and AstraZeneca outside the submitted work. L.P.A has leadership interest (board member) in ALTUM Sequencing and Genomica; has received honoraria for participation at meetings from Amgen Sanofi, AstraZeneca Spain, Bayer, Blueprint Medicines, Bristol Myers Squibb/Celgene, Daiichi Sankyo, Ipsen, Lilly, Merck Serono, Mirati Therapeutics, Novartis, Pfizer, PharmaMar, Roche/Genentech, Servier, and Takeda; speakers’ bureau from AstraZeneca, Bristol Myers Squibb, Merck Serono, MSD Oncology, Pfizer, and Roche/Genentech; research funding (via his institution) from AstraZeneca, Bristol Myers Squibb, Kura Oncology, MSD, Pfizer and PharmaMar; and travel and accommodation expenses from AstraZeneca, Bristol Myers Squibb/Celgene, MSD, Pfizer Roche/Genentech, and Takeda. L.P-A. also declares other relationships with Amgen, Ipsen, Merck, Novartis, Pfizer, Roche, Sanofi, and Servier (as sponsors of clinical trials), outside the submitted work. The remaining authors declare no conflict of interest.

Figures

Fig. 1
Fig. 1. Drug tolerance is a dynamic state which involves a multistep phenotypic reprogramming.
a Percentage of total (blue), S/G2 (green) or G1 (red) populations of HCC4006 subclonal cells during osimertinib treatment (1 µM). Data are mean ± SEM. Representative data from n = 4 independent biological experiments. b Representative fluorescence images of S/G2 (green) or G1 (red) HCC4006 subclonal cells during osimertinib treatment (1 µM) from n = 4 independent biological experiments. Scale bar: 50 µm. c Western Blot analysis of EGFR, retinoblastoma (Rb) and p27Kip1 signaling pathway in untreated (CT) and osimertinib-treated S/G2 or G1 HCC4006 subclonal cells. Representative blots from n = 2 independent biological experiments. d UMAP plot of the different clusters from Seurat analysis of untreated (CT) and osimertinib-treated HCC4006 subclonal cells obtained after scRNAseq. The relative percentage of each population was G1 = 35.5% and S/G2 = 30.3% for untreated cells and G1 = 70.4% and S/G2 = 0.6% after 20 days of osimertinib treatment 1 µM. Between 2000 and 3000 cells were recovered for each condition for library preparation. e Violin plots representing the distribution of indicated signature scores in the different clusters. f Dot plot showing the expression level and percentage of expressing cells of genes specific for the mucous/serous, alveolar and mesenchymal phenotypes in the different clusters. g, Western Blot analysis of proteins related to the alveolar (AGER) and mesenchymal (N-Cadherin) phenotypes in untreated, osimertinib-treated for 5 days and osimertinib-resistant proliferative HCC4006 subclones (RPC: Resistant Proliferative cells). Representative blots from n = 4 independent biological experiments. h Distribution of the mean normalized (z-score) expression of alveolar (blue), mesenchymal (red) and E2F targets (green) signatures, based on latent time. Osi-G1 cluster 4 is shown in orange and cluster 5 in blue. Data are mean ± SEM. i Proliferation of G1 (red) and S/G2 (green) HCC4006 subclonal cells sorted by FACS after 5 days of osimertinib treatment (1 µM) and re-plated in the presence of the drug. Data are mean ± SEM. Representative data from n = 3 independent biological experiments. j Mean normalized (z-score) expression per cluster of genes involved in KRAS signaling, interferon, Rho GTPase cycle, actin cytoskeleton, NRF2 and glutathione metabolism pathways. Source data are provided as a Source data file.
Fig. 2
Fig. 2. Drug-tolerant cells transcriptomic signature reveals similarities with normal alveolar cells.
a GSEA analysis showing downregulated (blue; nominal p-value < 0.01, NES < −1) and upregulated (red; nominal p-value < 0.01, NES > 1) gene signatures from the Human Molecular Signatures Database (MSigDB), organized from the least frequently shared (1/7) to the most frequently shared (7/7) signatures across the different models of EGFR-TKI-induced drug-tolerant cells. Nominal p-value and NES were calculated using GSEA software. b Drug-tolerant-associated genes ranked based on the mean log2 fold change expression (DTC vs untreated, p < 0.01) in 7/7 (red) or 6/7 (orange) models described in a. Data are mean ± SEM. p-value was obtained by DESeq2 analysis. c and d Distribution of mean expression levels (z-scores) of genes from the DTC_UP and DTC_DOWN signatures in untreated cells or at indicated stages of treatment in PC9 and HCC4006 subclones (c) and in the different clusters identified by scRNAseq (d). e Box plots of signature scores of DTC_UP and DTC_DOWN in lung adenocarcinomas (tumor, n = 58) compared to adjacent normal lung tissue (normal, n = 58) from TCGA-LUAD database. The box plots display 25th (lower bound), 50th (center, median), and 75th (upper bound) percentiles, with whiskers generated with the Tukey method; all points are shown. p-value was calculated using a two-tailed paired t-test. f GSEA analysis of alveolar type 1, muscle-contraction and E2F targets signatures in normal lungs compared to lung adenocarcinomas using the TCGA-LUAD database. DTC: drug-tolerant cell; RPC: resistant proliferative cell. Source data are provided as a Source data file.
Fig. 3
Fig. 3. Farnesyltransferase inhibition prevents the emergence of resistance to targeted therapies in vitro.
a Filamentous actin (F-actin) staining of indicated NSCLC cell line models in control or drug-tolerant cells (DTC) treated with their corresponding targeted therapy at 1 µM. Scale bar: 20 µm. Representative of n = 3 independent biological experiments. b Western blot analysis of total and phosphorylated MLC2 in the indicated NSCLC cell line models in control cells or DTC treated with their corresponding targeted therapy at 1 µM. Representative blots from n = 3 independent biological experiments. c Bubble plot showing the expression and distribution of genes involved in the Rho/ROCK pathway in the different clusters. d Cellular response of PC9, HCC4006, HCC827 parental and subclonal cells treated with 1 µM osimertinib alone or in combination with ROCK1/2 inhibitors (Y276324, 10 µM; GSK269962A4, 5 µM), RHOA/B/C inhibitor (TatC3, 5 µg/ml), actin polymerization inhibitor (LatB, Latruncunlin B, 0.3 µM), geranylgeranyltransferase inhibitor (GGTi, 1 µM) or farnesyltransferase inhibitor (FTi; 1 µM). Data are representative of n = 3 independent biological experiments. e Crystal violet staining of indicated cellular models untreated or treated until relapse with corresponding targeted therapy (T.T.) alone (1 µM) or in combination with Tipifarnib (1 µM). Representative images from n = 3 independent biological experiments. f Differential expression of genes (p < 0.01) coding for farnesylated proteins in osi-G1 vs CT-G1 (G1) and osi-S/G2 vs osi-G1 (S/G2) in HCC4006 subclonal cells (left) and in indicated NSCLC models of drug-tolerance (Right); p-value for each individual model was obtained by DESeq2 analysis. Right: mean (Log2FC [DTC vs untreated], all models) ±SEM; red dots: upregulated with p < 0.01, blue dots: downregulated with p < 0.01, gray: non-significant; p-value for mean Log2FC was calculated using two-tailed unpaired t-test. g Box plots showing the percentage of best response after treatment with osimertinib alone (1 µM) or in combination with Tipifarnib (1 µM), or after transfection with indicated siRNA (10 nM). The box plots display 25th (lower bound), 50th (center, median), and 75th (upper bound) percentiles, with whiskers generated with the Tukey method; Data represent n = 5 (osi, osi+tipi) or n = 3 (siRNA) independent biological experiments. p-value was calculated using a two-tailed unpaired t-test. h Top: Western blot analysis of FNTB protein expression and HRAS prenylation status in the FNTB WT and KO cells. The upper and lower arrows show unfarnesylated and farnesylated proteins respectively. Bottom: Mean tumor volume of PC9 FNTB-WT and FNTB-KO xenografts. Mice were treated 5 days/week with vehicle or Osimertinib (Osi, 5 mg/kg, q.d). Vehicle WT, n = 3; Vehicle KO, n = 3; osi WT, n = 12; osi KO, n = 14. Data are mean ± SEM; the p-value was calculated using two-tailed unpaired t-test. i Percentage of tumor volume from baseline after 7 months of osimertinib treatment in mice bearing FNTB-WT and FNTB-KO PC9 xenografts. Source data are provided as a Source data file.
Fig. 4
Fig. 4. Tipifarnib alters the adaptive response to osimertinib and induces ISR-mediated apoptotic pathway.
a Cell fate after progression to S/G2 of HCC4006 subclones treated or not with osimertinib (1 μM), tipifarnib (1 μM) or the combination (Osi+Tipi). Bottom: The data represents the monitoring of cells (n = 20/condition) since their entry to S/G2 phase, with the time spent for each phase/event of the cell cycle. Top: The bar plot recapitulates the percentage of cells that experienced mitosis and endoreplication after S/G2 phase, and the percentage of cells that died before dividing. b Top: UMAP plot of the different clusters of untreated, osimertinib-treated and osimertinib+tipifarnib-treated G1 and S/G2 HCC4006 subclones obtained by scRNAseq. Bottom: Distribution of normalized expression levels (z-score) of DTC-related genes regulated by tipifarnib-osimertinib co-treatment. c Signature scores of DTC_UP and DTC_DOWN in untreated (CT), osimertinib (O) and osimertinib + tipifarnib (OT) treated G1 and S/G2 cells. The box plots display 25th (lower bound), 50th (center, median), and 75th (upper bound) percentiles, with whiskers generated with the Tukey method; all points are shown. p-value was calculated using a two-sided Wilcoxon test. d Signature scores of RHO_GTPase_cycle-related, mesenchymal-related and alveolar type 1 (AT1)-related gene signatures in untreated (CT), osimertinib (Osi) and osimertinib + tipifarnib (Osi+Tipi) treated G1 and S/G2 cells. The box plots within violin plots are similar to c. p-value was calculated using two-sided Wilcoxon test. For c and d: CT-G1, n = 1678; O-G1, n = 2097, OT-G1, n = 897; CT-SG2, n = 2654; O-SG2, n = 1963; OT-SG2, n = 1266. e Dot plot showing the expression level and percentage of cells expressing genes specific for the alveolar and mesenchymal phenotypes in the different clusters. f Distribution of normalized expression levels (z-score) of genes related to integrated stress response (ISR) pathway. g Western blot analysis of proteins related to apoptosis (PARP and caspase-3) and ISR (CHOP) of HCC4006 subclones treated with osimertinib (1 μM), tipifarnib (1 μM) and ISR inhibitor (ISRIB, 1 µM) alone or in combination. Representative blots from n = 3 independent biological experiments. The upper arrow shows the total and the lower arrow shows cleaved PARP. h Crystal violet staining of PC9 cells pre-treated or not with ISRIB (1 µM, 24 h) and treated for 5 days with 1 µM osimertinib alone or in combination with 1 µM tipifarnib. Representative images from n = 3 independent biological experiments. Source data are provided as a Source data file.
Fig. 5
Fig. 5. Tipifarnib prevents relapse to targeted therapies in vivo.
a Mean tumor volume of the TP103 NSCLC PDX model (EGFRL858R/T790M) treated 5 days/week with vehicle (n = 5), tipifarnib (tipi, 80 mg/kg, b.i.d., n = 5), osimertinib (osi, 5 mg/kg, q.d, n = 10) or by the combination (osi+tipi, n = 10). Data are mean ± SEM; p-value was calculated using two-tailed unpaired t-test. b Log2FC tumor growth vs baseline at 4-week treatment with osimertinib or osimertinib+tipifarnib. c Overall survival of the mice treated with osimertinib or osimertinib+tipifarnib. The graph is the result of one cohort of mice with n = 6 mice in both arms. p-value was calculated using the log-rank Mantel-Cox test. d Representative images of Hematoxylin and Eosin (H&E) staining and Ki67 IHC from PDX tumors collected after indicated times and treatments. Data are representative of n = 3 (vehicle, tipifarnib), n = 6 (osimertinib) and n = 5 (osimertinib+tipifarnib) independent tumors. Scale bar: 50 µm. e Ki67 IHC scores quantified from 4 different zones of each independent tumor presented in d. f Western Blot analysis of individual PDX after 2 weeks (vehicle, n = 3; tipifarnib, n = 3), 2 months (osimertinib, n = 4) and 5 months (osi+tipi, n = 4) treatment. For HRAS: the upper arrow shows unfarnesylated and the lower arrow shows farnesylated protein; for PARP: the upper arrow shows total and the lower arrow shows cleaved protein. g Mean tumor volume of PC9 xenografts treated 5 days/week with vehicle (n = 6), tipifarnib (Tipi, 80 mg/kg, b.i.d., n = 6), osimertinib (osi, 5 mg/kg, q.d, n = 10), or by the combination (osi+tipi, n = 12). Data are mean ± SEM; p-value was calculated using two-tailed unpaired t-test. h Mean tumor volume of the LU0387 NSCLC PDX model (EGFRexon20 insertion) treated 5 days/week with vehicle (n = 8), osimertinib (osi, 25 mg/kg, q.d, n = 8), or the combination (osimertinib + tipifarnib at 60 mg/kg, continuously b.i.d, n = 8, or intermittently 1 week ON/1 week OFF, n = 8). Data are mean ± SEM; p-value was calculated using two-tailed unpaired t-test. p-value (osi+tipi continuous vs osi) is shown in blue and (osi+tipi alternate vs osi) in orange. i Percentage of LU0387 tumor volume vs baseline at day 49. j Mean tumor volume of the TP60 NSCLC PDX model (KRASG12C) treated with vehicle (n = 3), tipifarnib (tipi, 80 mg/kg, b.i.d., n = 3), sotorasib (soto, 30 mg/kg, q.d, n = 5), or the combination (soto+tipi, n = 6). Data are mean ± SEM; p-value was calculated using two-tailed unpaired t-test. p-value (soto+tipi vs soto) is shown in red and (soto+tipi vs tipi) in green. k Log2 fold change of the TP60 PDX tumor size compared to baseline at day 70. l Mean tumor volume of the TP79 NSCLC PDX model (KRASG12C) treated with vehicle (n = 6), tipifarnib (tipi, 80 mg/kg, b.i.d., n = 4), sotorasib (soto, 30 mg/kg, q.d, n = 7), or the combination (soto+tipi, n = 7). Data are mean ± SEM; p-value was calculated using two-tailed unpaired t-test. m Log2 fold change of the TP79 PDX tumor size compared to baseline at day 77. Source data are provided as a Source data file.

References

    1. Soria JC, et al. Osimertinib in untreated EGFR-mutated advanced non-small-cell lung cancer. N. Engl. J. Med. 2018;378:113–125. doi: 10.1056/NEJMoa1713137. - DOI - PubMed
    1. Rosell R, et al. Erlotinib versus standard chemotherapy as first-line treatment for European patients with advanced EGFR mutation-positive non-small-cell lung cancer (EURTAC): a multicentre, open-label, randomised phase 3 trial. Lancet Oncol. 2012;13:239–246. doi: 10.1016/S1470-2045(11)70393-X. - DOI - PubMed
    1. Shaw AT, et al. Alectinib in ALK-positive, crizotinib-resistant, non-small-cell lung cancer: a single-group, multicentre, phase 2 trial. Lancet Oncol. 2016;17:234–242. doi: 10.1016/S1470-2045(15)00488-X. - DOI - PMC - PubMed
    1. Shaw AT, et al. First-Line lorlatinib or crizotinib in advanced ALK-positive lung cancer. N. Engl. J. Med. 2020;383:2018–2029. doi: 10.1056/NEJMoa2027187. - DOI - PubMed
    1. Shaw AT, et al. Crizotinib in ROS1-rearranged non-small-cell lung cancer. N. Engl. J. Med. 2014;371:1963–1971. doi: 10.1056/NEJMoa1406766. - DOI - PMC - PubMed

MeSH terms