

doi: 10.1038/s41593-024-01682-8.
Epub 2024 Jun 27.
T cell-mediated microglial activation triggers myelin pathology in a mouse model of amyloidosis
Affiliations
- PMID: 38937583
- PMCID: PMC11303250
- DOI: 10.1038/s41593-024-01682-8
Item in Clipboard
T cell-mediated microglial activation triggers myelin pathology in a mouse model of amyloidosis
Nat Neurosci.
2024 Aug.
Abstract
Age-related myelin damage induces inflammatory responses, yet its involvement in Alzheimer's disease remains uncertain, despite age being a major risk factor. Using a mouse model of Alzheimer's disease, we found that amyloidosis itself triggers age-related oligodendrocyte and myelin damage. Mechanistically, CD8+ T cells promote the progressive accumulation of abnormally interferon-activated microglia that display myelin-damaging activity. Thus, our data suggest that immune responses against myelinating oligodendrocytes may contribute to neurodegenerative diseases with amyloidosis.
© 2024. The Author(s).
Conflict of interest statement
The authors declare no competing interests.
Figures
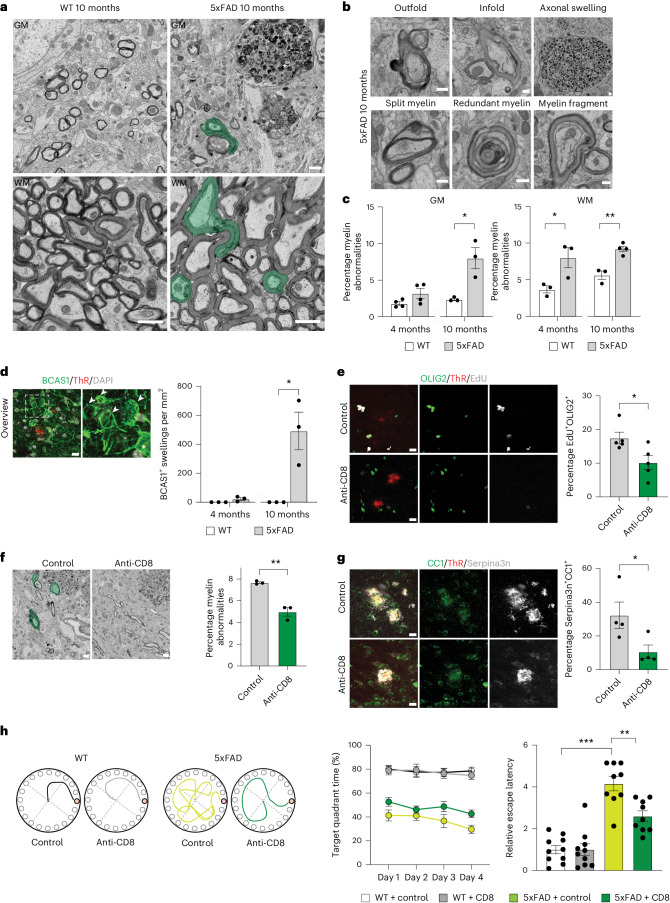
a, SEM images showing myelin abnormalities (green) in WT and 5xFAD mice aged 10 months. The asterisk shows an axonal swelling with thin myelin. b,c, Images (b) and quantification (c) of different myelin abnormalities in 5xFAD brain sections. Unpaired two-sided Student’s t-test for n = 3–4 animals (GM, WT 10 months, 5xFAD 10 months, *P = 0.018; WM, WT 4 months, 5xFAD 4 months, *P = 0.041; WM, WT 10 months, 5xFAD 10 months, **P = 0.002). d, Image of BCAS1+ (green) swellings (shown with white arrowheads) lacking a nucleus (stained with DAPI) in 5xFAD mice aged 10 months. Thiazine red (ThR) indicates plaques. Quantifications of BCAS1+ swellings in 4-month old and 10-month old WT and 5xFAD mice. Unpaired two-sided Student’s t-test for n = 3 animals (WT 10 m, 5xFAD 10 m, *P = 0.019). e, Image and quantification showing the percentage of EdU+ (gray) OLIG2+ (green) cells in the cortex of control or CD8+ T cell-depleted 5xFAD mice. ThR (red) indicates plaques; unpaired two-sided Student’s t-test for n = 5 animals (control, anti-CD8, *P = 0.027). f, SEM images and quantification of myelinated axons with myelin abnormalities (green) in the cortex of control or CD8+ T cell-depleted 5xFAD mice; unpaired Student’s t-test for n = 3 animals (control, anti-CD8, **P = 0.002). g, Image and quantification showing the percentage of Serpina3n+ (gray) CC1+ (green) oligodendrocytes in the cortex of control or CD8+ T cell-depleted 5xFAD mice. ThR (red) indicates plaques. Unpaired two-sided Student’s t-test for n = 4 animals (control, anti-CD8, *P = 0.049). h, Behavior of control or CD8+ T cell-depleted WT and 5xFAD mice in the Barnes maze. Left: Tracing graphs in platform trials in the Barnes maze. Right: Quantification of the target quadrant time (%) on the platform during the training sessions and relative escape latency to the target hole in the probe trial. One-way analysis of variance (ANOVA) with Tukey’s post hoc analysis for n = 9–10 animals (WT control, 5xFAD control, ***P = 0.0000000069; 5xFAD control, 5xFAD anti-CD8, **P = 0.0019). Each point on the graph represents one animal. Data are presented as the mean ± s.e.m. a,f, Scale bar, 1 µm. b, Scale bar, 0.4 µm. d,e,g, Scale bar, 10 µm. Source data
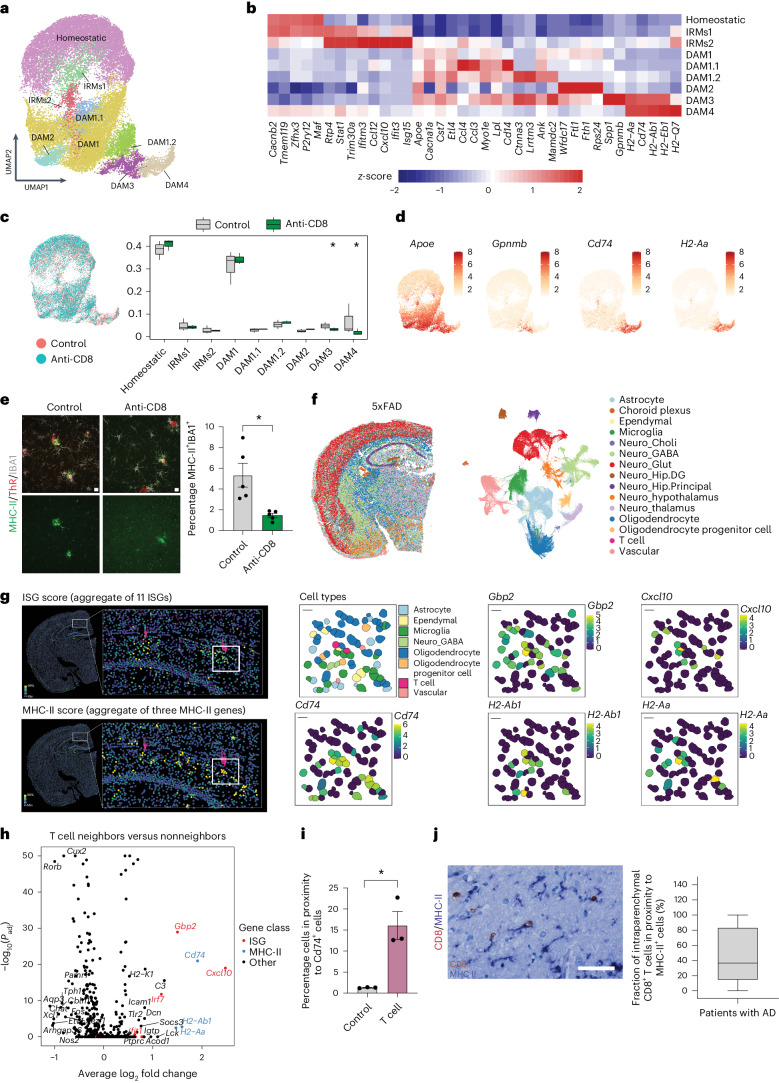
a, UMAP plot of microglia, colored according to the identified populations. b, Heatmaps of scaled average expression of selected marker genes of microglial populations. c, Left: UMAP plots of microglia. Right: Proportions of different microglial populations in control (gray) or CD8+ T cell-depleted (green) 5xFAD mice. The central line represents median, the boxes the upper and lower quartiles of the proportions, and the whiskers show the full range of all populations. Asterisks indicate statistical significance for n = 3 animals (using scCODA). Statistical significance was determined for n = 3 animals using scCODA. d, UMAP plots of microglia colored according to the expression of selected gene markers. e, Image and quantification showing the percentage of MHC-II+ (green) IBA1+ (gray) cells in the cortex of control or CD8+ T cell-depleted 5xFAD mice. ThR (red) indicates plaques. Unpaired two-sided Student’s t-test for n = 5 animals (control, anti-CD8, *P = 0.010). Data are presented as the mean ± s.e.m. f, UMAP embedding and spatial plots of single-cell transcriptional profiles measured using MERFISH. Cells are colored according to the major cell type. n = 306,537 segmented single cells from five brain sections from n = 3, 9.5-month-old 5xFAD animals. g, Left: MERFISH spatial plot showing the values of ISG (top) and the MHC-II (bottom) expression score. The arrows in the zoom-in show the positions of T cells. Right: Plots show the cell type identities and expression of selected ISG and MHC-II genes. h, Volcano plot of differential gene expression between 50 nearest neighbors of T cells and remaining cells. Bonferroni-adjusted P values from a Wilcoxon rank-sum test are shown. i, Quantification of Cd74+ neighboring cells in proximity to control and T cells. Unpaired two-sided Student’s t-test (control, T cell, *P = 0.011). Data are presented as the mean ± s.e.m. Fifty neighboring cells each were analyzed for a total of 93 CD8+ T cells and 5,000 random cells. j, IHC of human hippocampal sections from 14 patients with AD showed CD8+ T cells (brown) in contact with MHC-II+ myeloid cells (blue). The box plot shows the percentage of CD8+ T cells in contact (<50 µm) with MHC-II+ cells in patients with AD (ABC score > 1). The central line represents the median, the boxes the upper and lower quartiles and the whiskers show the full range of the data. e, Scale bar, 10 µm. j, Scale bar, 50 µm. Source data
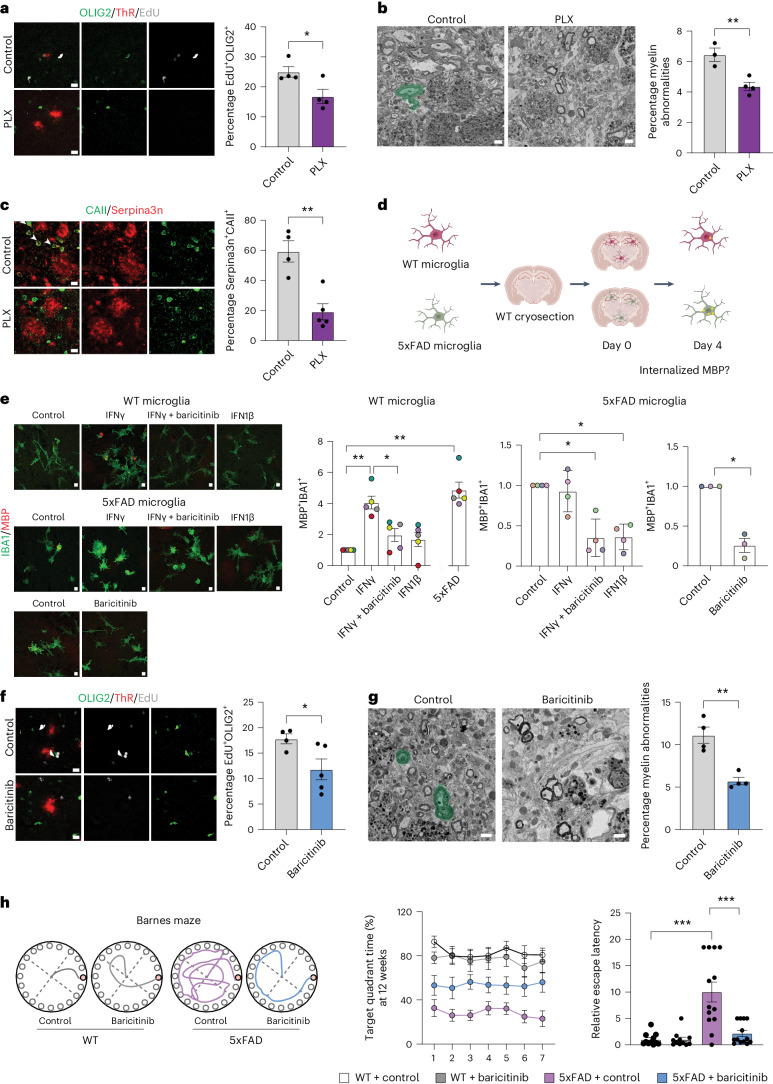
a, Image and quantification of OLIG2+ (green) EdU+ (gray) cells in the cortex of control or PLX-treated mice. ThR (red) indicate plaques. Unpaired two-sided Student’s t-test for n = 4 mice (control, PLX, *P = 0.03). b, SEM images and quantification of myelin abnormalities (green) in the cortex of control or PLX mice. Unpaired two-sided Student’s t-test for n = 3–4 mice (control, PLX, **P = 0.008). c, Image and quantification of CAII+ (green) Serpina3n+ (red) oligodendrocytes in the cortex of control or PLX mice. Unpaired two-sided Student’s t-test for n = 4–5 mice (control, PLX, **P = 0.0024). d, Schematic of the assay. e, Image showing IBA1+ (green) cells with internalized MBP (red). Quantification indicated fold change in the number of MBP+IBA1+ cells normalized to control. Left and middle: One-way ANOVA with Tukey’s post hoc test. Right, Unpaired two-sided Student’s t-test for n = 3–5 independent experiments (WT microglia, control, IFNγ, **P = 0.008; WT microglia, IFNγ, IFNγ + baricitinib, *P = 0.016; WT microglia, 5xFAD microglia, **P = 0.008; 5xFAD microglia, control, IFNγ + baricitinib, *P = 0.034; 5xFAD microglia, control, IFN1β, *P = 0.012; 5xFAD microglia, control, baricitinib, *P = 0.013). f, Image and quantification of OLIG2+ (green) EdU+ (gray) cells in the cortex of 7.5-month-old control or baricitinib-treated mice. ThR (red) indicate plaques. Unpaired two-sided Student’s t-test for n = 4–5 mice (control, baricitinib, *P = 0.047). g, SEM images and quantification of myelin abnormalities (green) in the cortex of 9-month-old control or baricitinib-treated mice. Unpaired two-sided Student’s t-test for n = 4 mice (control, baricitinib, **P = 0.002). h, Behavior of 5xFAD mice in the Barnes Maze after 12 weeks of treatment with baricitinib. Left: Tracing graphs in the platform trials in the Barnes maze. Right: Quantification of time in the target quadrant (%) on the platform during training and relative escape latency to the target hole in the probe trial. One-way ANOVA with Tukey’s post hoc analysis for n = 11–13 mice (relative escape latency, 12 weeks, WT control, 5xFAD control, ***P = 0.00000431; relative escape latency, 12 weeks, 5xFAD control, 5xFAD baricitinib, ***P = 0.00002349). Data are presented as the mean ± s.e.m. a,c,f, Scale bar, 10 µm. b,g, Scale bar, 1 µm. Source data
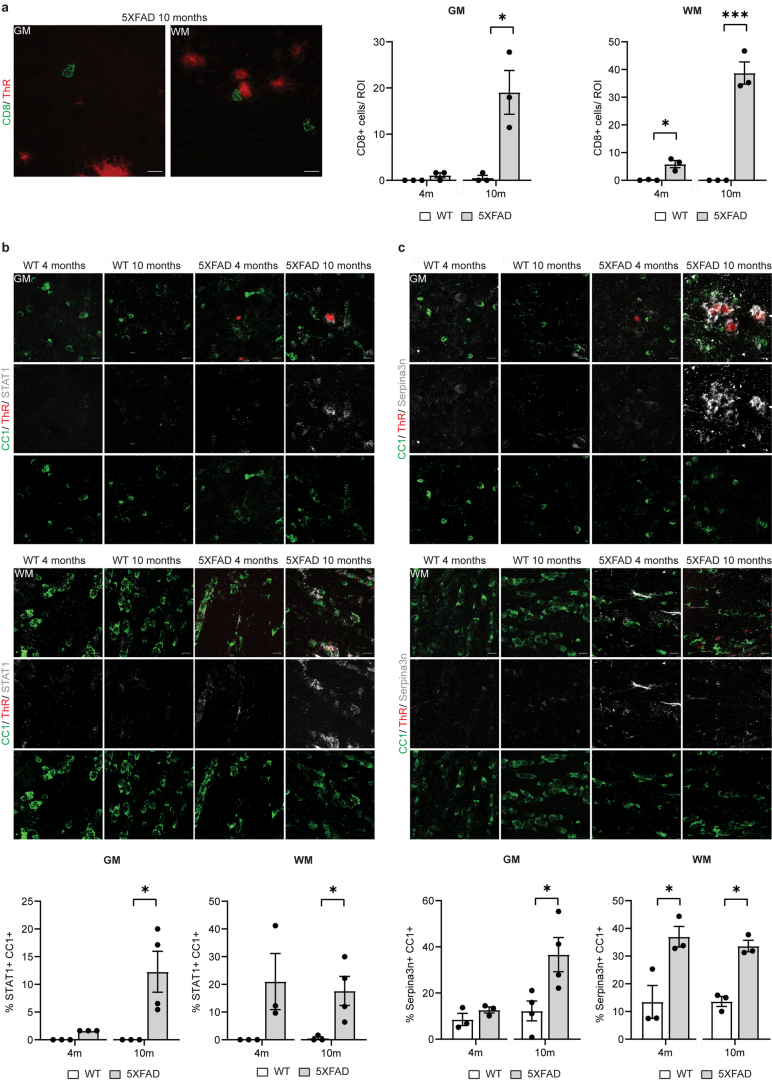
a, Representative image showing CD8+ T-cells (green) in the cortex and corpus callosum of 5xFAD mice aged 10 months. Plaques are stained with Thiazine Red (ThR, red). Scale bar, 10 µm. Quantifications indicate the number of CD8+ T cells. Statistical significance was determined for n = 3 animals using unpaired two-sided Student’s t-test (GM, WT 10 m, 5xFAD 10 m, *p = 0.017; WM, WT 4 m, 5XFAD 4 m, *p = 0.011; WM, WT 10 m, 5xFAD 10 m, ***p = 0.0006). b, Representative image showing STAT1+ (grey) CC1+ oligodendrocytes (green) in the cortex (upper panel) and corpus callosum (lower panel) of WT and 5xFAD mice aged 4 and10 months. Plaques are stained with Thiazine Red (ThR, red). Scale bar, 10 µm. Quantifications indicate the percentage of CC1+ oligodendrocytes also positive for STAT1. Statistical significance was determined for n = 3-4 animals using unpaired two-sided Student’s t-test (GM, WT 10 m, 5xFAD 10 m, *p = 0.037; WM, WT 10 m, 5xFAD 10 m, *p = 0.040). c, Representative image showing Serpina3n+ (grey) CC1+ oligodendrocytes (green) in the cortex (upper panel) and corpus callosum (lower panel) of WT and 5xFAD mice aged 4 and10 months. Plaques are stained with Thiazine Red (ThR, red). Scale bar 10 µm. Quantifications indicate the percentage of CC1+ oligodendrocytes also positive for Serpina3n. Statistical significance was determined for n = 3-4 animals using unpaired two-sided Student’s t-test (GM, WT 10 m, 5xFAD 10 m, *p = 0.029; WM, WT 4 m, 5XFAD 4 m, *p = 0.028; WM, WT 10 m, 5xFAD 10 m, *p = 0.001). Each point on the graph represents one animal. Data is presented as mean ± SEM. Source data
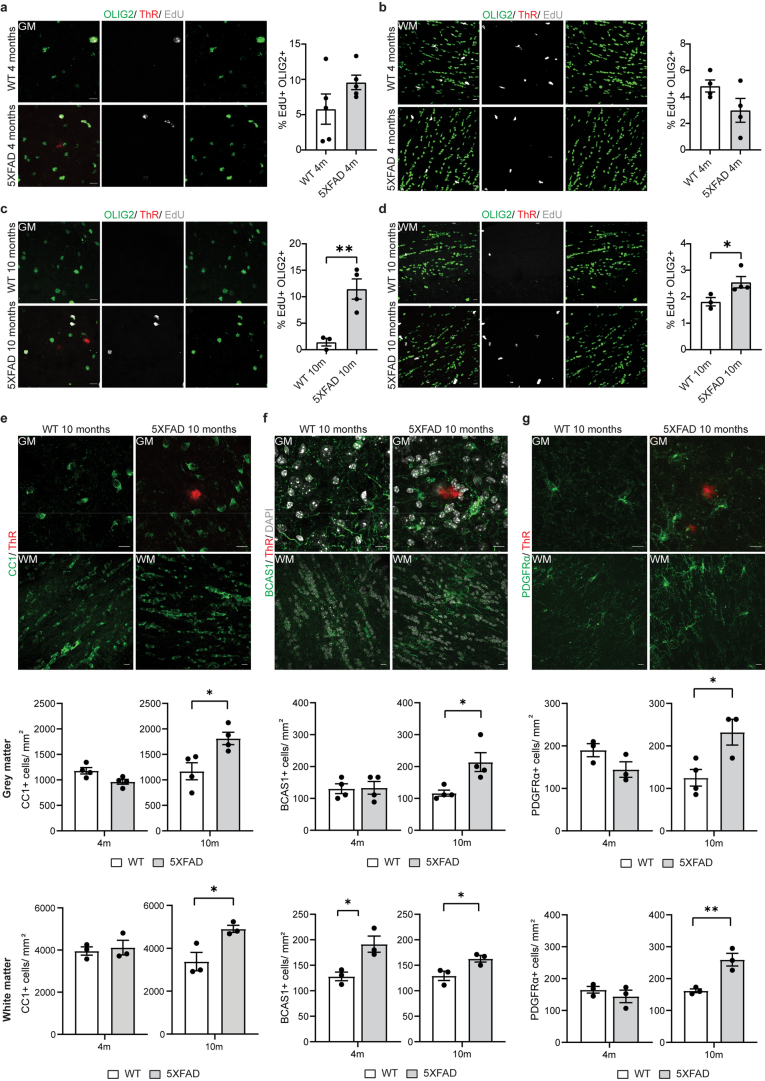
a-d, Representative image and quantification showing percentage of EdU+ (grey) OLIG2+ (green) cells in the cortex and corpus callosum of WT and 5xFAD mice aged 4 and 10 months. Plaques are stained with Thiazine Red (ThR, red). Scale bar, 10 µm. Statistical significance was determined for n = 3-4 animals using unpaired two-sided Student’s t-test (GM, WT 10 m, 5xFAD 10 m, **p = 0.0079; WM, WT 10 m, 5xFAD 10 m, *p = 0.049). e, Representative image and quantification showing number of CC1+ (green) oligodendrocytes in the cortex and corpus callosum of WT and 5xFAD mice aged 4 and 10 months. Plaques are stained with Thiazine Red (ThR, red). Scale bar 10 µm. Statistical significance was determined for n = 3-4 animals using unpaired two-sided Student’s t-test (GM, WT 10 m, 5xFAD 10 m, *p = 0.020; WM, WT 10 m, 5xFAD 10 m, n = 3 animals, *p = 0.029). f, Representative image and quantification showing number of BCAS1+ (green) oligodendrocytes in the cortex and corpus callosum of WT and 5xFAD mice aged 4 and 10 months. Plaques are stained with Thiazine Red (ThR, red). Scale bar, 10 µm. Statistical significance was determined for n = 3-4 animals using unpaired two-sided Student’s t-test (GM, WT 10 m, 5xFAD 10 m, *p = 0.020; WM, WT 4 m, 5xFAD 4 m, *p = 0.024; WM WT 10 m, 5xFAD 10 m, *p = 0.039). g, Representative image and quantification showing number of PDGFRα+ (green) oligodendrocyte precursor cells in the cortex and corpus callosum (lower panel) of WT and 5xFAD mice aged 4 and 10 months. Plaques are stained with Thiazine Red (ThR, red). Scale bar 10 µm. Statistical significance was determined for n = 3-4 animals using unpaired two-sided Student’s t-test (GM, WT 10 m, 5xFAD 10 m, *p = 0.026; WM, WT 10 m, 5xFAD 10 m, **p = 0.009). Each point on the graph represents one animal. Data is presented as mean ± SEM. Source data
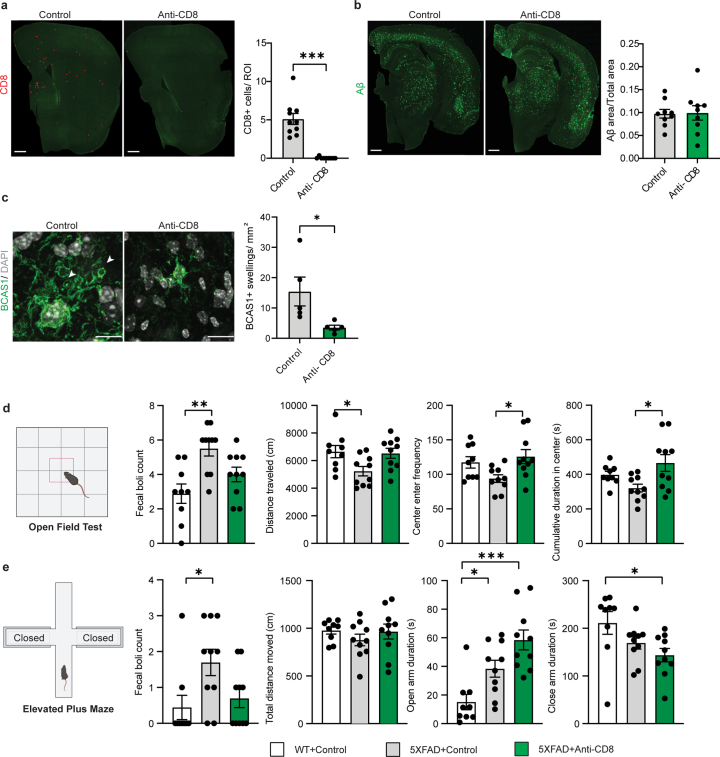
a, Representative image and quantification showing number of CD8+ T cells in mice (7.5 month-old) treated with anti-CD8 and isotype control antibodies. Each dot (red) represents one CD8+ T cell. Scale bar, 500 µm. Statistical significance was determined for n = 9–10 animals using unpaired two-sided Student’s t-test (control, anti-CD8, ***p = 0.001). b, Representative image showing Aβ plaque load (green) in mice (7.5 month-old) treated with anti-CD8 and isotype control antibodies. Scale bar, 500 µm. Quantifications indicate proportion of Aβ positive area normalized to total area in the cortex. Statistical significance was determined for n = 9 animals using unpaired Student’s t-test. c, Representative image and quantification indicating number of BCAS1+ (green) swellings lacking a nucleus (stained with DAPI) in the cortex of 7.5 month-old 5xFAD mice treated with anti-CD8 and isotype control antibodies. Scale bar, 10 µm. Statistical significance was determined for n = 5 animals using unpaired two-sided Student’s t-test (control, anti-CD8, *p = 0.038). d, Behavior of 7.5 month-old WT and 5xFAD mice following 6-week treatment with anti-CD8 and isotype control antibodies in an open-field test. Quantifications indicate fecal boli count, total distance travelled, frequency to enter the center and cumulative time spent in the center. Statistical significance was determined for n = 9-10 animals by one-way ANOVA with Tukey’s post hoc test. (Fecal boli count, WT, 5xFAD+control, **p = 0.0017; Distance traveled, WT, 5xFAD+control,*p = 0.03; Center enter frequency, 5xFAD+control, 5xFAD+anti-CD8, *p = 0.02; Cumulative duration in center, 5xFAD+control, 5xFAD+anti-CD8, *p = 0.01). e, Behavior of 7.5 month-old mice following 6-week treatment with anti-CD8 and isotype control antibodies in an elevated plus maze test. Quantifications indicate fecal boli count, total distance travelled, total time spent in the open arms and total time spent in the closed arms. Statistical significance was determined for n = 9-10 animals by one-way ANOVA with Tukey’s post hoc test. (Fecal boli count, WT, 5xFAD+control, *p = 0.03; Open arm duration, WT, 5xFAD+control, *p = 0.03; Open arm duration, WT, 5xFAD+anti-CD8, ***p = 0.0001; Close arm duration, WT, 5xFAD+anti-CD8, *p = 0.02). Each point on the graph represents one animal. Data is presented as mean ± SEM. Source data
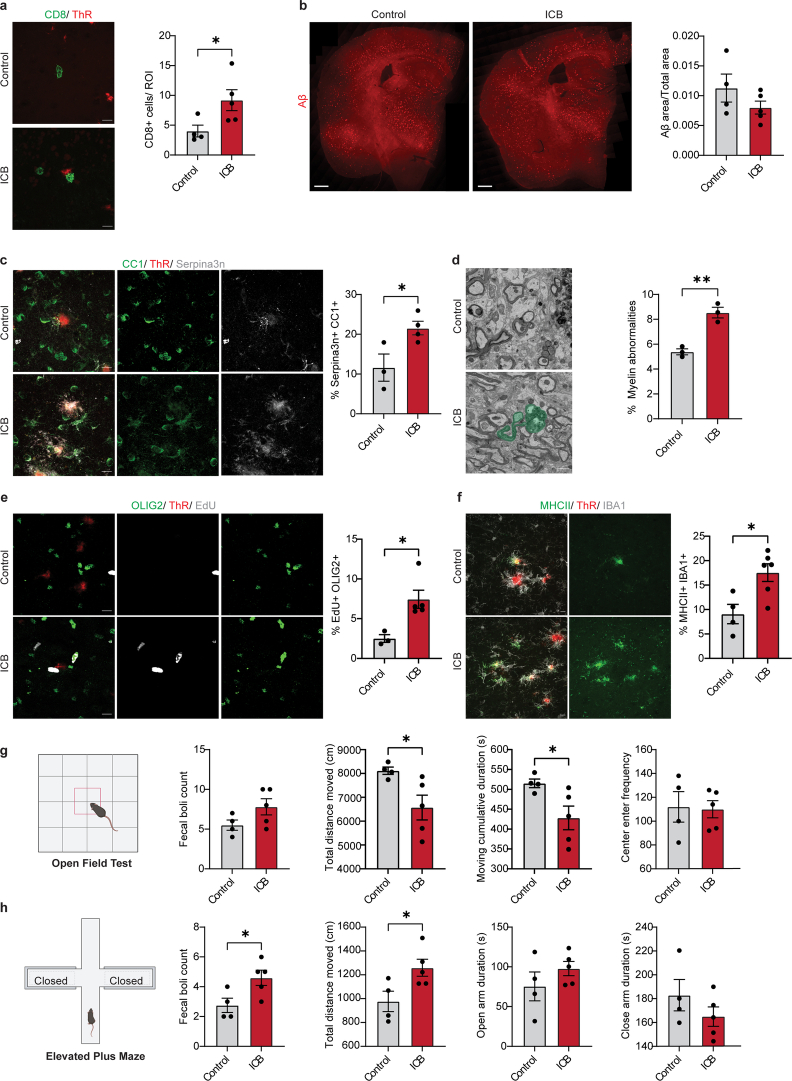
a, Image and quantification showing number of CD8+ T cells (green) in the cortex of control or anti-PD1 and CTLA4 (ICB) treated 5xFAD mice. Plaques are stained with Thiazine Red (ThR, red). Scale bar, 10 µm. Statistical significance was determined for n = 4-5 animals using unpaired two-sided Student’s t-test (control, ICB, *p = 0.048). b, Image and quantification showing Aβ plaque load (red) normalized to total area in the cortex for control or anti-PD1 and CTLA4 (ICB) treated 5xFAD mice. Scale bar, 500 µm. Statistical significance was determined for n = 4-5 animals using unpaired Student’s t-test. c, Representative image and quantification showing percentage of Serpina3n+ (grey) CC1+ (green) oligodendrocytes in the cortex of control or anti-PD1 and CTLA4 (ICB) treated 5xFAD mice. Plaques are stained with Thiazine Red (ThR, red). Scale bar, 10 µm. Statistical significance was determined for n = 3-4 animals using unpaired two-sided Student’s t-test (control, ICB, *p = 0.036). d, SEM images and quantification of myelinated axons with myelin abnormalities (green) in the cortex of control or anti-PD1 and CTLA4 (ICB) treated 5xFAD mice. Statistical significance was determined for n = 3 animals using unpaired two-sided Student’s t-test (control, ICB, *p = 0.003). e, Image and quantification showing percentage of EdU+ (grey) OLIG2+ (green) cells in the cortex of control or anti-PD1 and CTLA4 (ICB) treated 5xFAD mice. Plaques are stained with Thiazine Red (ThR, red). Scale bar, 10 µm. Statistical significance was determined for n = 3-5 animals using unpaired two-sided Student’s t-test (control, ICB, *p = 0.019). f, Image and quantification indicating percentage of MHCII+ (green) IBA1+ (grey) cells in the cortex of control or anti-PD1 and CTLA4 (ICB) treated 5xFAD mice. Plaques are stained with Thiazine Red (ThR, red). Scale bar, 10 µm. Statistical significance was determined for n = 4-6 animals using unpaired two-sided Student’s t-test (control, ICB, *p = 0.015). g, Behavior of control or anti-PD1 and CTLA4 (ICB) treated 5xFAD mice in an open-field test. Quantifications indicate fecal boli count, total distance travelled, frequency to enter the center and cumulative time spent in the center. Statistical significance was determined for n = 4-5 animals using unpaired Student’s t-test (Distance traveled, *p = 0.037; Center enter frequency, *p = 0.041; Cumulative duration in center, *p = 0.014). h, Behavior of control or anti-PD1 and CTLA4 (ICB) treated 5xFAD mice in an elevated plus maze test. Quantifications indicate fecal boli count, total distance travelled, total time spent in the open arms and closed arms. Statistical significance was determined for n = 4-5 animals using unpaired Student’s t-test (Fecal boli count, *p = 0.036; Distance traveled, *p = 0.037). Each point on the graph represents one animal. Data is presented as mean ± SEM. Source data
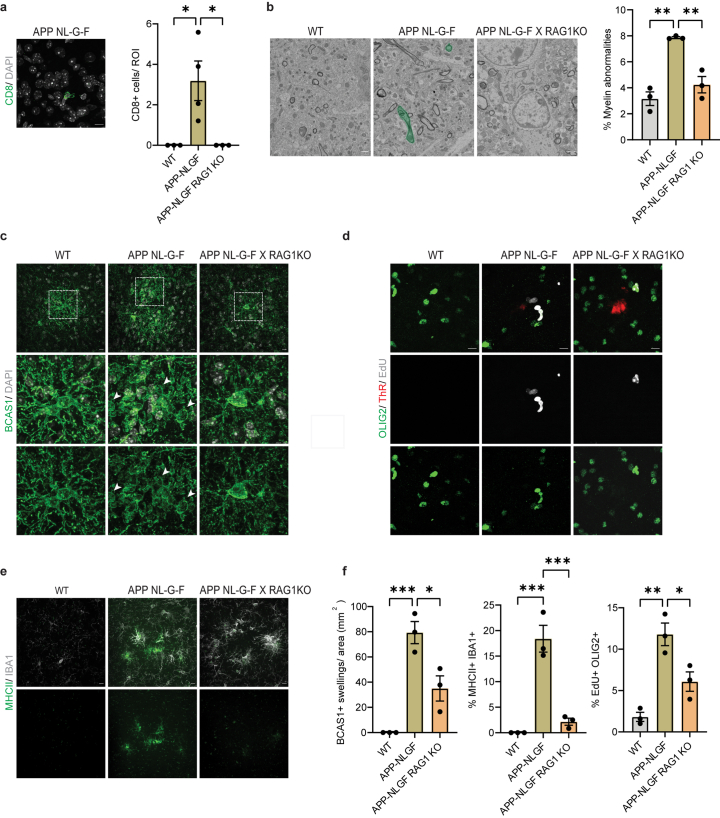
a, Representative image showing CD8+ T cells (green) in the cortex of APP-NLGF mice. Scale bar, 10 µm. Quantifications indicate the number of CD8+ T cells in the cortex of WT, APP-NLGF and APP-NLGF X RAG1KO mice aged 12 months. Statistical significance was determined for n = 3-4 animals by one-way ANOVA with Tukey’s post hoc test (WT, APP-NLGF, *p = 0.0326; APP-NLGF, APP-NLGF X RAG1KO, *p = 0.032). b, Representative scanning electron microscopy images of the cortex of WT, APP-NLGF and APP-NLGF X RAG1KO mice aged 12 months. Myelin abnormalities are shown in green. Scale bar, 1 µm. Quantifications indicate total percentage of myelinated axons with myelin abnormalities. Statistical significance was determined for n = 3 animals by one-way ANOVA with Tukey’s post hoc test (WT, APP-NLGF, **p = 0.001; APP-NLGF, APP-NLGF X RAG1KO, **p = 0.004). c, Representative image of BCAS1+ (green) swellings lacking a nucleus (stained with DAPI) in the cortex of WT, APP-NLGF and APP-NLGF X RAG1KO mice aged 12 months. Scale bar, 10 µm. d, Representative image showing EdU+ (grey) OLIG2+ (green) cells in the cortex of WT, APP-NLGF and APP-NLGF X RAG1KO mice aged 12 months. Plaques are stained with Thiazine Red (ThR, red). Scale bar, 10 µm. e, Representative image showing MHCII+ (green) IBA1+ (grey) cells in the cortex of WT, APP-NLGF and APP-NLGF X RAG1KO mice aged 12 months. Scale bar, 10 µm. f, Quantifications indicate the number of BCAS1 swellings (WT, APP-NLGF, ***p = 0.0008; APP-NLGF, APP-NLGF X RAG1KO, *p = 0.0154), percentage of IBA1+ cells positive for MHCII (WT, APP-NLGF, ***p = 0.0004; APP-NLGF, APP-NLGF X RAG1KO, ***p = 0.0008), percentage of OLIG2+ cells also positive for EdU (WT, APP-NLGF, **p = 0.0015; APP-NLGF, APP-NLGF X RAG1KO, *p = 0.0230). Statistical significance was determined for n = 3 animals by one-way ANOVA with Tukey’s post hoc test. Each point on the graph represents one animal. Data is presented as mean ± SEM. Source data
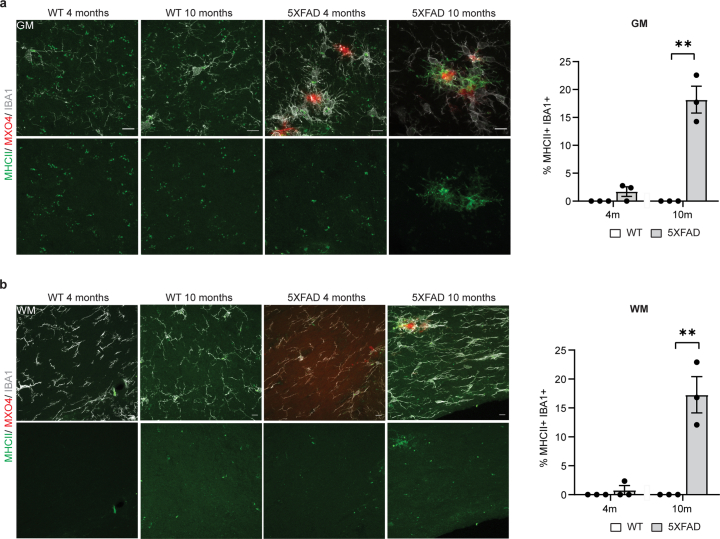
a, Representative image showing MHCII+ (green) IBA1+ cells (grey) in the cortex of WT and 5xFAD mice aged 4 and 10 months. Plaques are stained with Methoxy-X04 (MX04, red). Scale bar, 10 µm. Quantifications indicate the percentage of IBA1+ cells also positive for MHCII. Statistical significance was determined for n = 3 animals using unpaired two-sided Student’s t-test (WT 10 m, 5xFAD 10 m, **p = 0.001). b, Representative image showing MHCII+ (green) IBA1+ cells (grey) in the corpus callosum of WT and 5xFAD mice aged 4 and 10 months. Plaques are stained with Methoxy-X04 (MX04, red). Scale bar, 10 µm. Quantifications indicate the percentage of IBA1+ cells also positive for MHCII. Statistical significance was determined for n = 3 animals using unpaired two-sided Student’s t-test (WT 10 m, 5xFAD 10 m, **p = 0.005). Each point on the graph represents one animal. Data is presented as mean ± SEM. Source data
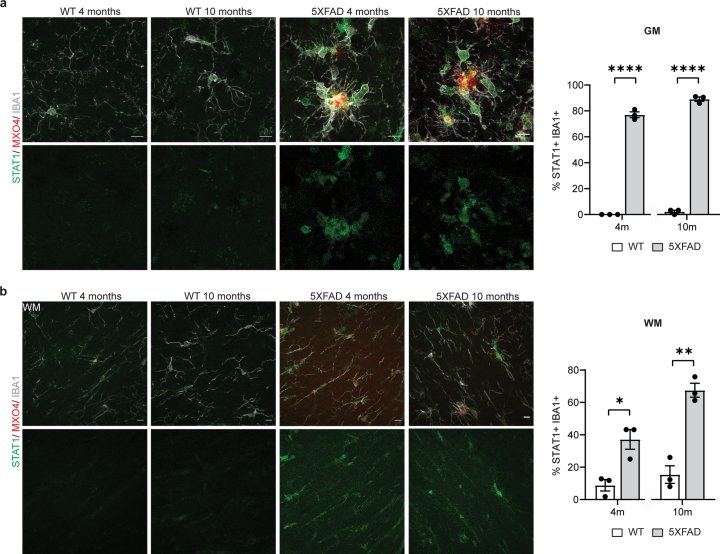
a, Representative image showing STAT1+ (green) IBA1+ (grey) microglia in the cortex of WT and 5xFAD mice aged 4 and 10 months. Plaques are stained with Methoxy-X04 (MX04, red). Scale bar 10 µm. Quantifications indicate the percentage of IBA1+ microglia also positive for STAT1. Statistical significance was determined for n = 3 animals using unpaired two-sided Student’s t-test (WT 4 m, 5xFAD 4 m, ****p = 0.000004; WT 10 m, 5xFAD 10 m, ****p = 0.000002). b, Representative image showing STAT1+IBA1+ cells in the corpus callosum of WT and 5xFAD mice aged 4 and 10 months. Plaques are stained with Methoxy-X04 (MX04, red). Scale bar 10 µm. Quantifications indicate the percentage of IBA1+ microglia also positive for STAT1. Statistical significance was determined for n = 3 animals using unpaired two-sided Student’s t-test (WT 4 m, 5xFAD 4 m, *p = 0.015; WT 10 m, 5xFAD 10 m, **p = 0.001). Each point on the graph represents one animal. Data is presented as mean ± SEM. Source data
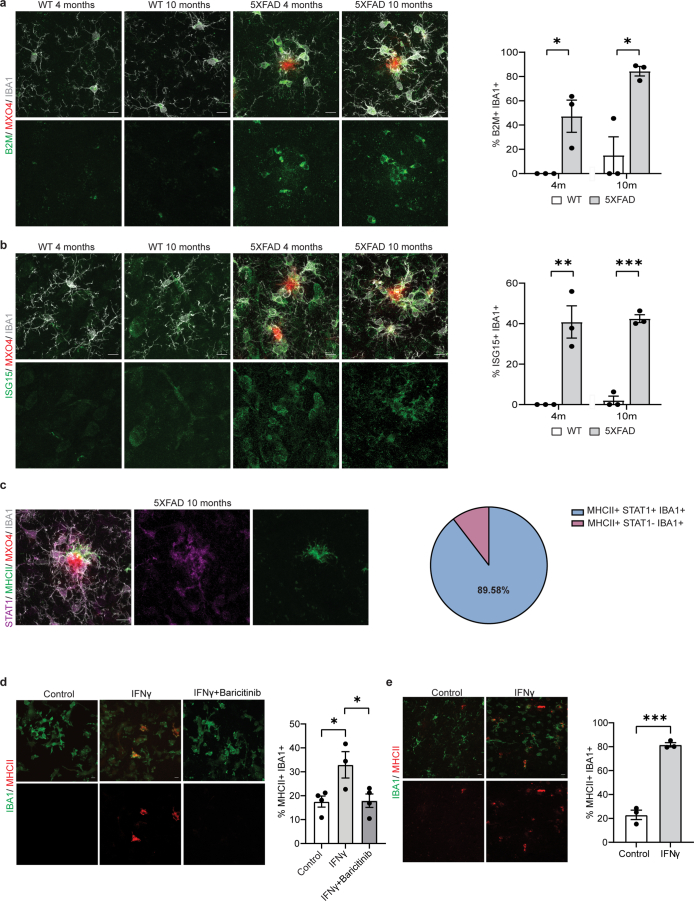
a, Representative image showing B2M+ (green) IBA1+ cells (grey) in the cortex of WT and 5xFAD mice aged 4 and 10 months. Plaques are stained with Methoxy-X04 (MX04, red). Scale bar, 10 µm. Quantifications indicate the percentage of IBA1+ cells also positive for B2M. Statistical significance was determined for n = 3 animals using unpaired two-sided Student’s t-test (WT 4 m, 5xFAD 4 m, *p = 0.023; WT 10 m, 5xFAD 10 m, *p = 0.011). b, Representative image showing ISG15+ (green) IBA1+ cells (grey) in the cortex of WT and 5xFAD mice aged 4 and 10 months. Plaques are stained with Methoxy-X04 (MX04, red). Scale bar, 10 µm. Quantifications indicate the percentage of IBA1+ cells also positive for ISG15. Statistical significance was determined for n = 3 animals using unpaired two-sided Student’s t-test (WT 4 m, 5xFAD 4 m, **p = 0.006; WT 10 m, 5xFAD 10 m, ***p = 0.0001). c, Representative image showing MHCII+ (green) STAT1+ (magenta) IBA1+ (green) cells. Plaques are stained with Methoxy-X04 (MX04, red). Scale bar, 10 µm. Pie chart shows mean percentage of MHCII+ IBA1+ cells positive or negative for STAT1 for n = 3 animals. d, Representative image showing primary microglia cultures treated with control (PBS), 1 ng/µL IFNγ and 1 ng/µL IFNγ with 1 µM baricitinib. Scale bar, 10 µm. Quantifications indicate the percentage of IBA1+ cells (green) also positive for MHCII (red). Statistical significance was determined for n = 3-4 biological replicates by one-way ANOVA with Tukey’s post hoc test (control, IFNγ, *p = 0.036; IFNγ, IFNγ+baricitinib, *p = 0.040). e, Representative image of old 24-month old mice injected with PBS (control) and 10 ng IFNγ. Scale bar, 10 µm. Quantifications indicate the percentage of IBA1+ cells (green) also positive for MHCII (red). Statistical significance was determined for n = 3 animals using unpaired two-sided Student’s t-test (control, IFNγ, ***p = 0.0002). Each point on the graph represents one animal. Data is presented as mean ± SEM. Source data
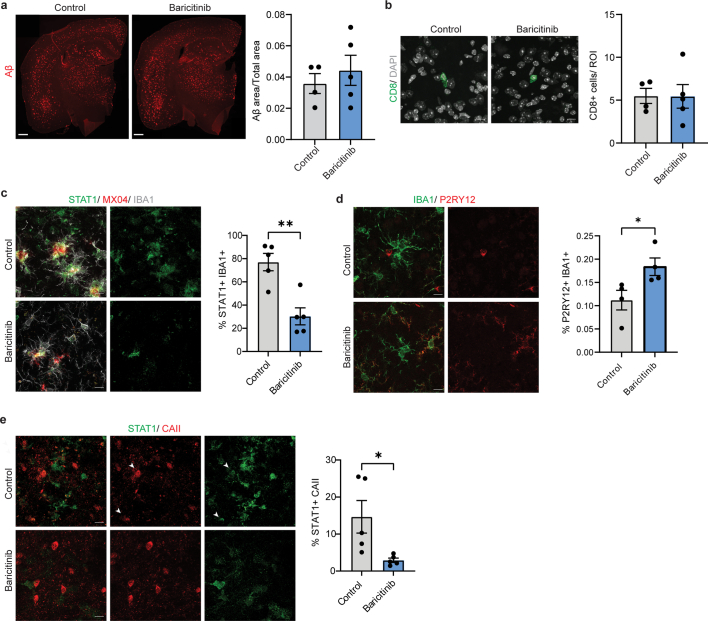
a, Representative image showing Aβ plaque load (red) in 9 months old control and baricitinib treated mice. Quantifications indicate proportion of Aβ positive area normalised to total area in the cortex. Statistical significance was determined for n = 4-5 animals using unpaired Student’s t-test. b, Representative image showing CD8+ T cells (green) in the cortex of control and baricitinib treated mice (9 month-old). Scale bar, 10 µm. Quantifications indicate the number of CD8+ T cells in the cortex. Statistical significance was determined for n = 4-5 animals using unpaired Student’s t-test. c, Representative image showing STAT1+ (green) IBA1+ (grey) cells in control and baricitinib treated mice (7.5 months old). Plaques are stained with Methoxy-X04 (MX04, red). Scale bar, 10 µm. Quantifications indicate percentage of IBA1+ cells also positive for STAT1. Statistical significance was determined for n = 5 animals using unpaired two-sided Student’s t-test (control,baricitinib, **p = 0.002). d, Representative image showing P2RY12 + (red) IBA1+ (green) cells in the cortex of control and baricitinib treated mice (7.5 month-old). Scale bar, 10 µm. Quantifications indicate percentage of IBA1+ cells also positive for P2RY12 . Statistical significance was determined for n = 4 animals using unpaired two-sided Student’s t-test (Control, Baricitinib, *p = 0.04). e, Representative image showing STAT1+ (green) CAII+ (red) oligodendrocytes in the cortex of control and baricitinib treated mice (7.5 month-old). Scale bar, 10 µm. Quantifications indicate percentage of CAII+ cells also positive for STAT1. Statistical significance was determined for n = 5 animals using unpaired two-sided Student’s t-test (control, baricitinib, *p = 0.0296). Each point on the graph represents one animal. Data is presented as mean ± SEM. Source data
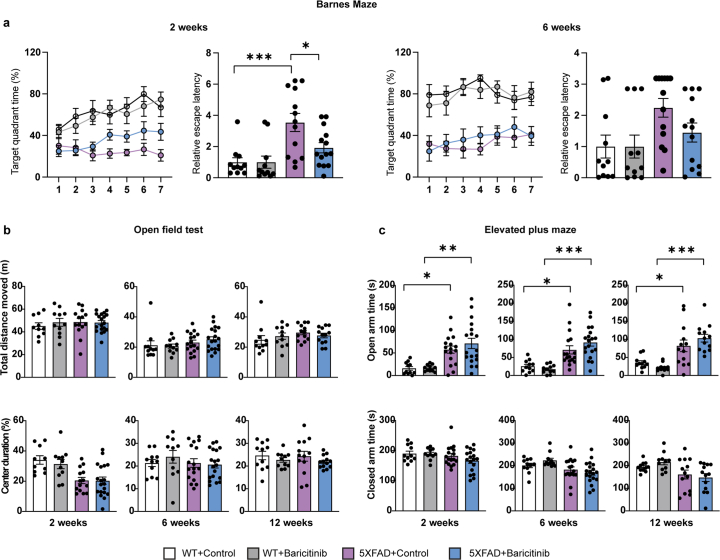
Behavior of 5xFAD mice in Barnes Maze following 2 weeks and 6 weeks of treatment with baricitinib. Quantification of the target quadrant time (%) on the platform during the training sessions and relative escape latency to the target hole in probe trial. Statistical significance was evaluated for n = 11–13 animals by one-way ANOVA followed by Tukey’s post hoc analysis using paired t-test (Relative escape latency, 2 weeks, WT control, 5xFAD control, ***p = 0.0007; Relative escape latency, 2 weeks, 5xFAD control, 5xFAD baricitinib, *p = 0.0321). b, Behavior of 5xFAD mice in an Open Field test following 2 weeks, 6 weeks and 12 weeks of treatment with baricitinib. Quantification of distance travelled on the platform (upper panel) and the percentage of time spent in center (lower panel). Statistical significance was evaluated for n = 11–13 animals by one-way ANOVA followed by Tukey’s post hoc analysis using paired t-test. c, Behavior of 5xFAD mice in an Elevated Plus Maze test following 2 weeks, 6 weeks and 12 weeks of treatment with baricitinib. Quantification of time spent in open arms (upper panel) and the time spent in close arms (lower panel). Statistical significance was evaluated for n = 11–13 animals by one-way ANOVA followed by Tukey’s post hoc analysis (2 weeks, WT control, 5xFAD control, *p = 0.0115; 2 weeks, WT baricitinib, 5xFAD baricitinib, **0.0004; 6 weeks, WT Control, 5xFAD Control, *p = 0.0125; 6 weeks, WT baricitinib, 5xFAD baricitinib, ***p = 0.00001283; 12 weeks, WT Control, 5xFAD Control, *p = 0.02; 12 weeks, WT baricitinib, 5xFAD baricitinib, ***p = 0.00002062). Each point on the graph represents one animal. Data is presented as mean ± SEM. Source data
References
MeSH terms
Grants and funding
LinkOut - more resources
Full Text Sources
Medical
Molecular Biology Databases
Research Materials
