

Spot urinary sodium in CKD patients: correlation with 24h-excretion and evaluation of commonly used prediction equations
- PMID: 38937680
- PMCID: PMC11212440
- DOI: 10.1186/s12882-024-03639-2
Spot urinary sodium in CKD patients: correlation with 24h-excretion and evaluation of commonly used prediction equations
Abstract
Background: Salt intake in CKD patients can affect cardiovascular risk and kidney disease progression. Twenty-four hour (24h) urine collections are often used to investigate salt metabolism but are cumbersome to perform. We assessed urinary sodium (U-Na) concentration in spot urine samples and investigated the correlation with 24h U-Na excretion and concentration in CKD patients under nephrological care. Further, we studied the role of CKD stage and diuretics and evaluated the performance of commonly used formulas for the prediction of 24h U-Na excretion from spot urine samples.
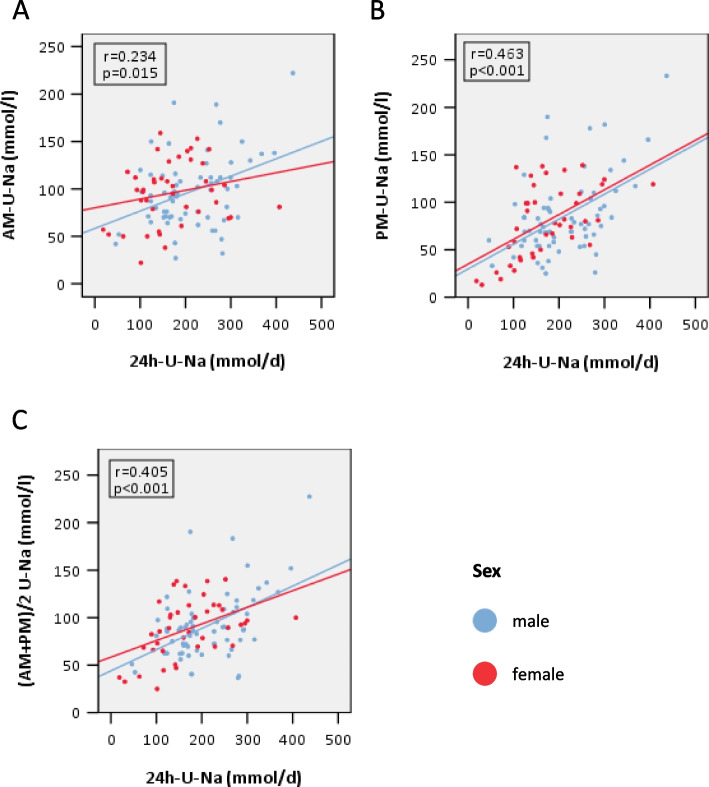
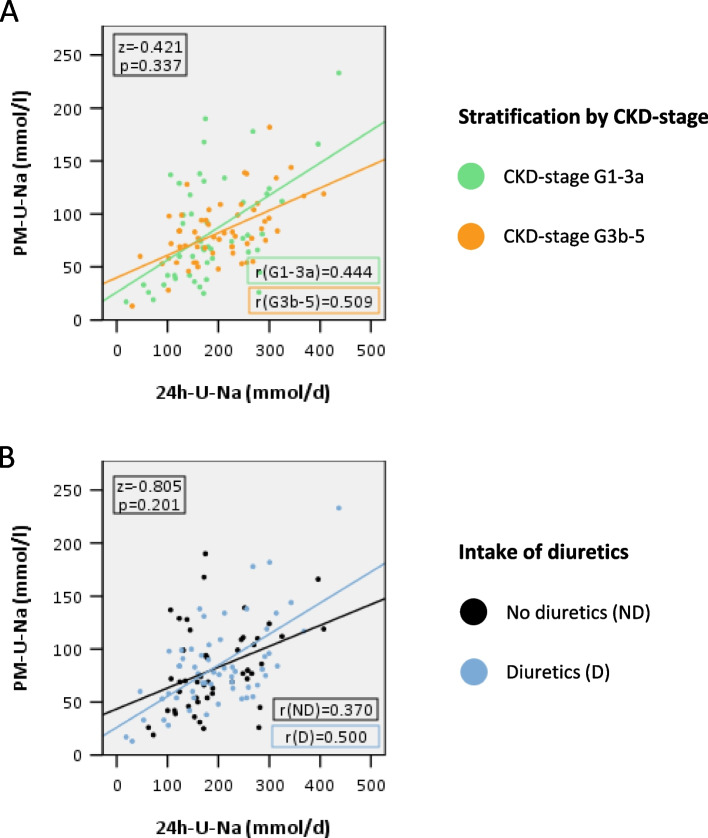
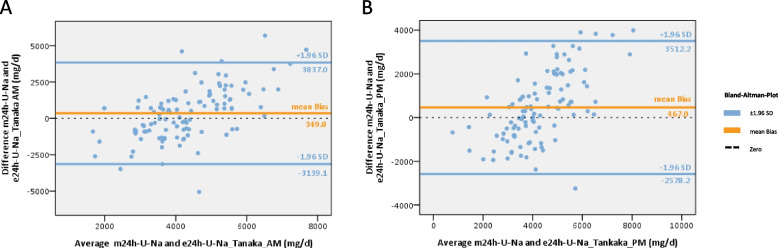
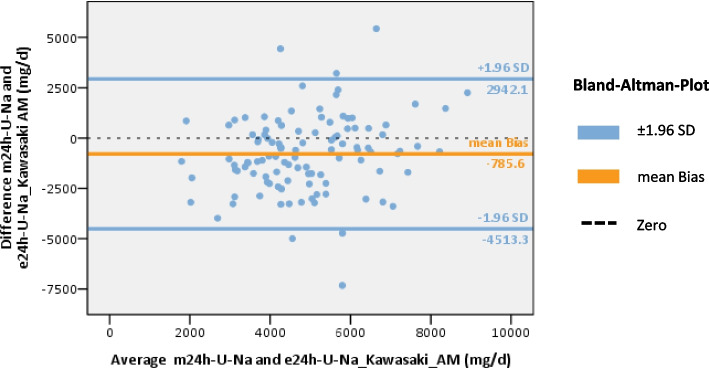
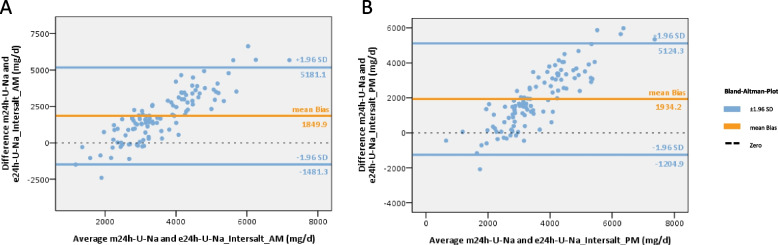
Methods: One hundred eight patients of the German Chronic Kidney Disease (GCKD) study were included. Each participant collected a 24h urine and two spot urine samples within the same period. The first spot urine sample (AM) was part of the second morning urine. The second urine sample was collected before dinner (PM). Patients were advised to take their medication as usual without changing dietary habits. U-Na concentrations in the two spot urine samples and their average ((AM + PM)/2) were correlated with U-Na concentration and total Na excretion in the 24h urine collections. Correlations were subsequently studied after stratification by CKD stage and diuretic intake. The usefulness of three commonly applied equations to estimate 24h U-Na excretion from spot urine samples (Kawasaki, Tanaka and Intersalt) was determined using Bland-Altman plots, analyses of sensitivity, specificity, as well as positive (PPV) and negative predictive values (NPV).
Results: Participants (42 women, 66 men) were on average (± SD) 62.2 (± 11.9) years old, with a mean serum creatinine of 1.6 (± 0.5) mg/dl. 95% had arterial hypertension, 37% diabetes mellitus and 55% were on diuretics. The best correlation with 24h U-Na total excretion was found for the PM spot U-Na sample. We also found strong correlations when comparing spot and 24h urine U-Na concentration. Correction of spot U-Na for U-creatinine did not improve strength of correlations. Neither CKD stage, nor intake of diuretics had significant impact on these correlations. All examined formulas revealed a significant mean bias. The lowest mean bias and the strongest correlation between estimated and measured U-Na excretion in 24h were obtained using the Tanaka-formula. Also, application of the Tanaka-formula with PM U-Na provided best sensitivity, specificity, PPV and NPV to estimate U-Na excretion > 4g/d corresponding to a salt consumption > 10g/d.
Conclusion: U-Na concentration of spot urine samples correlated with 24h U-Na excretion especially when PM spot U-Na was used. However, correlation coefficients were relatively low. Neither CKD stage nor intake of diuretics appeared to have an influence on these correlations. There was a significant bias for all tested formulas with the Tanaka-formula providing the strongest correlation with measured 24h U-Na excretion. In summary, using spot urine samples together with the Tanaka-formula in epidemiological studies appears feasible to determine associations between approximate salt intake and outcomes in CKD patients. However, the usefulness of spot-urine samples to guide and monitor salt consumption in individual patients remains limited.
Keywords: 24h urine collection; Chronic kidney disease; Diuretics; Electrolytes; Salt; Sodium; Spot urine.
© 2024. The Author(s).
Conflict of interest statement
The authors declare that they have no competing interests.
Figures
Similar articles
-
Spot urine sodium measurements do not accurately estimate dietary sodium intake in chronic kidney disease.Am J Clin Nutr. 2016 Aug;104(2):298-305. doi: 10.3945/ajcn.115.127423. Epub 2016 Jun 29. Am J Clin Nutr. 2016. PMID: 27357090 Free PMC article. Clinical Trial.
-
Validation and Assessment of Three Methods to Estimate 24-h Urinary Sodium Excretion from Spot Urine Samples in High-Risk Elder Patients of Stroke from the Rural Areas of Shaanxi Province.Int J Environ Res Public Health. 2017 Oct 11;14(10):1211. doi: 10.3390/ijerph14101211. Int J Environ Res Public Health. 2017. PMID: 29019912 Free PMC article. Clinical Trial.
-
Correcting for Intra-Individual Variability in Sodium Excretion in Spot Urine Samples Does Not Improve the Ability to Predict 24 h Urinary Sodium Excretion.Nutrients. 2020 Jul 8;12(7):2026. doi: 10.3390/nu12072026. Nutrients. 2020. PMID: 32650384 Free PMC article.
-
Evaluation of three prediction formulas of 24-hour urinary sodium excretion in Chinese residents: a systematic review and meta-analysis.Public Health Nutr. 2024 Feb 2;27(1):e71. doi: 10.1017/S1368980024000168. Public Health Nutr. 2024. PMID: 38305112 Free PMC article.
-
Change in mean salt intake over time using 24-h urine versus overnight and spot urine samples: a systematic review and meta-analysis.Nutr J. 2020 Dec 6;19(1):136. doi: 10.1186/s12937-020-00651-8. Nutr J. 2020. PMID: 33280602 Free PMC article.
References
MeSH terms
Substances
LinkOut - more resources
Full Text Sources
Medical
