. 2024 Aug 7;32(8):2692-2710.
doi: 10.1016/j.ymthe.2024.06.033. Epub 2024 Jun 26.

An aptamer-mediated base editing platform for simultaneous knockin and multiple gene knockout for allogeneic CAR-T cells generation

Affiliations

An aptamer-mediated base editing platform for simultaneous knockin and multiple gene knockout for allogeneic CAR-T cells generation

Immacolata Porreca et al. Mol Ther. .

Abstract

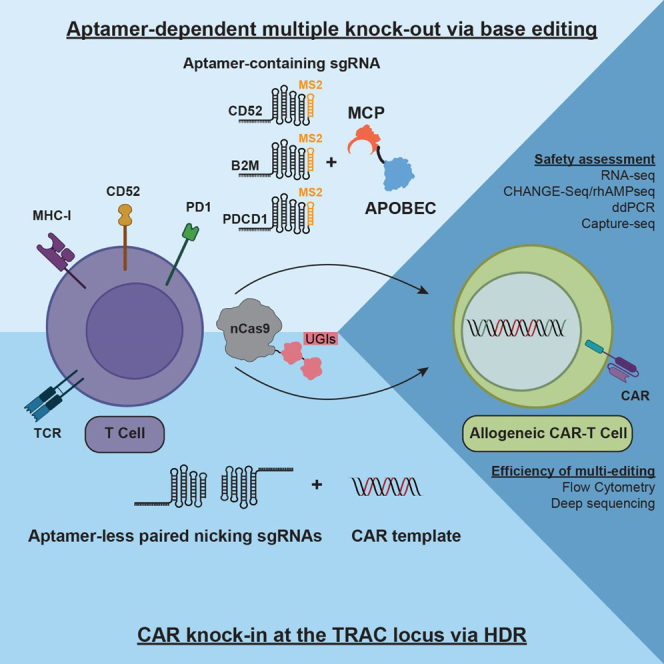
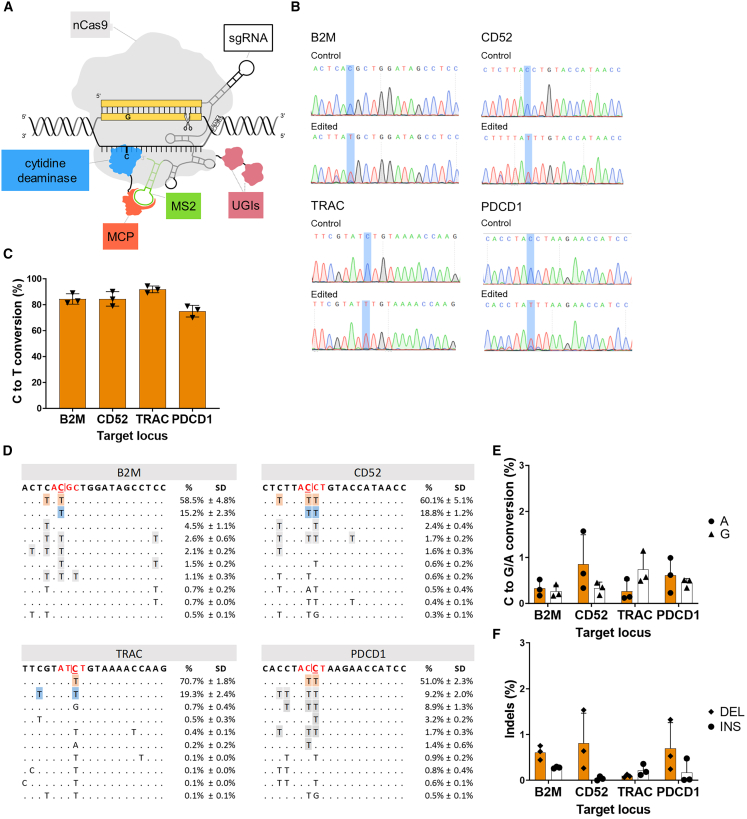
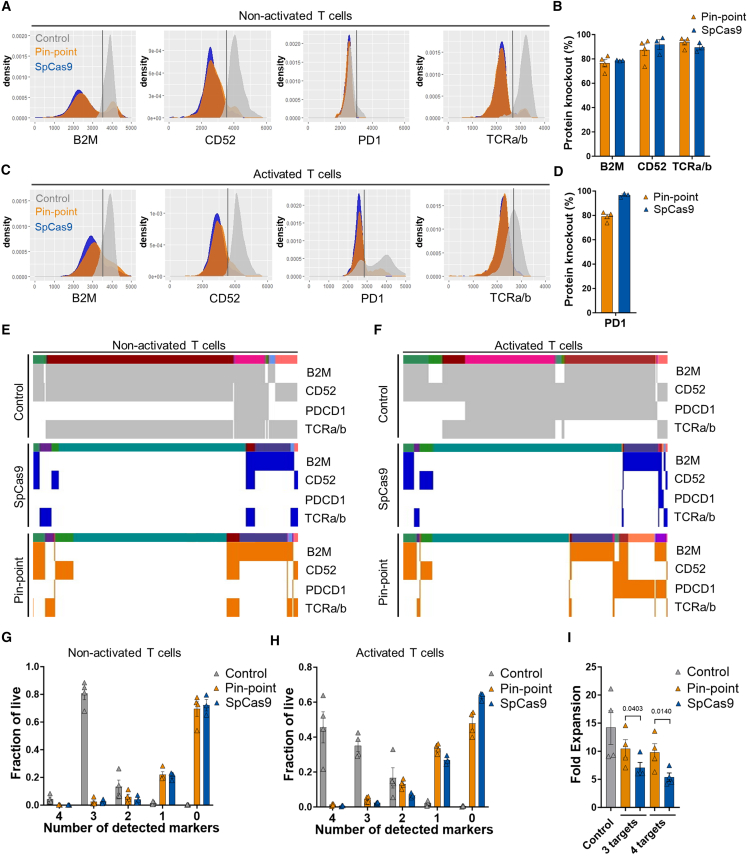
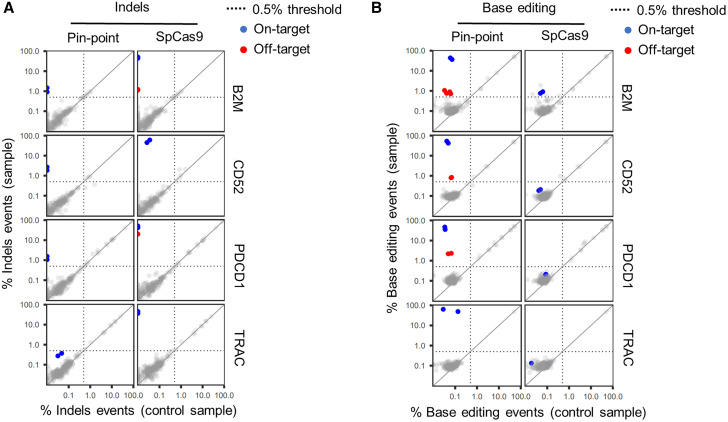
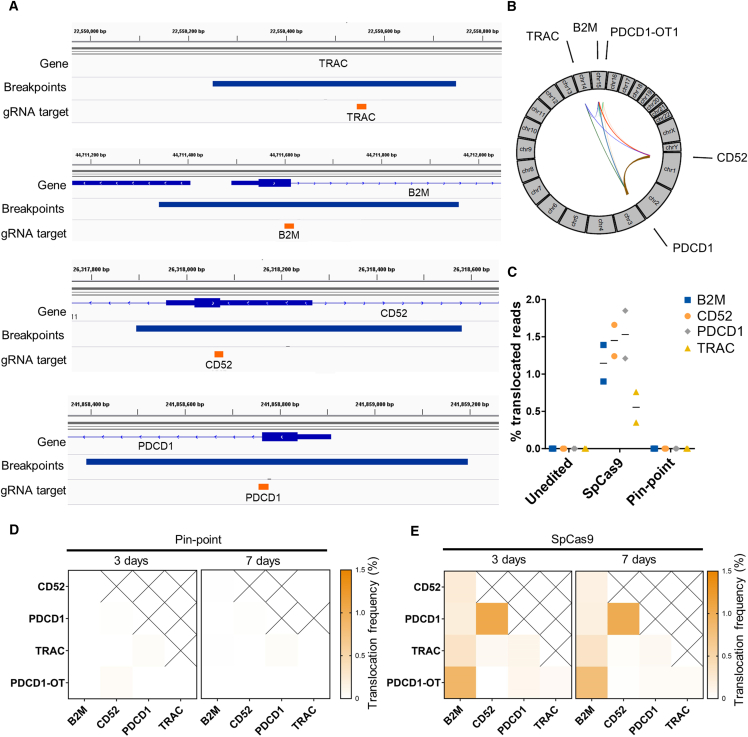
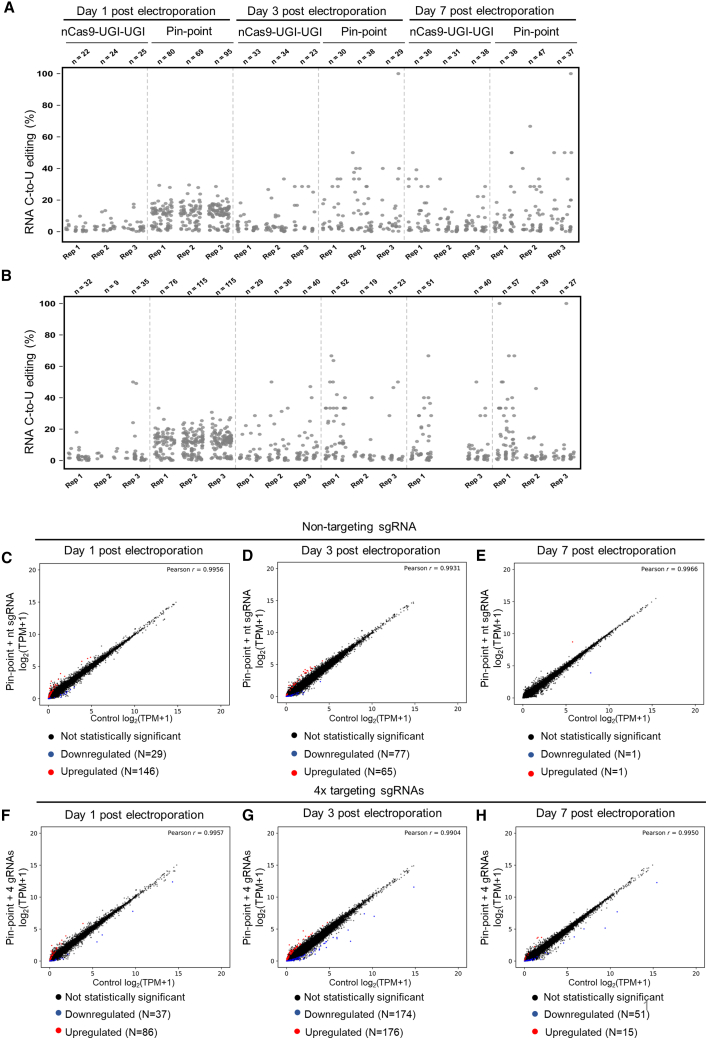
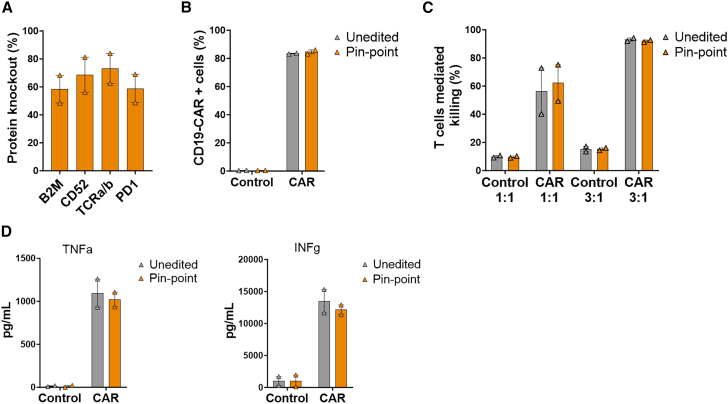
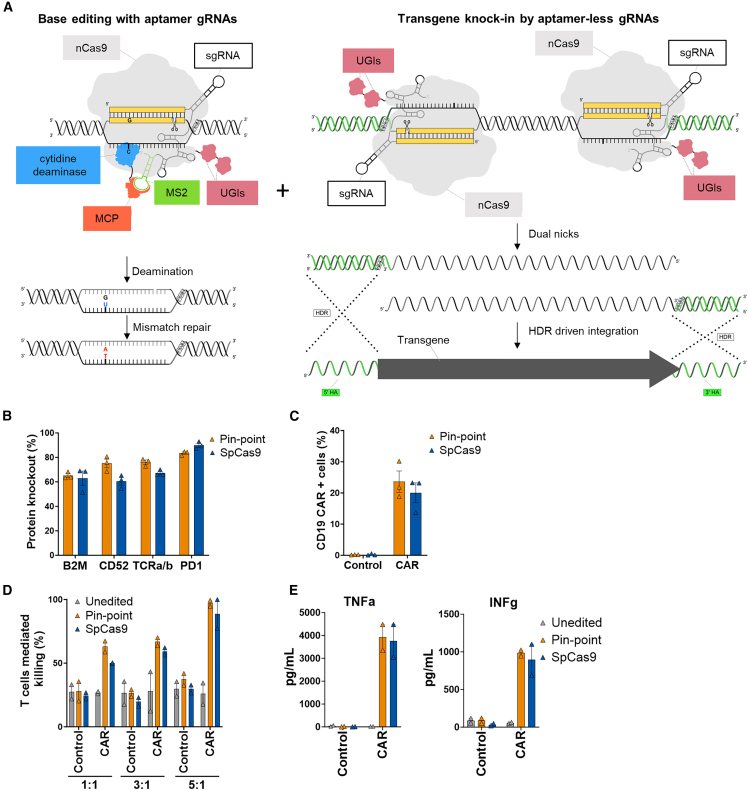
Gene editing technologies hold promise for enabling the next generation of adoptive cellular therapies. In conventional gene editing platforms that rely on nuclease activity, such as clustered regularly interspaced short palindromic repeats CRISPR-associated protein 9 (CRISPR-Cas9), allow efficient introduction of genetic modifications; however, these modifications occur via the generation of DNA double-strand breaks (DSBs) and can lead to unwanted genomic alterations and genotoxicity. Here, we apply a novel modular RNA aptamer-mediated Pin-point base editing platform to simultaneously introduce multiple gene knockouts and site-specific integration of a transgene in human primary T cells. We demonstrate high editing efficiency and purity at all target sites and significantly reduced frequency of chromosomal translocations compared with the conventional CRISPR-Cas9 system. Site-specific knockin of a chimeric antigen receptor and multiplex gene knockout are achieved within a single intervention and without the requirement for additional sequence-targeting components. The ability to perform complex genome editing efficiently and precisely highlights the potential of the Pin-point platform for application in a range of advanced cell therapies.

Keywords: CRISPR; advanced genome editing; allogeneic cell therapy; base editing; gene editing; knockin; knockout; multiple base editing; multiple gene knockout; transgene integration.


Conflict of interest statement

Declaration of interests M. Francescatto, M. Firth, J.L.T., D.P., J. Sumner, and B.T. are all current or past (while engaged in the research project) employees of AstraZeneca. I.P., R.B., J.H., B.J., O.M., J. Stombaugh, K.H., T.S., Z.S., C.W., A.v.B.S., and J.J.L. are current or past (while engaged in the research project) employees at Revvity. Revvity has an exclusive license from Rutgers University to certain base editing patents. Rutgers University and Horizon Discovery Limited have filed patent applications on this work.

Figures

None
Graphical abstract
Figure 1
Figure 1
The Pin-point platform is a highly efficient technology for multiplex editing in T cells (A) Schematic of the configuration of the Pin-point base editing technology used in this manuscript. An SpCas9 nickase (nCas9-UGI-UGI) binds to the gRNA, the recruiting RNA aptamer (MS2) fused to the gRNA recruits the effector module. The effector module is composed of a cytidine deaminase (rAPOBEC1) fused to the aptamer binding protein (MCP). The recruitment of the deaminase to the target site forms an active complex capable of editing target cytosine residues on the unpaired DNA strand within the CRISPR R-loop. (B) Representative electropherograms from edited and control samples for the four targets following co-delivery of Pin-point mRNAs and four target sgRNAs as analyzed by Sanger sequencing 7 days post electroporation. The target C is highlighted by blue shading. (C) Levels of C to T conversion of the target C at B2M, CD52, TRAC, and PDCD1 loci following co-delivery of Pin-point mRNAs and four target sgRNAs, as analyzed by NGS 7 days post electroporation. Data represented as mean (SEM), n = 3 independent biological T cell donors. (D) Alignment plots showing the top 10 most abundant reads for each of the four targets. The target C is shown in red and underlined. The target splice site is shown in red. (E) Levels of C to G or A conversion of the target C at B2M, CD52, TRAC, and PDCD1 loci following co-delivery of Pin-point mRNAs and four target sgRNAs, as analyzed by NGS. (F) Insertion (INS) and deletion (DEL) frequency at the target C at B2M, CD52, TRAC, and PDCD1 loci following co-delivery of Pin-point mRNAs and four target sgRNAs, as analyzed by NGS. In (E) and (F), data represented as mean (SEM), n = 3 independent biological T cell donors.
Figure 2
Figure 2
Quantification of T cell target knockout in individual cells (A–C) Flow cytometry histograms to show protein levels for CD52, TCRa/b, PD1, and B2M following co-delivery of Pin-point or SpCas9 mRNAs and their compatible four target sgRNAs in (A) non-activated and (C) activated T cells, analyzed 7 days post electroporation. Non-edited mock electroporated cells are used as control. In this comparison, optimal gRNAs for SpCas9 have been used and these differ in their spacer sequence from the optimal Pin-point gRNAs (further details in the materials and methods). Quantification of protein knockout reported as the percentage of (B) non-activated and (D) activated T cells expressing undetectable levels of the protein, normalized to the frequency of expression in mock electroporated cells. Data in (B) and (D) represented as mean (SEM), n = 4 independent biological T cell donors. Protein expression phenotypes within populations of (E) non-activated and (F) activated T cells either mock electroporated as controls or edited with either SpCas9 or the Pin-point platform. Columns are single cells classified as positive (colored) or negative (white) for the four target proteins with respect to the gates shown in (A) and (C). Color bar shows clusters of cells with similar patterns of expression of the protein targets (rows). k-means clustering, k = 16. Quantification of single, double, triple, and quadruple negative target protein expression in (G) non-activated and (H) activated T cells following co-delivery of Pin-point or SpCas9 mRNAs and four target gRNAs, analyzed by flow cytometry 7 days post electroporation. Control is mock electroporated T cells without RNA. Single cells are classified as either positive or negative for the four target proteins according to the gates shown in Figure S2. Data in (G) and (H) represented as mean (SEM), n = 4 independent biological T cell donors. (I) Fold expansion of T cells as measured by cell counts 3 days post co-delivery of Pin-point or SpCas9 mRNAs and three or four target gRNAs. Data represented as mean (SEM), n = 4 independent biological T cell donors. A paired student t-test was applied.
Figure 3
Figure 3
Assessment of DNA off-target editing (A and B) On-/off-target activity of sgRNAs targeting B2M, PDCD1, TRAC, or CD52 genes, determined by rhAmpSeq NGS profiling of on-target, 100 nominated off-target sites, and of all the candidates having up to four mismatches to the target site per sgRNA identified by CHANGE-seq. The on-/off-target activity of each sgRNA was profiled in human T cells edited with either the Pin-point base editor or SpCas9 5 days post electroporation and the percent editing (% base editing events in A or % indels events in B) determined in each case. Each dot depicts the maximal percentage editing at a given site in one human donor for control (mock electroporation, x axis) versus edit (edited sample, y axis) with an average coverage per panel of >35,000 reads. Top left quadrant indicates events with more than 0.5% editing in edited samples and less than 0.5% editing in control sample. Blue dots highlight on-target editing, red dots highlight validated off-target activity occurring in at least 0.5% of corrected reads (dotted lines) and in both human donors profiled. Shown on base 10 logarithmic scale.
Figure 4
Figure 4
Assessment of translocations following multi-gene editing (A) gRNA binding sites (orange) and genomic regions spanning the locations of SpCas9-induced translocation breakpoints identified by the DRAGEN Structural Variant (SV) Caller (blue bars) at each target gene locus. Genomic regions include confidence intervals around each breakpoint. (B) Circos plot of interchromosomal translocations involving gRNA target sites identified by MANTA in the SpCas9 multi-edited samples. Thickness of lines joining genomic loci is proportional to the translocation frequency. (C) Percentage of Capture-seq reads marked as translocations mapping to each sgRNA target site. (D and E) Average frequencies of the two outcomes of each predicted reciprocal translocation quantified by ddPCR 3 or 7 days post editing with either (D) the Pin-point platform or (E) SpCas9. For (B)–(E) mRNAs encoding either the Pin-point platform or SpCas9 were delivered with four targeting sgRNAs. Control is mock electroporated T cells without RNA. Samples were analyzed 3 days post electroporation unless specified otherwise. n = 2 independent T cell donors.
Figure 5
Figure 5
Effect of the Pin-point platform on RNA editing and transcription (A and B) RNA C to U editing assessed by transcriptome sequencing in primary human T cells that were electroporated with Pin-point (nCas9-UGI-UGI and rAPOBEC1-MCP) or nCas9-UGI-UGI only mRNAs and the four targeting sgRNAs against B2M, CD52, TRAC, and PDCD1 genes (A) or a scrambled non-targeting sgRNA (B). Each dot represents one editing event. The total number of editing events is indicated above each replicate per condition. (C–H) Scatterplots of gene expression levels (log2 transformed TPM +1, TPM with a pseudocount of one added before log transformation) in primary human T cells electroporated with Pin-point mRNAs and either a scramble non-targeting sgRNA (C, D, and E) or the four targeting sgRNAs (TRAC, B2M, CD52, PDCD1) (F, G, and H) compared with control cells that received the pulse electroporation only (x axis). DESeq2 analysis was performed on total mRNA collected at days 1 (C and F), 3 (D and G), and 7 (E and H) post electroporation and was used to identify upregulated and downregulated genes. Upregulated or downregulated genes (p < 0.05) with absolute log2 fold change ≥1.5 in gene expression (represented as log2 transformed TPM +1) marked red and blue, respectively. r indicates the Pearson correlation coefficient, calculated for log-transformed values on all genes.
Figure 6
Figure 6
Generation of allogeneic CAR-T cells by multi-gene editing with the Pin-point platform and lentiviral delivery of the CAR CAR-T cells were generated by lentivirus delivery of the CD19-CAR and subsequently edited by the Pin-point base editor. (A) Frequency of CD19-CAR-positive cells in the transduced T cell population after delivery of Pin-point reagents and in unedited cells. Control cells are T cells that have been mock transduced. (B) Frequency of CD52, TCRa/b, PD1, and B2M protein knockout following co-delivery of Pin-point mRNAs and four target sgRNAs, as analyzed by flow cytometry 7 days post electroporation in CAR-T cells. (C) Raji cells killing measured by flow cytometry after co-culture with CAR-T cells unedited or multi-edited with the Pin-point platform at 1:1 or 3:1 T cell:target cell ratios. Control cells are T cells that have been mock transduced. (D) Levels of TNF alpha and INF gamma measured in the media of the co-culture at the 1:1 T cell:target cell ratio. Data represented as mean (SEM), n = 2 independent biological T cell donors.
Figure 7
Figure 7
Generation of multiplex edited CAR-T cells by simultaneous multiplex base editing knockout and locus-specific knockin with the Pin-point system (A) Schematic showing the recruitment of the entire Pin-point platform machinery by aptamer-containing gRNAs on the site where the desired outcome is base editing (left) and of the nCas9 alone by aptamer-less gRNAs on the knockin site (right). CAR-T cells were generated by knockin of the CD19-CAR in the TRAC locus. Pin-point mRNAs have been co-delivered with aptamer-containing sgRNAs directed to base edit B2M, CD52, and PDCD1 and 2 aptamer-less sgRNAs designed to target the exon1 of TRAC locus. Cells electroporated with SpCas9 mRNA received optimal gRNAs to knock out B2M, CD52, and PDCD1 by indel formation and one of the two gRNA designed to target the exon 1 of TRAC locus. Shortly after electroporation, cells were transduced with AAV6 carrying the CD19-CAR transgene flanked by the homology arms to the TRAC locus. (B) Frequency of CD52, TCRa/b, PD1, and B2M protein knockout following co-delivery of Pin-point or SpCas9 reagents and transduction with the AAV6-CAR as analyzed by flow cytometry 7 days post electroporation/transduction. (C) Frequency of CD19-CAR-positive cells in the T cell population after delivery of either Pin-point or SpCas9 reagents and transduction with the AAV6-CAR compared with non-transduced cells. (D) Raji cell killing measured by calcein assay after co-culture with T cells unedited or multi-edited with the Pin-point platform or with SpCas9 and transduced with AAV6-CAR compared with non-transduced cells at 1:1, 3:1, or 5:1 T cell:target cell ratios. Control cells are non-transduced cells. (E) Levels of TNF alpha and INF gamma measured in the media of the co-culture at the 1:1 T cell:target cell ratio. Data represented as mean ± SD, n = 2 independent biological T cell donors.

References

    1. Stadtmauer E.A., Fraietta J.A., Davis M.M., Cohen A.D., Weber K.L., Lancaster E., Mangan P.A., Kulikovskaya I., Gupta M., Chen F., et al. CRISPR-engineered T cells in patients with refractory cancer. Science. 2020;367 doi: 10.1126/science.aba7365. - DOI - PMC - PubMed
    1. Ottaviano G., Georgiadis C., Gkazi S.A., Syed F., Zhan H., Etuk A., Preece R., Chu J., Kubat A., Adams S., et al. Phase 1 clinical trial of CRISPR-engineered CAR19 universal T cells for treatment of children with refractory B cell leukemia. Sci. Transl. Med. 2022;14 doi: 10.1126/scitranslmed.abq3010. - DOI - PubMed
    1. Benjamin R., Graham C., Yallop D., Jozwik A., Mirci-Danicar O.C., Lucchini G., Pinner D., Jain N., Kantarjian H., Boissel N., et al. Genome-edited, donor-derived allogeneic anti-CD19 chimeric antigen receptor T cells in paediatric and adult B-cell acute lymphoblastic leukaemia: results of two phase 1 studies. The Lancet. 2020;396:1885–1894. doi: 10.1016/S0140-6736(20)32334-5. - DOI - PMC - PubMed
    1. Dimitri A., Herbst F., Fraietta J.A. Engineering the next-generation of CAR T-cells with CRISPR-Cas9 gene editing. Mol. Cancer. 2022;21:78. doi: 10.1186/s12943-022-01559-z. - DOI - PMC - PubMed
    1. Papathanasiou S., Markoulaki S., Blaine L.J., Leibowitz M.L., Zhang C.-Z., Jaenisch R., Pellman D. Whole chromosome loss and genomic instability in mouse embryos after CRISPR-Cas9 genome editing. Nat. Commun. 2021;12:5855. doi: 10.1038/s41467-021-26097-y. - DOI - PMC - PubMed

MeSH terms

Substances

LinkOut - more resources