. 2024 Sep;11(33):e2400058.
doi: 10.1002/advs.202400058. Epub 2024 Jun 27.

Breed-Driven Microbiome Heterogeneity Regulates Intestinal Stem Cell Proliferation via Lactobacillus-Lactate-GPR81 Signaling

Affiliations

Breed-Driven Microbiome Heterogeneity Regulates Intestinal Stem Cell Proliferation via Lactobacillus-Lactate-GPR81 Signaling

Haiqin Wu et al. Adv Sci (Weinh). 2024 Sep.

Abstract

Genetically lean and obese individuals have distinct intestinal microbiota and function. However, the underlying mechanisms of the microbiome heterogeneity and its regulation on epithelial function such as intestinal stem cell (ISC) fate remain unclear. Employing pigs of genetically distinct breeds (obese Meishan and lean Yorkshire), this study reveals transcriptome-wide variations in microbial ecology of the jejunum, characterized by enrichment of active Lactobacillus species, notably the predominant Lactobacillus amylovorus (L. amylovorus), and lactate metabolism network in obese breeds. The L. amylovorus-dominant heterogeneity is paralleled with epithelial functionality difference as reflected by highly expressed GPR81, more proliferative ISCs and activated Wnt/β-catenin signaling. Experiments using in-house developed porcine jejunal organoids prove that live L. amylovorus and its metabolite lactate promote intestinal organoid growth. Mechanistically, L. amylovorus and lactate activate Wnt/β-catenin signaling in a GPR81-dependent manner to promote ISC-mediated epithelial proliferation. However, heat-killed L. amylovorus fail to cause these changes. These findings uncover a previously underrepresented role of L. amylovorus in regulating jejunal stem cells via Lactobacillus-lactate-GPR81 axis, a key mechanism bridging breed-driven intestinal microbiome heterogeneity with ISC fate. Thus, results from this study provide new insights into the role of gut microbiome and stem cell interactions in maintaining intestinal homeostasis.

Keywords: intestinal stem cell; lactobacillus; microbiome; small intestine; wnt/β‐catenin signaling.


Conflict of interest statement

The authors declare no conflict of interests.

Figures
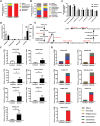
Figure 1
Figure 1
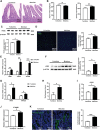
Microbial composition, metabolites and metabolic pathways for microbial lactate production in the jejunum in Meishan and Yorkshire pigs. A) Relative abundance of bacteria at phylum level in the jejunal digesta (n = 6). B) The relative abundance of microbial genus‐level in the jejunal digesta (n = 6). C) Quantitative real‐time PCR measurement of dominant Lactobacillus quantities in the jejunal digesta. (Graphs represent mean ± SEM, n = 6). D) SCFAs and lactate concentrations in jejunal digesta (Graphs represent mean ± SEM, n = 6). E) Schematic presentation of metabolic pathways for microbial lactate production from carbohydrates. Significantly different genes encoding enzymes involved in lactate production are shown in red (increased in the Meishan group). F) Expression of genes involved in lactate production (Graphs represent mean ± SEM, n = 4). G) Phylogenetic distribution of sequences in lactate producing genes assigned to the identified genus. Only genera with functional gene abundance of more than 1 TPM in least one group are presented (n = 4). Mann‐Whitney U test was performed between two groups while asterisks mean statistically significant difference: *P ≤ 0.05, **P ≤ 0.01.
Figure 2
Figure 2
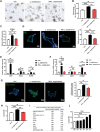
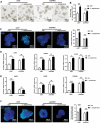
Histology, proliferative cells and aISC expression, Wnt/β‐catenin signaling in the jejunum of Meishan and Yorkshire pigs. A) Representative histological micrographs. Scale bar = 100 µm. B) Quantitative analysis of jejunal villus height and crypt depth (n = 6). C) Western blot analysis of PCNA protein expression in jejunum samples (n = 3). Up panel: representative blot. Down panel: data quantification. D) Immunofluorescent imaging of PCNA stained jejunal sections (n = 6). Left: representative images (green: PCNA, blue: DNA, scale bar = 200 µm). Right: Quantification percentage of PCNA positive cells. E) Relative mRNA expression of aISC marker genes: LGR5, ASCL2 and OLFM4 (n = 6). F) Western blot analysis of LGR5 protein expression in jejunal samples (n = 3). Left panel: representative blot. Right panel: Quantification of LGR5 expression. G) Jejunal WNT3 and WNT2B mRNA expression (n = 6). H) Quantification of WNT3A protein abundance in jejunal tissue homogenates from the homogenized jejunum (n = 6). I) Relative expression of AXIN2 mRNA (n = 6). J) Relative expression of CTNNB1 mRNA (n = 6). K) Immunofluorescent imaging of active β‐catenin stained jejunal sections (n = 6). Left panel: representative images (green: active β‐catenin, blue: DNA). Right panel: Quantification of β‐catenin mean fluorescence intensity. Graphs represent mean ± SEM. The Student's t‐test was performed between two groups while asterisks mean statistically significant difference: *P ≤ 0.05, **P ≤ 0.01, ***P ≤ 0.001, P > 0.05 no significance (ns).
Figure 3
Figure 3
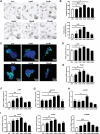
Effect of L. amylovorus and HK‐L. amylovorus on porcine jejunal organoid proliferation and Wnt/β‐catenin signaling. A) 106 CFU L. amylovorus and HK‐L. amylovorus was used respectively, to treat organoids for 48 h. Organoids morphology was assessed by light microscopy (Scale bar = 200 µm). B) Quantification of organoid area (n = 4 wells per group), 15 organoids per well). C) Relative mRNA expression of PCNA (n = 4 wells per group). D) Immunofluorescent imaging of PCNA stained porcine jejunal organoids (n = 4 wells per group). Left: representative images (green: PCNA, blue: DNA, scale bar = 50 µm). Right: Quantification percentage of PCNA positive cells (15 organoids per well). E) Relative mRNA expression of LGR5, ASCL2 and OLFM4 in jejunal organoids (n = 4 wells per group). F) Relative mRNA expression of Wnt/β‐catenin signaling related genes WNT3, AXIN2 and CTNNB1 in organoids (n = 4 wells per group). G) Immunofluorescent imaging of Active‐β‐catenin stained porcine jejunal organoids (n = 4 wells per group). Left: representative images (green: Active‐β‐catenin, blue: DNA, scale bar = 100 µm). Right: Quantification active‐β‐catenin mean fluorescence intensity. H) Lactate concentration in culture medium following 106 CFU L. amylovorus treatment of intestinal organoids (n = 4 wells per group). I) Correlation analysis between proliferation levels and Wnt/β‐catenin signaling pathway in organoids with lactate concentration in culture medium supernatant. J) Lactate concentration in culture medium following different doses of L. amylovorus treatment of intestinal organoids (n = 4 wells per group). Graphs represent mean ± SEM. The one‐way ANOVA and multiple comparisons in Fisher's LSD test were performed while asterisks mean statistically significant difference: *P ≤ 0.05, **P ≤ 0.01, ***P ≤ 0.001, P > 0.05 no significance (ns).
Figure 4
Figure 4
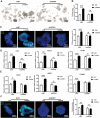
Dose dependent effect of lactate on porcine jejunal organoid proliferation and Wnt/β‐catenin signaling‐related genes. A) 1, 2, 5, 10, and 20 mM of lactate were used to treat organoids for 48 h (n = 5 wells per group). Organoid morphology was assessed by light microscopy (Scale bar = 200 µm). B) Quantification of the budding efficiency and the organoid area (n = 5 wells per group). C) Representative images of immunofluorescent imaging of PCNA stained jejunal organoids (green: PCNA, blue: DNA, scale bar = 100 µm, n = 5 wells per group). D) Quantification of PCNA positive‐cells percentage (n = 5 wells per group). E) Relative mRNA abundance of PCNA in organoids. F–H) Relative mRNA expression of aISC markers including LGR5, ASCL2, and OLFM4 in jejunal organoids (n = 5 wells per group). I) Relative mRNA expression of Wnt/β‐catenin signaling‐related genes WNT3, AXIN2, and CTNNB1 in organoids (n = 5 wells per group). Graphs represent mean ± SEM. The one‐way ANOVA and multiple comparisons in Fisher's LSD test were performed while asterisks mean statistically significant difference: *P ≤ 0.05, **P ≤ 0.01, ***P ≤ 0.001.
Figure 5
Figure 5
GPR81 mediates lactate‐induced ISC proliferation and Wnt/β‐catenin signaling. A) 5 mM lactate was used to treat intestinal organoids with (shGRP81) or without GPR81 (shNT) knockdown for 48 h. Organoid morphology was assessed by light microscopy (Scale bar = 200 µm). B) Quantification of organoid area (n = 5 wells per group, 15 organoids per well). C) Immunofluorescent imaging of PCNA stained porcine jejunal organoids. Left: representative images (green: PCNA, blue: DNA, scale bar = 100 µm, n = 5 wells per group). Right: Quantification percentage of PCNA‐positive cells (15 organoids per well). D) Relative mRNA expression of LGR5, ASCL2, OLFM4 in jejunal organoids. E) Relative mRNA expression of Wnt/β‐catenin signaling related genes WNT3, AXIN2 and CTNNB1 in organoids (n = 5 wells per group). F) Immunofluorescent imaging of Active‐β‐catenin stained porcine jejunal organoids. Left: representative images (green: Active‐β‐catenin, blue: DNA, scale bar = 100 µm, n = 5 well per group). Right: Quantification active‐β‐catenin mean fluorescence intensity. Graphs represent mean ± SEM. The Student's t‐test was performed between two groups while asterisks mean statistically significant difference: *P ≤ 0.05, **P ≤ 0.01, ***P ≤ 0.001, P > 0.05 no significance (ns).
Figure 6
Figure 6
Inhibiting effects of knockdown GPR81 on the proliferation of porcine intestinal organoids and activation of Wnt/β‐catenin signaling promoted by L. amylovorus. A) 106 CFU L. amylovorus was used to treat intestinal organoids with (shGRP81) or without (shNT) GPR81 knockdown for 48 h. Organoids morphology was assessed by light microscopy (Scale bar = 200 µm). B) Quantification of organoid area (n = 5 wells per group, 15 organoids per well). C) Immunofluorescent imaging of PCNA stained porcine jejunal organoids. Left: representative images (green: PCNA, blue: DNA, scale bar = 100 µm, n = 5 wells per group). Right: Quantification percentage of PCNA‐positive cells (15 organoids per well). D) Relative mRNA expression of LGR5, ASCL2, OLFM4 in jejunal organoids. E) Relative mRNA expression of Wnt/β‐catenin signaling related genes WNT3, AXIN2 and CTNNB1 in organoids (n = 5 wells per group). F) Immunofluorescent imaging of Active‐β‐catenin stained porcine jejunal organoids. Left: representative images (green: Active‐β‐catenin, blue: DNA, scale bar = 100 µm, n = 5 well per group). Right: Quantification active‐β‐catenin mean fluorescence intensity. Graphs represent mean ± SEM. The student's t‐test was performed between two groups while asterisks mean statistically significant difference: *P ≤ 0.05, **P ≤ 0.01, ***P ≤ 0.001,P > 0.05 no significance (ns).

References

    1. Wu H., Mu C., Xu L., Yu K., Shen L., Zhu W., Gut Microbes 2024, 16, 2353399. - PMC - PubMed
    1. Gehart H., Clevers H., Nat. Rev. Gastroenterol. Hepatol. 2019, 16, 19. - PubMed
    1. Fevr T., Robine S., Louvard D., Huelsken J., Mol. Cell. Biol. 2007, 27, 7551. - PMC - PubMed
    1. Wu H., Xie S., Miao J., Li Y., Wang Z., Wang M., Yu Q., Gut Microbes 2020, 11, 997. - PMC - PubMed
    1. Kim S., Shin Y. C., Kim T. Y., Kim Y., Lee Y. S., Lee S. H., Kim M. N., E. O., Kim K. S., Kweon M. N., Gut Microbes 2021, 13, 1. - PMC - PubMed

MeSH terms

LinkOut - more resources