. 2024 Jun 13:15:1384103.
doi: 10.3389/fendo.2024.1384103. eCollection 2024.

Genome-wide association study and polygenic score assessment of insulin resistance

Affiliations

Genome-wide association study and polygenic score assessment of insulin resistance

Usama Aliyu et al. Front Endocrinol (Lausanne). .

Abstract

Insulin resistance (IR) and beta cell dysfunction are the major drivers of type 2 diabetes (T2D). Genome-Wide Association Studies (GWAS) on IR have been predominantly conducted in European populations, while Middle Eastern populations remain largely underrepresented. We conducted a GWAS on the indices of IR (HOMA2-IR) and beta cell function (HOMA2-%B) in 6,217 non-diabetic individuals from the Qatar Biobank (QBB; Discovery cohort; n = 2170, Replication cohort; n = 4047) with and without body mass index (BMI) adjustment. We also developed polygenic scores (PGS) for HOMA2-IR and compared their performance with a previously derived PGS for HOMA-IR (PGS003470). We replicated 11 loci that have been previously associated with HOMA-IR and 24 loci that have been associated with HOMA-%B, at nominal statistical significance. We also identified a novel locus associated with beta cell function near VEGFC gene, tagged by rs61552983 (P = 4.38 × 10⁻⁸). Moreover, our best performing PGS (Q-PGS4; Adj R2 = 0.233 ± 0.014; P = 1.55 x 10⁻³) performed better than PGS003470 (Adj R2 = 0.194 ± 0.014; P = 5.45 x 10⁻²) in predicting HOMA2-IR in our dataset. This is the first GWAS on HOMA2 and the first GWAS conducted in the Middle East focusing on IR and beta cell function. Herein, we report a novel locus in VEGFC that is implicated in beta cell dysfunction. Inclusion of under-represented populations in GWAS has potentials to provide important insights into the genetic architecture of IR and beta cell function.

Keywords: GWAS; beta cell; insulin resistance; polygenic score; type 2 diabetes.


Conflict of interest statement

The authors declare that the research was conducted in the absence of any commercial or financial relationships that could be construed as a potential conflict of interest.

Figures

Figure 1
Figure 1
Study Design. This study was based on the Qatar Biobank (QBB) participants (n = 14,395). Subjects with diabetes and those without fasting measurements (n = 8,178) were removed. The GWAS cohort included only subjects without diabetes with fasting levels of glucose and C-peptide (n = 6,217). The phenotype (HOMA2-IR, HOMA2-%B, HOMA2-%S) values were calculated using HOMA2 calculator. Whole genome sequencing (WGS) data was provided by the Qatar Genome Program (QGP). The GWAS was conducted in discovery (n = 2,170) and replication (n = 4,047) using SAIGE and meta-analyzed using Plink in BMI adjusted and BMI-unadjusted models. Polygenic scores (PGS) were derived from discovery dataset and tested in the replication dataset.
Figure 2
Figure 2
Manhattan and Q-Q Plots for HOMA2-IR in Discovery GWAS. (A) Manhattan plot and (B) Quantile-Quantile (Q-Q) plot of discovery association results in the BMI-unadjusted model (Model A). (C) Manhattan plot and (D) Q-Q plot of discovery GWAS in BMI-adjusted model (Model B). Manhattan plots represent the -log10 P (significance) on y-axis for SNPs represented on the x-axis based on their chromosomal position. The blue horizontal line represents suggestive evidence of association (P < 5 × 10⁻⁵). The red horizontal line represents the genome-wide significance threshold (P < 5 × 10⁻⁸). Q-Q plots represent the quantile distribution of observed p-values versus the expected p-values for all SNPs.
Figure 3
Figure 3
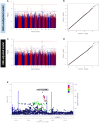
Manhattan and Q-Q Plots for HOMA2-%B in Discovery GWAS. (A) Manhattan plot and (B) Quantile-Quantile (Q-Q) plot of discovery association results in the BMI-unadjusted model (Model A). (C) Manhattan plot and (D) Q-Q plot of discovery GWAS in BMI-adjusted model (Model B). Manhattan plots represent the -log10 P (significance) on y-axis for SNPs represented on the x-axis based on their chromosomal position. The blue horizontal line represents suggestive evidence of association (P < 5 × 10⁻⁵). The red horizontal line represents the genome-wide significance threshold (P < 5 × 10⁻⁸). Q-Q plots represent the quantile distribution of observed p-values versus the expected p-values for all SNPs. (E) Regional association plot of the novel locus (tagged by rs61552983) associated with beta cell function (HOMA2-%B). SNPs are plotted with meta-analysis p-values (-log10) as a function of genomic position.
Figure 4
Figure 4
Comparison of allele frequencies and effect sizes (BETA) of HOMA2-%B-replicated loci identified in the GWAS catalog and QBB Cohort. (A, B) Correlation of effect sizes (beta) for replicated loci between QBB and GWAS catalog in (A) BMI-unadjusted (R2=0.92) and (B) BMI-adjusted (R2=0.85) models. (C, D) Correlation of the allele frequency of the lead SNPs in QBB within ±250 kb of previously reported SNPs in (C) BMI-unadjusted and (D) BMI-adjusted models between QBB and European (EUR), African (AFR), East Asian (EAS), South Asian (SAS) and Admixed American (AMR) ancestry subjects from the 1000 Genome project.
Figure 5
Figure 5
Predictive performance assessment of Q-PGS for insulin resistance. (A) Bar chart shows the adjusted R2 values of the 6 Q-PGS. Analyses were adjusted for age, sex, BMI and PCs1-10. (B) Quantile bar chart shows the mean HOMA2-IR values for each score bin for Q-PGS4; bins were divided into four equal groups of participants scores (n= ~1,102 in each quantile). Asterisk (*) represents statistically significant (P < 0.05). Error bars represent the standard error. Q-PGS, QBB-derived Polygenic Scores.

References

    1. Khan MAB, Hashim MJ, King JK, Govender RD, Mustafa H, Al Kaabi J. Epidemiology of type 2 diabetes - global burden of disease and forecasted trends. J Epidemiol Global Health. (2020) 10:107–11. doi: 10.2991/jegh.k.191028.001 - DOI - PMC - PubMed
    1. Federation ID. IDF diabetes atlas ninth. (2019) 9(1):5–9. Dunia: Idf.
    1. Safiri S, Karamzad N, Kaufman JS, Bell AW, Nejadghaderi SA, Sullman MJM, et al. . Prevalence, deaths and disability-adjusted-life-years (DALYs) due to type 2 diabetes and its attributable risk factors in 204 countries and territories, 1990-2019: results from the global burden of disease study 2019. Front Endocrinol (Lausanne). (2022) 13:838027. doi: 10.3389/fendo.2022.838027 - DOI - PMC - PubMed
    1. Elashi AA, Toor SM, Diboun I, Al-Sarraj Y, Taheri S, Suhre K, et al. . The genetic spectrum of maturity-onset diabetes of the young (MODY) in Qatar, a population-based study. Int J Mol Sci. (2022) 24:130. doi: 10.3390/ijms24010130 - DOI - PMC - PubMed
    1. Samya Ahmad Al A, Dahlia Mustafa H, Azza Mustafa M, Joelle B. SMART population screening and management in Qatar. Int J Diabetes Clin Res. (2019) 6(1). doi: 10.23937/2377-3634 - DOI