. 2024 Jun 26:10:90.
doi: 10.1038/s41378-024-00718-0. eCollection 2024.

Thermal noise-driven resonant sensors

Affiliations

Thermal noise-driven resonant sensors

Yan Qiao et al. Microsyst Nanoeng. .

Abstract

MEMS/NEMS resonant sensors hold promise for minute mass and force sensing. However, one major challenge is that conventional externally driven sensors inevitably encounter undesired intrinsic noise, which imposes a fundamental limitation upon their signal-to-noise ratio (SNR) and, consequently, the resolution. Particularly, this restriction becomes increasingly pronounced as sensors shrink to the nanoscale. In this work, we propose a counterintuitive paradigm shift that turns intrinsic thermal noise from an impediment to a constituent of the sensor by harvesting it as the driving force, obviating the need for external actuation and realizing 'noise-driven' sensors. Those sensors employ the dynamically amplified response to thermal noise at resonances for stimulus detection. We demonstrate that lightly damped and highly compliant nano-structures with high aspect ratios are promising candidates for this class of sensors. To overcome the phase incoherence of the drive force, three noise-enabled quantitative sensing mechanisms are developed. We validated our sensor paradigm by experimental demonstrating noise-driven pressure and temperature sensors. Noise-driven sensors offer a new opportunity for delivering practical NEMS sensors that can function at room temperature and under ambient pressure, and a development that suggests a path to cheaper, simpler, and low-power-consumption sensors.

Keywords: Electrical and electronic engineering; Sensors.


Conflict of interest statement

Competing interestsThe authors declare no competing interests.

Figures

Fig. 1
Fig. 1. Design paradigm of the thermal noise-driven resonant sensors.
a A schematic of the thermomechanical noise-driven cantilever and its driving mechanism. Comparison of the SNR and DR for (b) an externally driven sensor to that of (c) an intrinsically (thermal noise) driven sensor. The blue lines and green lines in (b) represent the sensor response (signal) under external force and its response to mechanical thermal noise Xth, respectively. The background noise floor in (b) is the sum of Xth and measurement noise Nmeas, whereas in (c), the background noise is Nbk, and Xth is sensor’s response signal. The length of the purple arrows in (b) and (c) represent the linear dynamic range of externally driven sensors (DR1) and thermal noise driven sensors (DR2), respectively. Similarly, the yellow arrows in (b) and (c) correspond to the SNR of externally driven (SNR1) and thermal noise driven (SNR2) sensors, respectively. d Three detection mechanisms for the noise-driven sensor: the resonant frequency-shift, the change in the resonant peak-magnitude and area under the power spectral density curve
Fig. 2
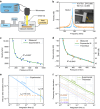
Fig. 2. Noise-driven pressure sensors with high Q.
a The experimental setup for testing of noise-driven resonant sensors. b Microscopic picture of PiezoMUMPS sensor PZ1 and its measured velocity spectrum in absence of external actuation. The measured (c) quality factor and (d) peak velocity response(left-hand ordinate) and SNR(right-hand ordinate) of sensor PZ1 as functions of pressure level. Two-term exponential fits of the measurements are shown in solid green lines. Theoretical predictions of the peak velocity are also shown in dashed blue lines. e The Allan deviation of the peak velocity. f The fractional Allan deviation of the resonant frequency
Fig. 3
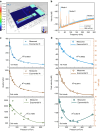
Fig. 3. Noise-driven pressure sensors with low stiffness.
a 3D profilometer picture of PolyMUMPS sensor PL1. b The measured velocity spectra of the first three bending modes. The measured (c) quality factor and (d) peak velocity and corresponding SNR of sensor PL1 at the first mode, second mode, and third mode as functions of pressure level. Two-term exponential fits of the quality factor and peak velocity are shown as solid lines
Fig. 4
Fig. 4. Noise-driven temperature sensors.
a The averaged spectra of the tip velocity of thermal noise-driven sensor PL2 at two levels of temperature and a pressure of 7 mTorr. Measured peak frequency and magnitude of the velocity as functions of temperature under pressure levels of (b) 7 mTorr and (c) 98 mTorr. d Measured RMS of velocity as a function of temperature

References

    1. Li M, Tang HX, Roukes ML. Ultra-sensitive nems-based cantilevers for sensing, scanned probe and very high-frequency applications. Nat. Nanotechnol. 2007;2:114–120. doi: 10.1038/nnano.2006.208. - DOI - PubMed
    1. Weber P, Güttinger J, Noury A, Vergara-Cruz J, Bachtold A. Force sensitivity of multilayer graphene optomechanical devices. Nat. Commun. 2016;7:1–8. doi: 10.1038/ncomms12496. - DOI - PMC - PubMed
    1. Lassagne B, Tarakanov Y, Kinaret J, Garcia-Sanchez D, Bachtold A. Coupling mechanics to charge transport in carbon nanotube mechanical resonators. Science. 2009;325:1107–1110. doi: 10.1126/science.1174290. - DOI - PubMed
    1. Yang Y-T, Callegari C, Feng X, Ekinci KL, Roukes ML. Zeptogram-scale nanomechanical mass sensing. Nano Lett. 2006;6:583–586. doi: 10.1021/nl052134m. - DOI - PubMed
    1. Lassagne B, Garcia-Sanchez D, Aguasca A, Bachtold A. Ultrasensitive mass sensing with a nanotube electromechanical resonator. Nano Lett. 2008;8:3735–3738. doi: 10.1021/nl801982v. - DOI - PubMed