. 2024 May 30;4(6):2381-2392.
doi: 10.1021/jacsau.4c00338. eCollection 2024 Jun 24.

Extracellular Vesicle Spherical Nucleic Acids

Affiliations

Extracellular Vesicle Spherical Nucleic Acids

Hao Chen et al. JACS Au. .

Abstract

Extracellular vesicles (EVs) are naturally occurring vesicles secreted by cells that can transport cargo between cells, making them promising bioactive nanomaterials. However, due to the complex and heterogeneous biological characteristics, a method for robust EV manipulation and efficient EV delivery is still lacking. Here, we developed a novel class of extracellular vesicle spherical nucleic acid (EV-SNA) nanostructures with scalability, programmability, and efficient cellular delivery. EV-SNA was constructed through the simple hydrophobic coassembly of natural EVs with cholesterol-modified oligonucleotides and can be stable for 1 month at room temperature. Based on programmable nucleic acid shells, EV-SNA can respond to AND logic gates to achieve vesicle assembly manipulation. Importantly, EV-SNA can be constructed from a wide range of biological sources EV, enhancing cellular delivery capability by nearly 10-20 times. Compared to artificial liposomal SNA, endogenous EV-SNA exhibited better biocompatibility and more effective delivery of antisense oligonucleotides in hard-to-transfect primary stem cells. Additionally, EV-SNA can deliver functional EVs for immune regulation. As a novel material form, EV-SNA may provide a modular and programmable framework paradigm for EV-based applications in drug delivery, disease treatment, nanovaccines, and other fields.


Conflict of interest statement

The authors declare no competing financial interest.

Figures

Figure 1
Figure 1
Characterization and enhanced stability of EV-SNA. (A) Schematic illustration of EV-SNA prepared by simply shaking EVs and cholesterol-oligonucleotide (Chol-DNA). (B) Cryo-EM image of EVs (scale bar, 100 nm), and total internal reflection fluorescence microscopy (TIRFM) images (scale bar, 5 μm) of EVs deployed with FAM-Chol-DNA. EVs were stained with red membrane dye. (C) Zeta potentials of EVs and EV-SNA. Data were presented as mean ± SD (n = 3). (D) Average amount of DNA on the single EV at different Chol-DNA concentrations. (E, F) Change in average diameter and polydispersity index (PDI) of EVs and EV-SNA after 72 h at room temperature. (G, H) Size distribution and transmission electron microscopy (TEM) images of EVs and EV-SNA after 30 days at room temperature. Scale bar, 500 nm.
Figure 2
Figure 2
DNA-programmed AND logic-gated assembly of EV-SNA. (A) Schematic illustration of the DNA-directed EV assembly in response to conditional AND logic gates. (B) Gel electrophoresis analyses of mixtures in response to different external inputs. (C) TEM images of EVs under different input conditions. Conditions: without linker DNA or ATP (0, 0), with ATP (0, 1), with linker DNA (1, 0), with both linker DNA and ATP (1, 1). Scale bar, 100 nm.
Figure 3
Figure 3
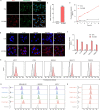
Programmable cellular uptake of EV-SNA. (A) Confocal images show cellular uptake of EV-SNA in MDA-MB-231 cells after 3 h of incubation. EVs were labeled with red membrane dye. Cells were stained with PlasmGreen dye. (B) Flow cytometric assay and quantification of the EV-SNA fluorescence levels in MDA-MB-231 cells. (C) Cell uptake kinetics curve of EV-SNA. (D–F) Confocal images and flow cytometric analysis of MCF-7, K150, HEK293, NIH-3T3, and OSRC-2 cells incubated with EV-SNA derived from MDA-MB-231 after 3 h incubation. EVs were stained with red membrane dye. Cell nuclei were stained with Hochst33342. Scale bar, 20 μm. (G) Uptake of EV-SNAs modified with different oligonucleotide sequences. (H) Flow cytometric quantification of EV-SNA uptake constructed with Chol-Poly A with different lengths. Data were represented as mean ± SD ***p < 0.001, by Student’s t test.
Figure 4
Figure 4
EV-SNAs were constructed by EVs of different biological sources. (A, E) Cryo-EM images of EVs derived from Escherichia coli cells and watermelon. Scale bar, 100 nm. (B–D) Confocal images and flow cytometric assay of MDA-MB-231 cells incubated with EV-SNA derived from E. coli cells. (F–H) Confocal images and flow cytometric assay of MDA-MB-231 cells incubated with EV-SNA derived from watermelon. Both EVs were stained with red membrane dye. Cell nuclei were stained with Hochst33342. Scale bar, 20 μm. Data were represented as mean ± SD (n = 5). ***p < 0.001, by Student’s t test.
Figure 5
Figure 5
EV-SNA delivers ASOs to modulate protein expression in hard-to-transfect primary human MSCs. (A) Schematic representation of the delivery of ASOs to hard-to-transfuse human MSCs using SNAs with different cores. (B) TEM images of liposomes and EVs derived from human MSCs, respectively. Scale bar, 100 nm. (C) ROS level of human MSCs treated with liposomes and MSC-derived EVs after 12 h. (D) Confocal images of primary human MSCs incubated with endogenous EV-SNAs or liposome-SNA for 3 h. ASO was labeled with FAM. MSC-derived EVs and liposomes were stained with red membrane dye. Scale bar, 20 μm. (E, F) Quantification of the red and green fluorescence levels in MSC cells. Data were represented as mean ± SD ***p < 0.001, by Student’s t test. (G) MSCs were treated with EV-SNA and liposome-SNA for 6 h, and then cells were cultured with a complete medium for 24 h, after which immunofluorescence of SIRT1 (green) was performed. Scale bar, 20 μm. (H, I) Levels of SIRT1 in MSCs were detected by western blotting. The sense oligonucleotide (SO) was used as the control sense. Data were represented as mean ± SD ***p < 0.001, by one-way ANOVA.
Figure 6
Figure 6
EV-SNA delivery of MSC-EVs regulates inflammatory cytokine production in RAW264.7 cells. (A, B) Confocal images and fluorescence quantification of RAW264.7 cells incubated with MSC-derived EVs or EV-SNA after 3 h. MSC-EVs were stained with red membrane dye. Data were represented as mean ± SEM (n = 5). ***p < 0.001, by Student’s t test. Scale bar, 20 μm. (C, D) ELISA results of interleukin-1β (IL-1β) and tumor necrosis factor-α (TNF-α) in the cell culture supernatant. Data were represented as mean ± SD ***p < 0.001, one-way ANOVA.

References

    1. Raposo G.; Stahl P. D. Extracellular vesicles: a new communication paradigm?. Nat. Rev. Mol. Cell Biol. 2019, 20 (9), 509–510. 10.1038/s41580-019-0158-7. - DOI - PubMed
    1. Armstrong J. P.; Holme M. N.; Stevens M. M. Re-Engineering Extracellular Vesicles as Smart Nanoscale Therapeutics. ACS Nano 2017, 11 (1), 69–83. 10.1021/acsnano.6b07607. - DOI - PMC - PubMed
    1. Tenchov R.; Sasso J. M.; Wang X.; Liaw W.-S.; Chen C.-A.; Zhou Q. A. Exosomes–Nature’s Lipid Nanoparticles, a Rising Star in Drug Delivery and Diagnostics. ACS Nano 2022, 16 (11), 17802–17846. 10.1021/acsnano.2c08774. - DOI - PMC - PubMed
    1. Wang K.; Wei Y.; Xie X.; Li Q.; Liu X.; Wang L.; Li J.; Wu J.; Fan C. DNA-Programmed Stem Cell Niches via Orthogonal Extracellular Vesicle-Cell Communications. Adv. Mater. 2023, 35 (45), 2302323.10.1002/adma.202302323. - DOI - PubMed
    1. You Y.; Tian Y.; Yang Z.; Shi J.; Kwak K. J.; Tong Y.; Estania A. P.; Cao J.; Hsu W. H.; Liu Y.; Chiang C. L.; Schrank B. R.; Huntoon K.; Lee D.; Li Z.; Zhao Y.; Zhang H.; Gallup T. D.; Ha J.; Dong S.; Li X.; Wang Y.; Lu W. J.; Bahrani E.; Lee L. J.; Teng L.; Jiang W.; Lan F.; Kim B. Y. S.; Lee A. S. Intradermally delivered mRNA-encapsulating extracellular vesicles for collagen-replacement therapy. Nat. Biomed. Eng. 2023, 7 (7), 887–900. 10.1038/s41551-022-00989-w. - DOI - PubMed

LinkOut - more resources