. 2024 May 24;15(25):9719-9732.
doi: 10.1039/d4sc01604a. eCollection 2024 Jun 26.

The slow photo-induced CO2 release of N-phthaloylglycine

Affiliations

The slow photo-induced CO2 release of N-phthaloylglycine

Wiebke Haselbach et al. Chem Sci. .

Abstract

Carboxylic acids and carboxylates may release CO2 upon oxidation. The oxidation can be conducted electrochemically as in the Kolbe synthesis or by a suitable oxidant. In N-phthaloylglycine (PG), the photo-excited phthalimide chromophore acts as an oxidant. Here, the photo-kinetics of PG dissolved in acetonitrile is traced by steady-state as well as time-resolved UV/vis and IR spectroscopy. The experiments provide clear evidence that, contrary to earlier claims, the photo-induced CO2 release is slow, i.e. it occurs on the microsecond time range. The triplet state of PG is, therefore, the photo-reactive one.


Conflict of interest statement

There are no conflicts to declare.

Figures

Scheme 1
Scheme 1. Proposed reaction scheme of PG in CH3CN via an ylide to form N-methylphthalimide.
Fig. 1
Fig. 1. Photo-reactivity of PG (0.30 mM) dissolved in deoxygenated acetonitrile. (a) UV/vis absorption spectra of PG at different times of illumination at 292 nm (0–180 s). (b) Difference spectra (illuminated minus non-illuminated) are derived from the spectra in panel (a). A predicted difference spectrum based on the absorption spectra of MP and PG is shown for comparison (dotted black line, details see Fig. S1†).
Fig. 2
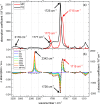
Fig. 2. Steady-state IR spectroscopy of the PG photochemistry. (a) IR spectra (absorption coefficient versus wavenumber) of PG and MP dissolved in acetonitrile (CH3CN). The solvent contribution to the IR spectra was subtracted. Axis breaks denote spectral regions which are opaque due to solvent absorptions. (b) Photoinduced changes of the IR absorption of a solution of PG (12.3 mM) in deoxygenated acetonitrile (CH3CN). The excitation wavelength was 292 nm. The difference spectra are obtained by subtracting the PG spectrum from the spectra at indicated illumination times. A predicted difference spectrum based on the IR spectra of PG and MP is shown for comparison. Characteristic wavenumbers are indicated by black (PG) and red (MP) arrows.
Fig. 3
Fig. 3. Femtosecond (bottom) and nanosecond (top) UV/vis absorption spectroscopy on PG dissolved in CH3CN. In the central contour representation, the difference absorption as a function of detection wavelength and delay time is color-coded. Vertical lines mark spectral positions for the time traces plotted on the left. Horizontal lines mark delay times for the difference spectra plotted on the right. In the femtosecond experiment, the excitation was tuned to 300 nm and the concentration amounted to 3.6 mM. In the nanosecond experiment, the excitation wavelength was 266 nm and the concentration amounted to 1.3 mM. For the nanosecond experiment, deoxygenated acetonitrile was employed. The decay-associated difference spectrum DADSfs (blue) from the fsTA experiment, corresponding to the offset signature of this experiment, is compared to the transient spectrum in the nsTA experiment after ∼50 ns and DADSns3 (red). Note that the spectral coverage of the nsTA instrument is larger than the one of the fsTA instrument.
Fig. 4
Fig. 4. DADS derived from the femtosecond and nanosecond UV/vis absorption measurements on PG dissolved in acetonitrile depicted in Fig. 3. The DADS2-3 are compared with the ones of MP ((a) and (b)). The DADSns3 for PG retrieved from the nanosecond experiment is also compared to the offset spectrum of the femtosecond experiment (DADSfs) (b). The offset spectrum of the nanosecond experiment (DADSns) is plotted together with the steady-state difference spectrum (cf.Fig. 1) (c).
Fig. 5
Fig. 5. Femtosecond ((a) and (b), dissolved in CD3CN) and nanosecond ((c) and (d), dissolved in CH3CN) IR spectroscopy on PG. In the central contour representation, the difference absorption as a function of detection wavenumber and delay time is color-coded. Vertical lines mark spectral positions for the time traces plotted on the left. Horizontal lines mark delay times for the difference spectra plotted on the right. (a) and (b): In the femtosecond experiment, the excitation was tuned to 300 nm and the concentration amounted to about 50 mM. (c) and (d): In the nanosecond experiment, the excitation wavelength was 266 nm and the concentration amounted to 73 mM. For the nanosecond experiment, the acetonitrile was deoxygenated.
Fig. 6
Fig. 6. Analysis of the time-resolved IR experiments depicted in Fig. 5. (a) DADS derived from the femtosecond one. (b) Time traces of the nanosecond triplet signature (1646 cm−1 and 1689 cm−1). (c) Smoothed time trace of the formed CO2 band in the nanosecond range for PG in deoxygenated acetonitrile and mNPAA (scaled with a factor of 4) in deoxygenated sodium phosphate buffer.
Fig. 7
Fig. 7. Optimized ground state geometries of PG; (a) open conformer and (b) closed conformer (intramolecular hydrogen bond). The conformers were modelled in acetonitrile according to the polarizable continuum model (PCM) at the B3LYP/Def2-TZVP level of theory.
Fig. 8
Fig. 8. Computed IR spectra of the open (closed) PG conformer (a harmonic scaling factor of 1.0044 (ref. 31) was applied to all calculated frequencies): (a) ground state: comparison of the quantum chemical stick spectrum (blue; open: solid; closed: dotted) (integrated signal strength as a function of wavenumber) convoluted with Gaussians (blue; open: solid; closed: dotted) (absorption coefficient as a function of wavenumber) with the experimental (black) IR spectrum. (b) Lowest triplet state: computed spectra of the open (red solid line) and closed (red dotted line) form. (c) Difference spectra (black; open: solid; closed: dotted), obtained by subtracting triplet from the ground state spectra are compared with the DADSfsIR (green solid line). The calculated ground and triplet states in (a) and (b) as well as the difference spectra of (c) were shifted along the wavenumber axis to match the negative peak at 1722 cm−1 (open: −23 cm−1; closed: +6 cm−1; indicated by colored arrows in (a)).
Scheme 2
Scheme 2. Intermolecular hydrogen transfer between ground state PG and triplet PG.
Fig. 9
Fig. 9. Kinetic scheme of the PG photo-reaction in acetonitrile.

References

    1. Hu X. Q. Liu Z. K. Hou Y. X. Gao Y. Iscience. 2020;23:101266. doi: 10.1016/j.isci.2020.101266. - DOI - PMC - PubMed
    1. Schäfer H. J., Recent contributions of Kolbe electrolysis to organic synthesis, Springer Berlin Heidelberg, Berlin, Heidelberg, 1990
    1. Palkovits S. Palkovits R. Chem. Ing. Tech. 2019;91:699–706. doi: 10.1002/cite.201800205. - DOI
    1. Sorigué D. Légeret B. Cuiné S. Blangy S. Moulin S. Billon E. Richaud P. Brugière S. Couté Y. Nurizzo D. Müller P. Brettel K. Pignol D. Arnoux P. Li-Beisson Y. Peltier G. Beisson F. Science. 2017;357:903–907. doi: 10.1126/science.aan6349. - DOI - PubMed
    1. Sorigue D. Hadjidemetriou K. Blangy S. Gotthard G. Bonvalet A. Coquelle N. Samire P. Aleksandrov A. Antonucci L. Benachir A. Boutet S. Byrdin M. Cammarata M. Carbajo S. Cuine S. Doak R. B. Foucar L. Gorel A. Grunbein M. Hartmann E. Hienerwadel R. Hilpert M. Kloos M. Lane T. J. Legeret B. Legrand P. Li-Beisson Y. Moulin S. L. Y. Nurizzo D. Peltier G. Schiro G. Shoeman R. L. Sliwa M. Solinas X. Zhuang B. Barends T. R. M. Colletier J. P. Joffre M. Royant A. Berthomieu C. Weik M. Domratcheva T. Brettel K. Vos M. H. Schlichting I. Arnoux P. Muller P. Beisson F. Science. 2021;372:eabd5687. doi: 10.1126/science.abd5687. - DOI - PubMed