. 2023 Jul 27;2(6):100454.
doi: 10.1016/j.jacadv.2023.100454. eCollection 2023 Aug.

Coronary Artery Occlusion Detection Using 3-Lead ECG System Suitable for Credit Card-Size Personal Device Integration

Affiliations

Coronary Artery Occlusion Detection Using 3-Lead ECG System Suitable for Credit Card-Size Personal Device Integration

Alexei Shvilkin et al. JACC Adv. .

Abstract

Background: Early coronary occlusion detection by portable personal device with limited number of electrocardiographic (ECG) leads might shorten symptom-to-balloon time in acute coronary syndromes.

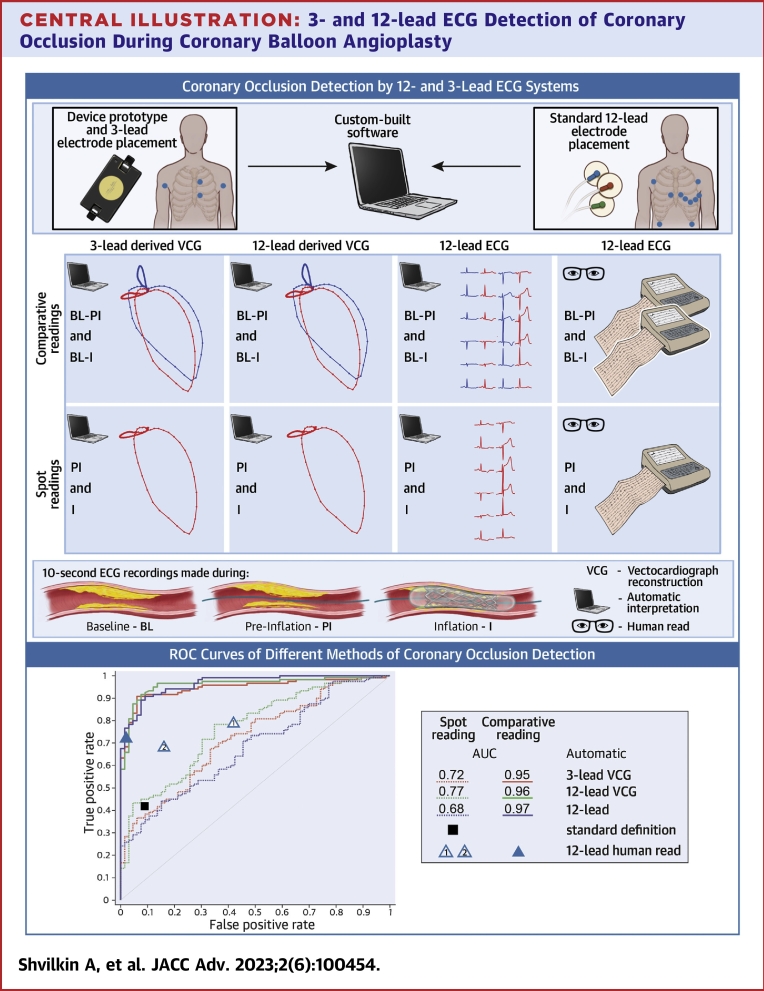
Objectives: The purpose of this study was to compare the accuracy of coronary occlusion detection using vectorcardgiographic analysis of a near-orthogonal 3-lead ECG configuration suitable for credit card-size personal device integration with automated and human 12 lead ECG interpretation.

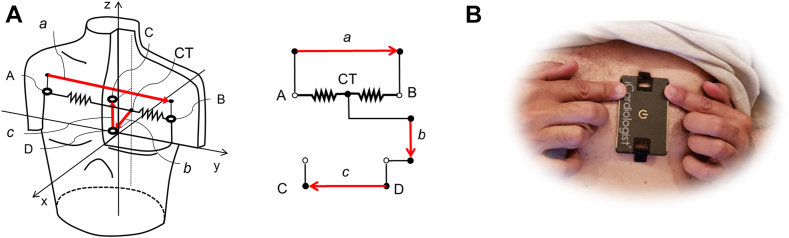
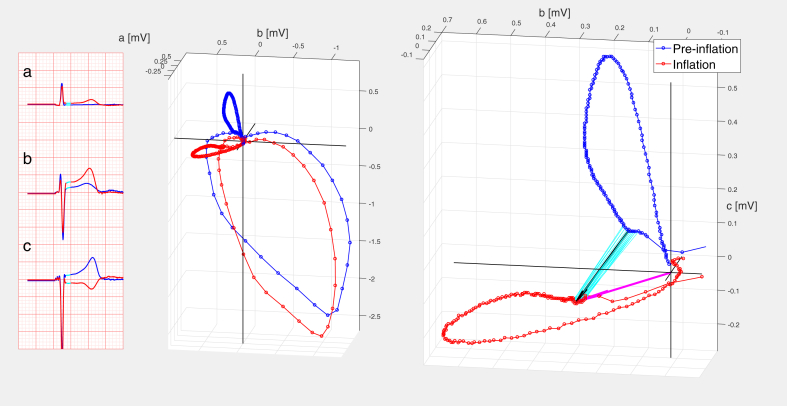
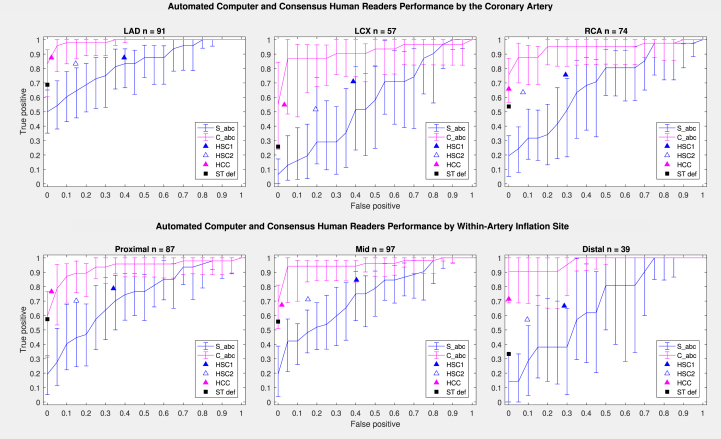
Methods: The 12-lead ECGs with 3 additional leads ("abc") using 2 arm and 2 left parasternal electrodes were recorded in 66 patients undergoing percutaneous coronary intervention prior to ("baseline", n = 66), immediately before ("preinflation", n = 66), and after 90-second balloon coronary occlusion ("inflation", n = 120). Performance of computer-measured ST-segment shift on vectorcardgiographic loops constructed from "abc" and 12 leads, standard 12-lead ECG, and consensus human interpretation in coronary occlusion detection were compared in "comparative" and "spot" modes (with/without reference to "baseline") using areas under ROC curves (AUC), reliability, and sensitivity/specificity analysis.

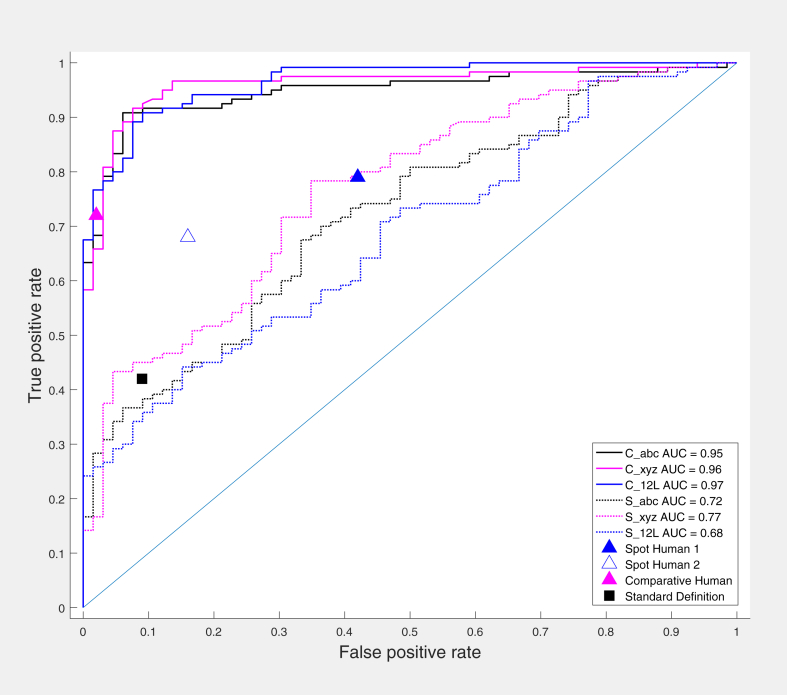
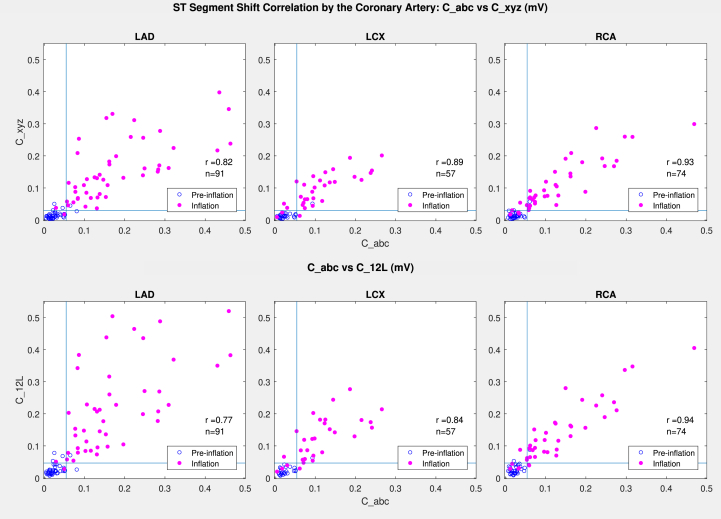
Results: Comparative "abc"-derived ST-segment shift was similar to two 12-lead methods (vector/traditional) in detecting balloon coronary occlusion (AUC = 0.95, 0.96, and 0.97, respectively, P = NS). Spot "abc" and 12-lead measurements (AUC = 0.72, 0.77, 0.68, respectively, P = NS) demonstrated poorer performance (P < 0.01 vs comparative measurements). Reliability analysis demonstrated comparative automated measurements in "good" agreement with reference (preinflation/inflation), while comparative human interpretation was in "moderate" range. Spot automated and human reading showed "poor" agreement.

Conclusions: Vectorcardiographic ST-segment analysis using baseline comparison of 3-lead ECG system suitable for credit card-size personal device integration is similar to established 12-lead ECG methods in detecting balloon coronary occlusion.

Keywords: ST-segment elevation myocardial infarction; acute coronary syndrome; electrocardiography; myocardial ischemia; vectorcardiography.


Conflict of interest statement

Drs Shvilkin, Vukčević, Vukajlović, Bojović, Hadžievski, and Atanasoskiare are stockholders of HeartBeam, Inc. Drs Miletić, Zimetbaum, and Gibson have received consulting fees from HeartBeam, Inc. Dr Vajdic is CEO, HeartBeam, Inc.

Figures

None
Graphical abstract
Figure 1
Figure 1
The “abc” Electrode System Electrode Positions and Electrical Schematic (A) Measured voltages: VBA,VCA,VDA. Near-orthogonal “abc” leads: a=VBA,b=VDAVBA/2,c=VDAVCA. Lead “a” is equivalent to the standard lead I (right to left arm) and similar to the orthogonal lead “x”, lead “b” has sagittal direction (back to front, similar to lead V2 or orthogonal “z”), lead c - caudal direction (head to toes, similar to lead aVF or orthogonal “y”). CT–central terminal. (B) Prototype HeartBeam credit card-size device with integrated leads “a”, “b”, and “c”. Chest electrodes unfold by a spring-loaded mechanism extending the intraelectrode distance
Figure 2
Figure 2
Calculation of “abc” Measurements C_abc and S_abc in a Patient With Proximal LAD Balloon Occlusion (Left) Median beat leads “a”, “b”, “c”. Cyan-colored portion of ST-segment used for calculation of diagnostic measurements. Middle (Middle) Modified left sagittal projection of the “abc”-based median QRST loops. (Right) Magnified “abc” T vector loops in the same projection. Cyan lines delineate analyzed ST-segment. Black arrow length represents the value of C_abc (=0.29 mV); magenta arrow length represents S_abc (=0.31 mV). Vector inscription velocity indicated by 2 ms inter-dot timing. Blue = preinflation; red = inflation. LAD = left anterior descending coronary artery.
Figure 3
Figure 3
Automated Computer and Human Reader Performance ROC Curves AUC between comparative measurements were not different (P = NS) while significantly higher than AUC of spot measurements (P < 0.05). Triangles represent sensitivity/specificity data for consensus human readings (HCS1, HCS2, HCC); black square represents standard ischemia definition; solid lines represent comparative measurements; and dashed/dotted lines represent spot measurements. AUC = areas under the ROC curves
Figure 4
Figure 4
Correlation Between Comparative C_abc and 12 Lead-Derived (C_xyz and C_12L) ST-Segment Shift Measurements Blue open circles represent preinflation; solid pink circles represent inflation; and blue lines represent cutoff threshold values for respective measurements.
Figure 5
Figure 5
“abc” Measurements and Human Reader Performance by the Occlusion Location ROC Curves Error bars represent 95%-point confidence intervals. Triangles represent sensitivity/specificity data for consensus human readings (HSC1, HSC2, HCC); blacksquare represents standard ischemia definition; magenta lines represent comparative measurements; and blue lines represent spot measurements.
Central Illustration
3- and 12-lead ECG Detection of Coronary Occlusion During Coronary Balloon Angioplasty ST-segment shift computer analysis for ischemia detection (inflation) with and without using vectorcardiographic reconstruction (VCG) and blind consensus human reading performed in “comparative” (baseline/inflation, baseline/preinflation comparison) and “spot” (preinflation, inflation without baseline information) modes. Areas under the ROC curves (AUC) along with points representing “STEMI standard definition” (black square) and human consensus readings (2 independent “spot”, open triangles 1 and 2, and 1 “comparative, solid triangle) are presented. All ECG analyses in “comparative” mode were superior to “spot” mode (P < 0.05 for AUC differences) without significant difference between “abc” and 12 leads. Human “spot” readings 1 and 2 highlight low reproducibility of human reading. ECG = electrocardiogram; STEMI = ST-segment elevation myocardial infarction

References

    1. Nallamothu B.K., Normand S.L., Wang Y., et al. Relation between door-to-balloon times and mortality after primary percutaneous coronary intervention over time: a retrospective study. Lancet. 2015;385:1114–1122. - PMC - PubMed
    1. De Luca G., Suryapranata H., Zijlstra F., et al. Symptom-onset-to-balloon time and mortality in patients with acute myocardial infarction treated by primary angioplasty. J Am Coll Cardiol. 2003;42:991–997. - PubMed
    1. Gibson C.M. Time is myocardium and time is outcomes. Circulation. 2001;104:2632–2634. - PubMed
    1. Goldberg R.J., Spencer F.A., Fox K.A., et al. Prehospital delay in patients with acute coronary syndromes (from the Global Registry of acute coronary events [GRACE]) Am J Cardiol. 2009;103:598–603. - PubMed
    1. Marcolino M.S., Maia L.M., Oliveira J.A.Q., et al. Impact of telemedicine interventions on mortality in patients with acute myocardial infarction: a systematic review and meta-analysis. Heart. 2019;105(19):1479–1486. - PubMed

LinkOut - more resources