. 2022 Nov 23;1(11):e66.
doi: 10.1002/jex2.66. eCollection 2022 Nov.

Comparative and integrated analysis of plasma extracellular vesicle isolation methods in healthy volunteers and patients following myocardial infarction

Affiliations

Comparative and integrated analysis of plasma extracellular vesicle isolation methods in healthy volunteers and patients following myocardial infarction

Daan Paget et al. J Extracell Biol. .

Abstract

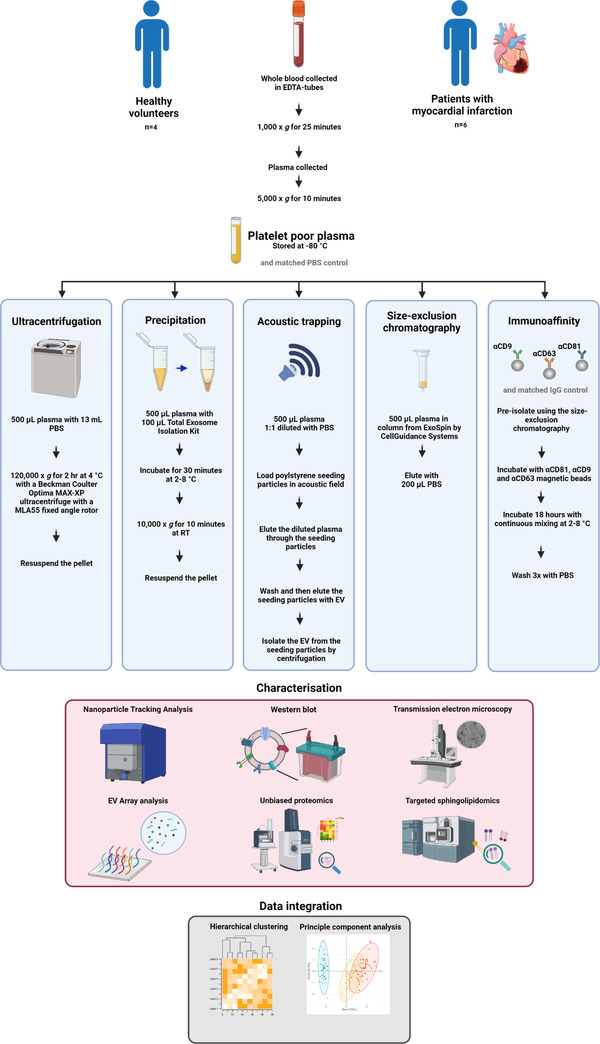
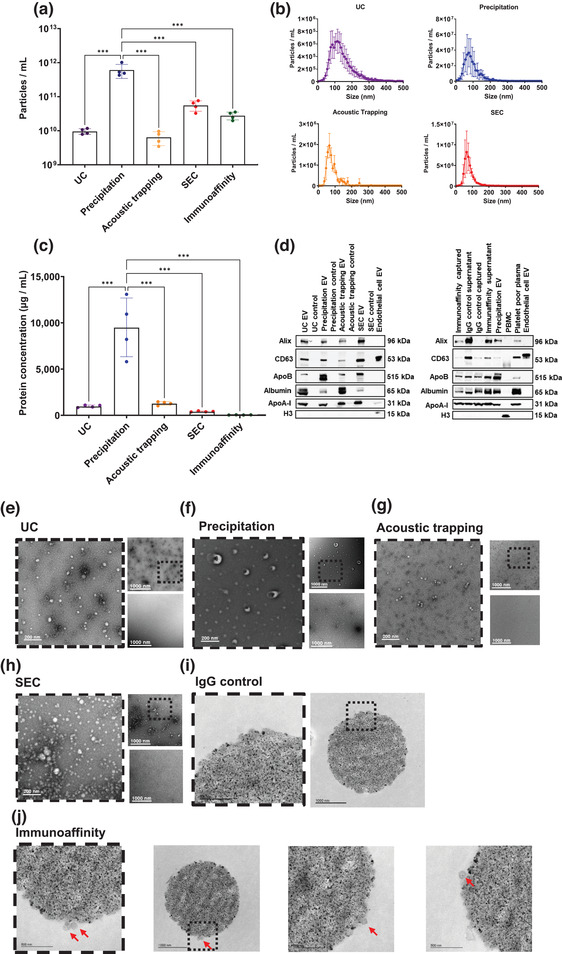
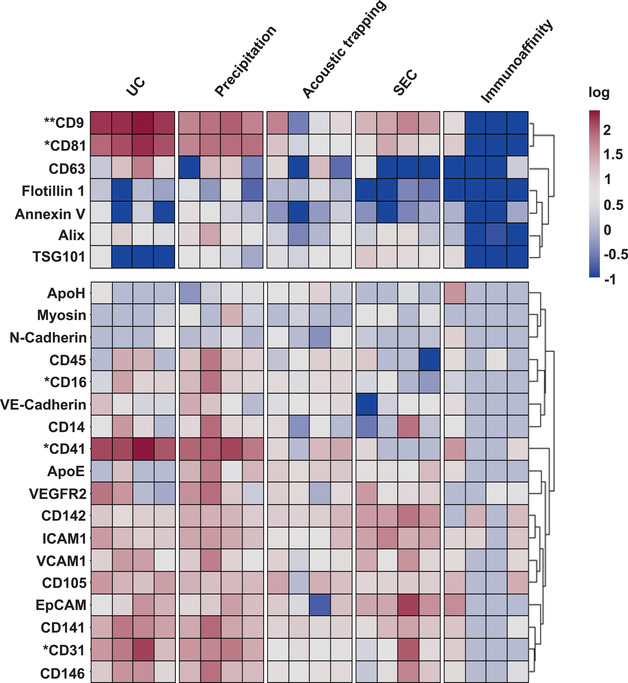
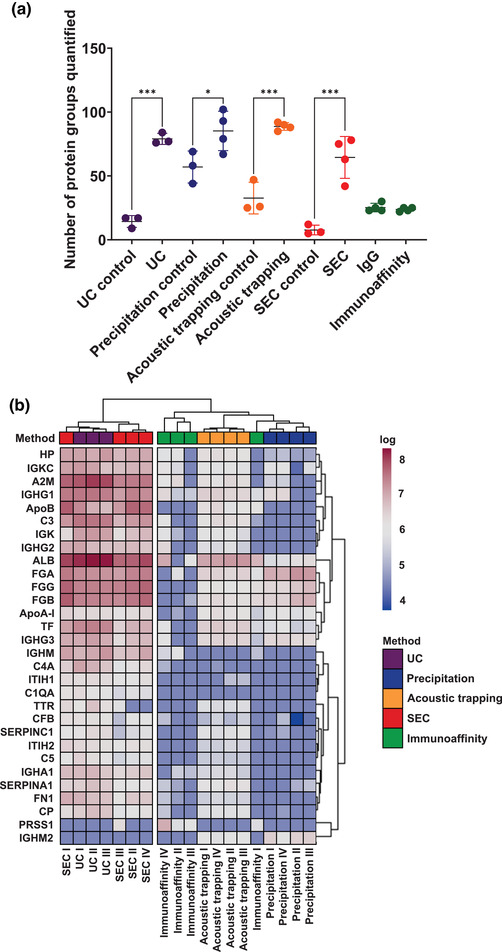
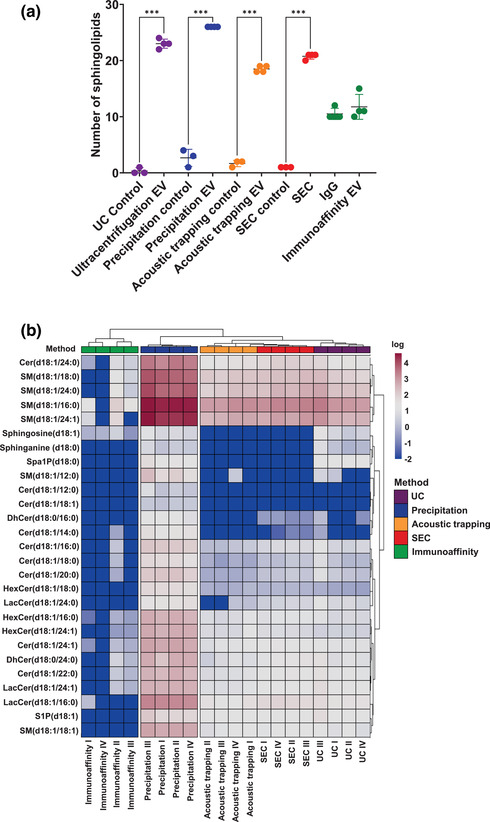
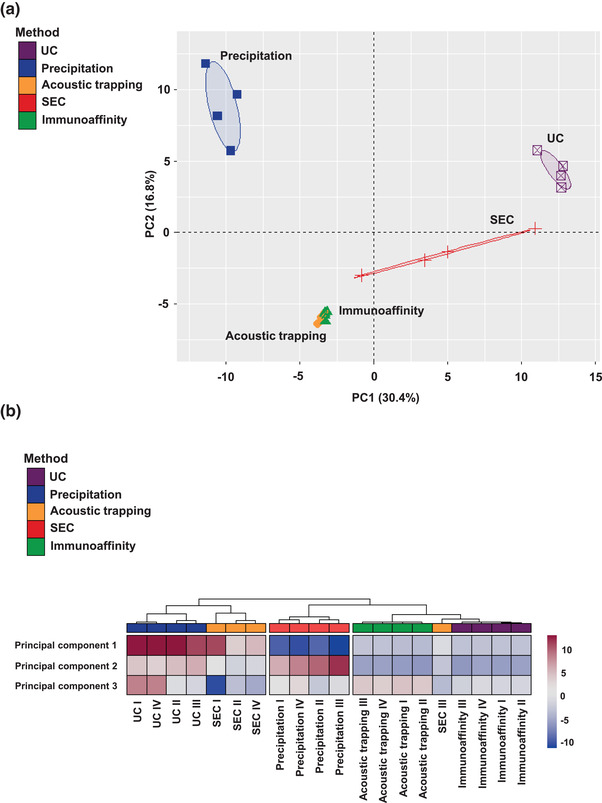
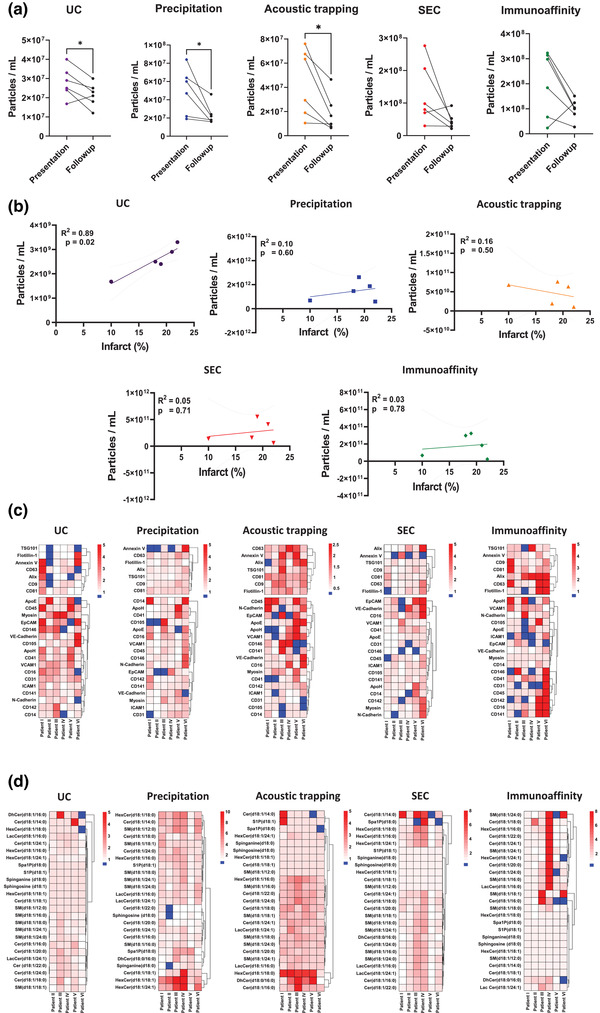
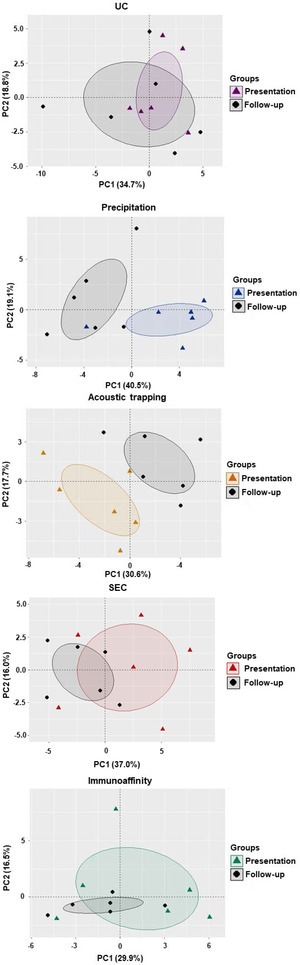
Plasma extracellular vesicle (EV) number and composition are altered following myocardial infarction (MI), but to properly understand the significance of these changes it is essential to appreciate how the different isolation methods affect EV characteristics, proteome and sphingolipidome. Here, we compared plasma EV isolated from platelet-poor plasma from four healthy donors and six MI patients at presentation and 1-month post-MI using ultracentrifugation (UC), polyethylene glycol precipitation, acoustic trapping, size-exclusion chromatography (SEC) and immunoaffinity capture. The isolated EV were evaluated by Nanoparticle Tracking Analysis (NTA), Western blot, transmission electron microscopy (TEM), an EV-protein array, untargeted proteomics (LC-MS/MS) and targeted sphingolipidomics (LC-MS/MS). The application of the five different plasma EV isolation methods in patients presenting with MI showed that the choice of plasma EV isolation method influenced the ability to distinguish elevations in plasma EV concentration following MI, enrichment of EV-cargo (EV-proteins and sphingolipidomics) and associations with the size of the infarct determined by cardiac magnetic resonance imaging 6 months post-MI. Despite the selection bias imposed by each method, a core of EV-associated proteins and lipids was detectable using all approaches. However, this study highlights how each isolation method comes with its own idiosyncrasies and makes the comparison of data acquired by different techniques in clinical studies problematic.

Keywords: acoustic trapping; human; immunoaffinity capture; omics; plasma; precipitation; size exclusion chromatography; ultracentrifugation.


Conflict of interest statement

The Author(s) declare that there is no conflict of interest.

Figures

FIGURE 1
FIGURE 1
A methodological overview. Platelet‐poor plasma was obtained from healthy volunteers (n = 4) and patients presenting with myocardial infarction (MI) (n = 6) (and from the same patients 1‐month post‐MI) and plasma extracellular vesicles (EV) were isolated using five different methods: ultracentrifugation (UC), precipitation, acoustic trapping, size exclusion chromatography (SEC) and immunoaffinity capture with a matched vehicle phosphate buffered saline (PBS) or IgG control. The plasma EV were analysed using Nanoparticle Tracking Analysis, protein concentration, Western blot, transmission electron microscopy, a targeted EV‐protein array for EV‐markers CD9, CD63, CD81, ALIX, TSG101, flotillin, Annexin V, and 18 other cell associated markers, untargeted proteomics (LC‐MS/MS) and targeted sphingolipidomics (LC‐MS/MS). The data were analyzed in isolation and following integrated hierarchical clustering and principal component analysis. Room temperature (RT).
FIGURE 2
FIGURE 2
Plasma EV characterization using different isolation methods. (a) Total plasma extracellular vesicles (EV) as particles/mL concentrations and (b) size and concentration distribution profiles were obtained by Nanoparticle Tracking Analysis (NTA) using ultracentrifugation (UC), precipitation, acoustic trapping, size exclusion chromatography (SEC) and immunoaffinity capture (n = 4). Values are presented as a delta compared to a vehicle control or IgG control. Scale is logarithmic. (c) Protein concentration of plasma EV using UC, precipitation, acoustic trapping, SEC and immunoaffinity capture (n = 4). Values are presented as a delta compared to a vehicle control or IgG control. (d) Western blot of plasma EV isolated by UC, precipitation, acoustic trapping, SEC and immunoaffinity capture versus controls using EV markers ALIX and CD63, lipoprotein contaminants apolipoprotein B (ApoB), and apolipoprotein A‐I (ApoA‐I), plasma contaminant albumin and cellular contaminant histone H3. Endothelial cell EV and peripheral blood mononuclear cells (PBMCs) were used for H3 positive controls. (e–j). Transmission electron microscopy (TEM) images of isolated plasma EV from UC, precipitation, acoustic trapping, SEC and immunoaffinity capture versus controls. Each sub panel contains a zoomed‐in image (left image), an overview image (top right) and a control vehicle image (bottom right). For the immunoaffinity bead capture images, the red arrows indicate EV particles. The scale bar is 200 nm for the zoomed images surrounded by a dashed line and 1,000 nm for the overview images Data are group average ± standard deviation (SD). Data was analyzed by one‐way ANOVA with post‐hoc Bonferroni correction. ***p < 0.001.
FIGURE 3
FIGURE 3
Heatmap of plasma EV derived from different isolation methods using the EV‐protein‐Array. The heatmap contains extracellular vesicles (EV) markers CD9, CD81, CD63, ALIX, TSG101, Flotillin 1 and Annexin V for ultracentrifugation (UC), precipitation, acoustic trapping, size exclusion chromatography (SEC) and immunoaffinity capture, lipid contaminants apolipoprotein H (ApoH) and apolipoprotein E (ApoE) and cell associated markers. Values are derived from 500 μL of platelet poor plasma per sample, per technique. Values are presented as a delta compared to a vehicle control or IgG control and are log normalized (n = 4 per isolation method). Data was analyzed by Kruskal‐Wallis test with post‐hoc Bonferroni correction. *p < 0.05, ***p < 0.001.
FIGURE 4
FIGURE 4
Proteomic comparison of plasma EV isolation methods. (a) The number of protein groups quantified by unbiased proteomics for plasma extracellular vesicles (EV) derived by: ultracentrifugation (UC), precipitation, acoustic trapping, size exclusion chromatography (SEC) and immunoaffinity capture, versus control vehicle (PBS) or an IgG control. Protein groups were only included as quantified if they had ≥2 unique peptides (n = 3–4). One‐way ANOVA with post‐hoc Bonferroni correction. Data are group averages ± standard deviation (SD). *p < 0.05, ***p < 0.001. (b) A heatmap of the top 30 quantified protein groups across all isolation methods. Values from control samples were subtracted to account for background and the values were log normalised. Hierarchical clustering of the isolation methods was conducted using a complete clustering method (n = 3–4).
FIGURE 5
FIGURE 5
Sphingolipidomic analysis of plasma EV from different isolation methods. (a) Number of sphingolipids quantified in plasma extracellular vesicles (EV) isolated by ultracentrifugation (UC), precipitation, acoustic trapping, size‐exclusion chromatography (SEC) and immunoaffinity capture and subjected to targeted sphingolipid analysis versus control vehicle (PBS) or an IgG control. Data are group averages ± standard deviation (SD) and were analysed by One‐way ANOVA with post‐hoc Bonferroni correction. ***p < 0.001 (n = 4). (b) Heat map of plasma EV sphingolipids. Values from control samples were subtracted to account for background and the values were log normalised. Hierarchical clustering of the isolation methods was conducted using a complete clustering method (n = 3–4). Data were analysed by Kruskal‐Wallis test with post‐hoc Bonferroni correction.
FIGURE 6
FIGURE 6
Principal component analysis of plasma EV characteristics following data integration. (a) A principal component (PC) analysis of plasma extracellular vesicles (EV) isolated by ultracentrifugation (UC), precipitation, acoustic trapping, size‐exclusion chromatography (SEC) and immunoaffinity capture including: plasma EV concentration, protein concentration, EV‐protein‐Array, proteomics and sphingolipidomics. The integrated data was condensed to PC1 and PC2. (b) A heatmap with the various principal components to compare the different isolation plasma EV isolation methods. Hierarchical clustering of the isolation methods was conducted using a complete clustering method (n = 3–4).
FIGURE 7
FIGURE 7
Plasma EV analysis using different isolation methods in patients following presentation with myocardial (MI) infarction compared to samples from the same patients after a 1‐month follow‐up. (a) Comparison of total concentration of plasma extracellular vesicles by Nanoparticle Tracking Analysis (EV) from patients following presentation with MI and after a 1‐month follow‐up using: ultracentrifugation (UC), precipitation, acoustic trapping, size exclusion chromatography (SEC) and immunoaffinity capture (n = 6 per timepoint). Data are group average ± standard deviation (SD). Paired t‐test analysis *p < 0.05. (b) A Pearson correlation analysis of plasma EV as particles/mL derived from each isolation method at time of presentation versus the infarct size determined by cardiac MRI using late gadolinium enhancement 6‐months post‐infarct (n = 5). (c) Heatmap of plasma EV‐Array analysis. The top section of the heatmap contains the different EV markers CD9, CD81, CD63, ALIX, TSG101, Flotillin 1 and Annexin V. Values are presented as fold over the respective matched follow‐up control sample. (d) Heatmap showing the plasma EV sphingolipidomic profiles in MI patents at presentation versus a 1‐month follow‐up for UC, precipitation, acoustic trapping, SEC and immunoaffinity capture. Values are presented as fold over the respective matched follow‐up.
FIGURE 8
FIGURE 8
Principal component analysis of integrated plasma EV characterisation at time of presentation with myocardial infarction (MI) versus 1‐month follow‐up in the same patients using different plasma EV isolation methods. A principal component (PC) analysis of plasma EV isolated by ultracentrifugation (UC), precipitation, acoustic trapping, size‐exclusion chromatography (SEC) and immunoaffinity capture from patients presenting with MI versus a 1‐month follow‐up control. Plasma EV characteristics including plasma EV concentration, EV‐protein‐Array and sphingolipidomics were integrated. The integrated data was condensed to PC1 and PC2 (n = 5–6). The eclipses indicate the 95% confidence interval.

References

    1. Akawi, N. , Checa, A. , Antonopoulos, A. S. , Akoumianakis, I. , Daskalaki, E. , Kotanidis, C. P. , Kondo, H. , Lee, K. , Yesilyurt, D. , Badi, I. , Polkinghorne, M. , Akbar, N. , Lundgren, J. , Chuaiphichai, S. , Choudhury, R. , Neubauer, S. , Channon, K. M. , Torekov, S. S. , Wheelock, C. E. , & Antoniades, C. (2021). Fat‐secreted ceramides regulate vascular redox state and influence outcomes in patients with cardiovascular disease. Journal of the American College of Cardiology, 77(20), 2494–2513. - PMC - PubMed
    1. Akbar, N. , Braithwaite, A. T. , Corr, E. M. , Koelwyn, G. J. , Van Solingen, C. , Cochain, C. , Saliba, A. ‐E. , Corbin, A. , Pezzolla, D. , Jørgensen, M. M. , Bæk, R. , Edgar, L. , De Villiers, C. , Gunadasa‐Rohling, M. , Banerjee, A. , Paget, D. , Lee, C. , Hogg, E. , Costin, A. , … Choudhury, R. P. (2022). Rapid neutrophil mobilisation by VCAM‐1+ endothelial extracellular vesicles. Cardiovascular Research, cvac012. 10.1093/cvr/cvac012 - DOI - PMC - PubMed
    1. Akbar, N. , Digby, J. E. , Cahill, T. J. , Tavare, A. N. , Corbin, A. L. , Saluja, S. , Dawkins, S. , Edgar, L. , Rawlings, N. , Ziberna, K. , Mcneill, E. , Johnson, E. , Aljabali, A. A. , Dragovic, R. A. , Rohling, M. , Belgard, T. G. , Udalova, I. A. , Greaves, D. R. , Channon, K. M. , & Choudhury, R. P. (2017). Endothelium‐derived extracellular vesicles promote splenic monocyte mobilization in myocardial infarction. The Journal of Clinical Investigation, 2(17), e93344. - PMC - PubMed
    1. Askeland, A. , Borup, A. , Østergaard, O. , Olsen, J. V. , Lund, S. M. , Christiansen, G. , Kristensen, S. R. , Heegaard, N. H. H. , & Pedersen, S. (2020). Mass‐spectrometry based proteome comparison of extracellular vesicle isolation methods: Comparison of ME‐kit, size‐exclusion chromatography, and high‐speed centrifugation. Biomedicines, 8(8), 246. - PMC - PubMed
    1. Bæk, R. , & Jørgensen, M. M. (2017). Multiplexed phenotyping of small extracellular vesicles using protein microarray (EV Array). Methods in Molecular Biology, 1545, 117–127. - PubMed