. 2024 Jul 19;135(3):e57-e75.
doi: 10.1161/CIRCRESAHA.123.324058. Epub 2024 Jun 28.

Antiarrhythmic Mechanisms of Epidural Blockade After Myocardial Infarction

Affiliations

Antiarrhythmic Mechanisms of Epidural Blockade After Myocardial Infarction

Jonathan D Hoang et al. Circ Res. .

Abstract

Background: Thoracic epidural anesthesia (TEA) has been shown to reduce the burden of ventricular tachycardia in small case series of patients with refractory ventricular tachyarrhythmias and cardiomyopathy. However, its electrophysiological and autonomic effects in diseased hearts remain unclear, and its use after myocardial infarction is limited by concerns for potential right ventricular dysfunction.

Methods: Myocardial infarction was created in Yorkshire pigs (N=22) by left anterior descending coronary artery occlusion. Approximately, six weeks after myocardial infarction, an epidural catheter was placed at the C7-T1 vertebral level for injection of 2% lidocaine. Right and left ventricular hemodynamics were recorded using Millar pressure-conductance catheters, and ventricular activation recovery intervals (ARIs), a surrogate of action potential durations, by a 56-electrode sock and 64-electrode basket catheter. Hemodynamics and ARIs, baroreflex sensitivity and intrinsic cardiac neural activity, and ventricular effective refractory periods and slope of restitution (Smax) were assessed before and after TEA. Ventricular tachyarrhythmia inducibility was assessed by programmed electrical stimulation.

Results: TEA reduced inducibility of ventricular tachyarrhythmias by 70%. TEA did not affect right ventricular-systolic pressure or contractility, although left ventricular-systolic pressure and contractility decreased modestly. Global and regional ventricular ARIs increased, including in scar and border zone regions post-TEA. TEA reduced ARI dispersion specifically in border zone regions. Ventricular effective refractory periods prolonged significantly at critical sites of arrhythmogenesis, and Smax was reduced. Interestingly, TEA significantly improved cardiac vagal function, as measured by both baroreflex sensitivity and intrinsic cardiac neural activity.

Conclusions: TEA does not compromise right ventricular function in infarcted hearts. Its antiarrhythmic mechanisms are mediated by increases in ventricular effective refractory period and ARIs, decreases in Smax, and reductions in border zone electrophysiological heterogeneities. TEA improves parasympathetic function, which may independently underlie some of its observed antiarrhythmic mechanisms. This study provides novel insights into the antiarrhythmic mechanisms of TEA while highlighting its applicability to the clinical setting.

Keywords: anesthesia, epidural; arrhythmias, cardiac; autonomic nervous system; cardiac electrophysiology; myocardial infarction; peripheral nervous system; translational research.


Conflict of interest statement

M. Vaseghi has patents related to neuromodulation at the University of California, Los Angeles, and has performed educational consulting for Biosense Webster, Medtronic, and Recor, Inc, and has shares in NeuCures and Anumana, Inc. The other authors report no conflicts.

Figures

Figure 1.
Figure 1.. Effects of thoracic epidural anesthesia on hemodynamic parameters.
(A) A 17-gauge Tuohy needle is advanced into the epidural space from the T5-T6 or T6-T7 interspace and contrast is injected to confirm the initial placement of the needle tip (arrow). (B) An open-tip epidural catheter (arrow) is placed with the animal in the lateral decubitus position and advanced from T5-T6 interspace to the C7-T1 vertebral level under fluoroscopic guidance. (C) Final catheter placement is confirmed in the supine position (antero-posterior view). (D) Representative raw traces of the effects of TEA on right ventricular (RV) and left ventricular (LV) function. Thoracic epidural anesthesia (TEA) modestly, but significantly, decreased (E) heart rate (F) LV systolic pressure (LVSP), (G) LV inotropy (LV-dP/dtmax) and (H) LV lusitropy (LV-dP/dtmin), but (I) did not decrease LV contractility index (LV-dP/dtmax • LVP−1). TEA did not have any effects on (J) RV systolic pressure (RVSP), (K) RV inotropy (RV-dP/dtmax), (L) RV lusitropy (RV-dP/dtmin), or (M) RV contractility index (RV-dP/dtmax • RVP−1). Pre-TEA vs post-TEA parameters were compared using Student’s paired t-test, N=10 animals.
Figure 2.
Figure 2.. Effects of thoracic epidural anesthesia on electrical stability and inducibility of ventricular tachyarrhythmias.
(A) Myocardial infarcts were created by occlusion of the left anterior descending coronary artery (LAD) immediately after the first diagonal branch (white arrowhead). The infarcted ventricular region, six weeks post-MI, is indicated by the red dashed line. (B) Example of VT/VF induction using programmed ventricular stimulation. Prior to thoracic epidural anesthesia (TEA), this animal was inducible for ventricular tachycardia (VT) with double extra-stimuli. After TEA, VT was no longer inducible with triple extra-stimuli, and ventricular effective refractory period (ERP) was reached (red arrows indicate pacing artifact and blue arrows indicate ventricular capture). (C) Breakdown of final stimulation parameters used to induce VT. (D) Examples of ventricular arrhythmias induced by programmed ventricular stimulation and (E-F) the frequency of their occurrence with each extra-stimulus. (G) Before TEA, all ten animals were inducible for VT, including 3 animals that were inducible with only 2 extra stimuli. After TEA, only 3 animals were inducible with up to 3 extra-stimuli, overall decreasing VT/VF inducibility by 70%. (H) An arrhythmia score summarizing the severity of the arrhythmia and the ease of inducibility further highlights the increase in electrical stability after-TEA. E51=cardiac electrograms from sock electrode #51; STIM=channel used for ventricular stimulation pacing. VT inducibility pre-TEA vs post-TEA was compared by the paired exact binomial test. Arrhythmia score pre-TEA vs post-TEA compared by the paired Wilcoxon Rank Sum test; N=10 animals.
Figure 3.
Figure 3.. Effects of thoracic epidural anesthesia on ventricular action potential duration.
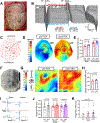
(A) A 56-electrode sock is placed around the ventricles to record local unipolar EGMs. (B) Representative waterfall plot of a unipolar electrogram from a single electrode in one animal spanning the time frame from a few seconds of baseline (before lidocaine administration) followed by the 90 second period after lidocaine infusion. Over this period, there is progressive prolongation of activation recovery interval (ARI), which then plateaus. ARI, a surrogate for local action potential duration, is calculated as the time from activation time (AT; dV/dtmin of activation wave-front) to recovery time (RT; dV/dtmax of repolarization wave-front) from each unipolar electrogram. (C) Electrograms were mapped onto a 2-D polar map for the assessment of global and regional electrophysiological changes. (D) Representative epicardial polar maps comparing ARIs pre-TEA and post-TEA. (E) Global ARIs significantly prolonged post-TEA, and this prolongation remained significant after correcting for heart rate. (F) A 64-electrode Constellation catheter was advanced under fluoroscopic guidance into the LV to measure local endocardial unipolar electrograms. The dashed yellow line marks the border of the ventricular wall. (G) Mapping the endocardial electrograms onto a 2-D polar map shows the global prolongation of endocardial ARI in the LV. (H) Endocardial ARIs significantly prolonged post-TEA. (I) Representative epicardial bipolar electrograms (EGMs) and their corresponding unipolar EGMs from scar, border zone, and viable myocardium. (J-K) Regional ARI analysis demonstrated that the prolongation in ARIs was not limited to viable regions, and similar prolongations observed across scar, border zone, and viable regions of the LV. Pre-TEA vs post-TEA global, regional, and LV-specific ARIs were compared by Student’s paired t-test. Inter-region changes in ARI were compared by repeated-measures ANOVA. Baseline regional dispersion and regional change in dispersion were compared by paired Friedman test with post-hoc correction (non-significant comparisons not shown). N=15 animals for global and regional epicardial data. N=5 for endocardial data.
Figure 4.
Figure 4.. Effects of thoracic epidural anesthesia on ventricular dispersion of repolarization.
(A) Examples of border zone electrograms obtained from one animal showing activation recovery intervals (ARIs) from these regions. Pre-TEA, there is significant variability in border zone ARIs that improves post-TEA. (B-C) Quantified regional data from each animal demonstrates that border zone regions have the greatest dispersion in ARI at baseline, and that TEA specifically mitigates ARI dispersion in border zone regions, without significantly affecting dispersion in scar or viable regions. Change in dispersion (pre-TEA vs post-TEA) were compared by paired Wilcoxon signed rank test. N=15 animals.
Figure 5.
Figure 5.. Effects of thoracic epidural anesthesia on ventricular refractory periods and restitution.
(A) Graphical representation of pacing sites for measurements of effective refractory period (ERP) at the right ventricular (RV) endocardium, RV outflow tract (RVOT, epicardium) and epicardial left ventricular border zone region (LV border). (B) Example of ventricular ERP (VERP) measurements from one animal from the RVOT (pre-TEA), illustrating the last captured beat and the loss of capture after a further reduction in the coupling interval of S2. (C) TEA did not affect the pacing thresholds for ventricular ERP testing but did prolong VERP at the (D) RV endocardium, (E) RVOT, and (F) LV border zone. (G) Notably, the difference in ventricular ERP at the RVOT and LV border zone was greater than the differences in ARIs from these regions pre- vs post-TEA. (H) Local minima and maxima of the dV/dt of the EGM corresponding to site of pacing were assessed to measure the AT and RT of each beat, respectively. The diastolic interval (DI) was calculated as the difference in the RT of the last S1 and the AT of S2 (DI = ATS2 – RTS1). ARI of the S2 beat was calculated as the difference in RT and AT of the S2 (ARIS2 = RTS2 – ATS2). (I) Representative pre- and post-TEA restitution curves derived from pacing from the RVOT at progressively shorter coupling intervals. Maximum slope of the ARI restitution curve (Smax) was significantly decreased post-TEA at both the (J) RVOT and (K) LV border zone. STIM=channel used for stimulation/pacing. Pacing thresholds and electrical restitution (Smax) were compared pre-TEA vs post-TEA by Wilcoxon rank signed test. Pre-TEA vs post-TEA ERPs were compared by Student’s paired t-test. ARI and ERP from the same region were compared by Student’s unpaired t-test. N=10 animals for RV endo and RVOT ERP. N=5 for RVOT electrical restitution. N=4 for pacing threshold, LV border zone ERP and electrical restitution.
Figure 6.
Figure 6.. Effects of thoracic epidural anesthesia on baroreflex sensitivity.
(A) Representative raw trace depicting changes in heart rate (HR) and left ventricular pressure (LVP) upon phenylephrine infusion before and after thoracic epidural anesthesia (TEA). The same dose of phenylephrine was used pre- and post-TEA. (B) Beat-to-beat changes in left ventricular systolic pressure (LVSP) and RR interval were plotted to assess baroreflex sensitivity (BRS) before and after TEA. Although phenylephrine caused (C) a slightly lesser increase in peak systolic pressure after TEA, (D) a greater slowing of heart rate after TEA was observed. (E) BRS, the beat-to-beat relationship between systolic pressure and RR interval, was significantly increased after TEA. Phenylephrine-induced changes in (F) LVSP and (G) heart rate were similar before and after administration of metoprolol (5 mg). (H) Metoprolol did not alter BRS. PE=phenylephrine. Peak change in LVSP and HR pre-intervention vs post-intervention (TEA or metoprolol) was compared by paired Student’s t-test and BRS was compared by paired Wilcoxon signed ranked test, N=10 animals for pre- vs post-TEA. N=6 for pre- vs post-metoprolol.
Figure 7.
Figure 7.. In vivo neural recordings from the ventral interventricular ganglionated plexus (VIVGP).
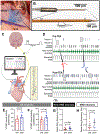
(A) Representative image of VIVGP neural recording during terminal experiments. The left atrial appendage (LA) is retracted to expose the VIVGP (shaded blue region), which encircles the base of the left anterior descending coronary artery (LAD). The right ventricular outflow tract (RVOT) is noted for further anatomical reference. The neural recording electrode is inserted at an oblique angle into the fat pad. Seen below is the 56-electrode sock with a basal electrode noted (E12). (B) Enlarged view of the customized 16-channel linear microelectrode array probe, which was used to record in vivo extracellular action potentials from neurons of the VIVGP. (C) Schematic representation depicting the workflow for identification of VIVGP neurons that receive vagal input. The Skellam test was used to identify neurons significantly responding to VNS. (D) Representative neuronal recordings from the VIVGP demonstrating two postganglionic parasympathetic neurons increasing their firing frequency post-TEA. (E-F) Quantified data showed that, while TEA did not affect bulk firing per second, it increased bulk firing per ventricular beat. (G-H) Furthermore, TEA did not affect the basal activity of neurons that do not respond to VNS (e.g., non-VNS responsive neurons) but did specifically increase the basal activity of neurons that respond to VNS (e.g., postganglionic parasympathetic neurons). Pre-TEA vs post-TEA parameters were compared using Student’s paired t-test. N=6 animals, n=69 neurons.

References

    1. Vaseghi M, Shivkumar K. The role of the autonomic nervous system in sudden cardiac death. Prog Cardiovasc Dis. 2008;50:404–419. doi: 10.1016/j.pcad.2008.01.003 - DOI - PMC - PubMed
    1. Priori SG, Mantica M, Schwartz PJ. Delayed afterdepolarizations elicited in vivo by left stellate ganglion stimulation. Circulation. 1988;78:178–185. doi: 10.1161/01.cir.78.1.178 - DOI - PubMed
    1. Opthof T, Misier AR, Coronel R, Vermeulen JT, Verberne HJ, Frank RG, Moulijn AC, van Capelle FJ, Janse MJ. Dispersion of refractoriness in canine ventricular myocardium. Effects of sympathetic stimulation. Circ Res. 1991;68:1204–1215. doi: 10.1161/01.res.68.5.1204 - DOI - PubMed
    1. Ng GA, Brack KE, Patel VH, Coote JH. Autonomic modulation of electrical restitution, alternans and ventricular fibrillation initiation in the isolated heart. Cardiovasc Res. 2007;73:750–760. doi: 10.1016/j.cardiores.2006.12.001 - DOI - PubMed
    1. Shivkumar K, Ajijola OA, Anand I, Armour JA, Chen PS, Esler M, De Ferrari GM, Fishbein MC, Goldberger JJ, Harper RM, et al. Clinical neurocardiology defining the value of neuroscience-based cardiovascular therapeutics. J Physiol. 2016;594:3911–3954. doi: 10.1113/JP271870 - DOI - PMC - PubMed

MeSH terms