

Epidemiological topology data analysis links severe COVID-19 to RAAS and hyperlipidemia associated metabolic syndrome conditions
- PMID: 38940159
- PMCID: PMC11211822
- DOI: 10.1093/bioinformatics/btae235
Epidemiological topology data analysis links severe COVID-19 to RAAS and hyperlipidemia associated metabolic syndrome conditions
Abstract
Motivation: The emergence of COVID-19 (C19) created incredible worldwide challenges but offers unique opportunities to understand the physiology of its risk factors and their interactions with complex disease conditions, such as metabolic syndrome. To address the challenges of discovering clinically relevant interactions, we employed a unique approach for epidemiological analysis powered by redescription-based topological data analysis (RTDA).
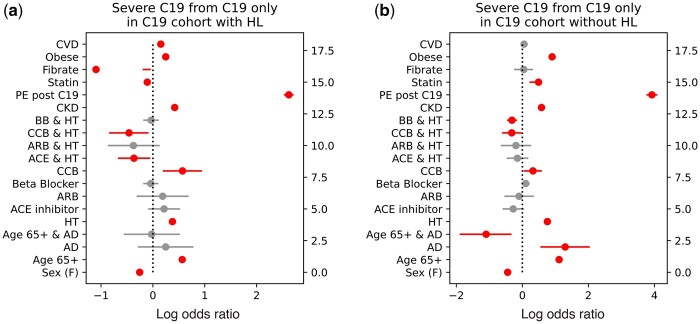
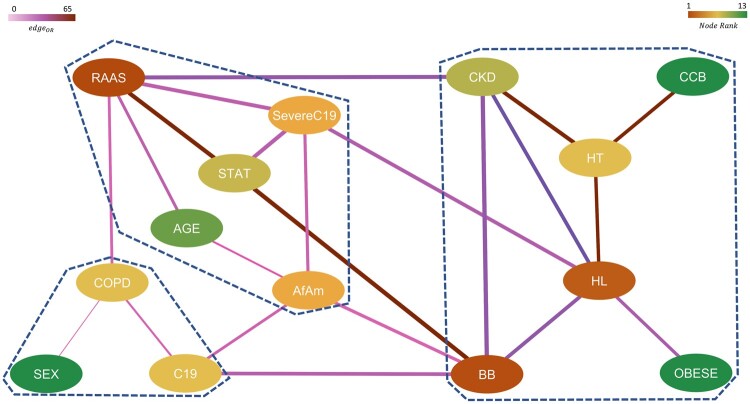
Results: Here, RTDA was applied to Explorys data to discover associations among severe C19 and metabolic syndrome. This approach was able to further explore the probative value of drug prescriptions to capture the involvement of RAAS and hypertension with C19, as well as modification of risk factor impact by hyperlipidemia (HL) on severe C19. RTDA found higher-order relationships between RAAS pathway and severe C19 along with demographic variables of age, gender, and comorbidities such as obesity, statin prescriptions, HL, chronic kidney failure, and disproportionately affecting Black individuals. RTDA combined with CuNA (cumulant-based network analysis) yielded a higher-order interaction network derived from cumulants that furthered supported the central role that RAAS plays. TDA techniques can provide a novel outlook beyond typical logistic regressions in epidemiology. From an observational cohort of electronic medical records, it can find out how RAAS drugs interact with comorbidities, such as hypertension and HL, of patients with severe bouts of C19. Where single variable association tests with outcome can struggle, TDA's higher-order interaction network between different variables enables the discovery of the comorbidities of a disease such as C19 work in concert.
Availability and implementation: Code for performing TDA/RTDA is available in https://github.com/IBM/Matilda and code for CuNA can be found in https://github.com/BiomedSciAI/Geno4SD/.
Supplementary information: Supplementary data are available at Bioinformatics online.
© The Author(s) 2024. Published by Oxford University Press.
Conflict of interest statement
No competing interest is declared.
Figures
Similar articles
-
Association of Renin-angiotensin-aldosterone System Inhibitors With Coronavirus Disease 2019 (COVID-19)- Related Outcomes in Korea: A Nationwide Population-based Cohort Study.Clin Infect Dis. 2020 Nov 19;71(16):2121-2128. doi: 10.1093/cid/ciaa624. Clin Infect Dis. 2020. PMID: 32442285 Free PMC article.
-
Association Between Renin-Angiotensin-Aldosterone System Inhibitors and COVID-19 Infection in South Korea.Hypertension. 2020 Sep;76(3):742-749. doi: 10.1161/HYPERTENSIONAHA.120.15464. Epub 2020 Jul 13. Hypertension. 2020. PMID: 32654557
-
Use of renin-angiotensin-aldosterone system inhibitors and risk of COVID-19 requiring admission to hospital: a case-population study.Lancet. 2020 May 30;395(10238):1705-1714. doi: 10.1016/S0140-6736(20)31030-8. Epub 2020 May 14. Lancet. 2020. PMID: 32416785 Free PMC article.
-
Angiotensin-converting enzyme 2 (ACE2), SARS-CoV-2 and the pathophysiology of coronavirus disease 2019 (COVID-19).J Pathol. 2020 Jul;251(3):228-248. doi: 10.1002/path.5471. Epub 2020 Jun 10. J Pathol. 2020. PMID: 32418199 Free PMC article. Review.
-
Understanding the renin-angiotensin-aldosterone-SARS-CoV axis: a comprehensive review.Eur Respir J. 2020 Jul 9;56(1):2000912. doi: 10.1183/13993003.00912-2020. Print 2020 Jul. Eur Respir J. 2020. PMID: 32341103 Free PMC article. Review.
Cited by
-
Topological data analysis captures horizontal gene transfer in antimicrobial resistance gene families among clinically relevant bacteria.Front Microbiol. 2025 May 7;16:1461293. doi: 10.3389/fmicb.2025.1461293. eCollection 2025. Front Microbiol. 2025. PMID: 40400687 Free PMC article.
References
-
- Bose A, Platt DE, Haiminen N. et al. CuNA: Cumulant-based network analysis of genotype-phenotype associations in parkinson’s disease. medRxiv2021. https://www.medrxiv.org/content/10.1101/2021.08.02.21261457v1. - DOI
-
- Carlsson G. Topology and data. Bull Amer Math Soc 2009;46:255–308.
Publication types
MeSH terms
Grants and funding
LinkOut - more resources
Full Text Sources
Medical
