

Characteristics of gut microbiota and serum metabolism in patients with atopic dermatitis
- PMID: 38940462
- PMCID: PMC11212066
- DOI: 10.1111/srt.13792
Characteristics of gut microbiota and serum metabolism in patients with atopic dermatitis
Abstract
Background: Atopic dermatitis (AD) is a chronic inflammatory skin disease that affects 15%-30% of children and 10% of adults globally, with its incidence being influenced by genetic, environmental, and various other factors. While the immune plays a crucial role in the development, the composition of gut microbiota and serum metabolites also contribute to its pathogenesis.
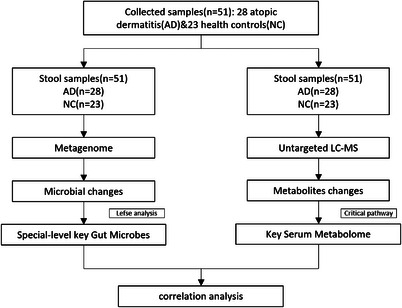
Subject: Study the characteristics of gut microbiota and serum metabolites in patients with atopic dermatitis METHOD: In this study, we collected stool and serum samples from 28 AD patients and 23 healthy individuals (NC) for metagenomic sequencing of gut microbiota and non-targeted metabolomic sequencing of serum.
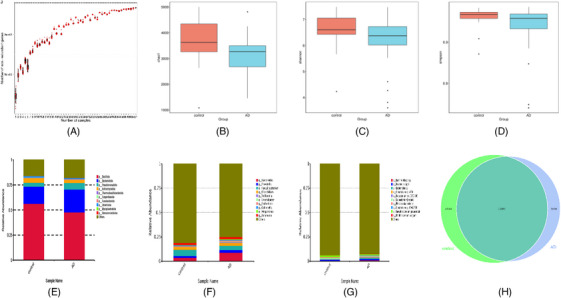
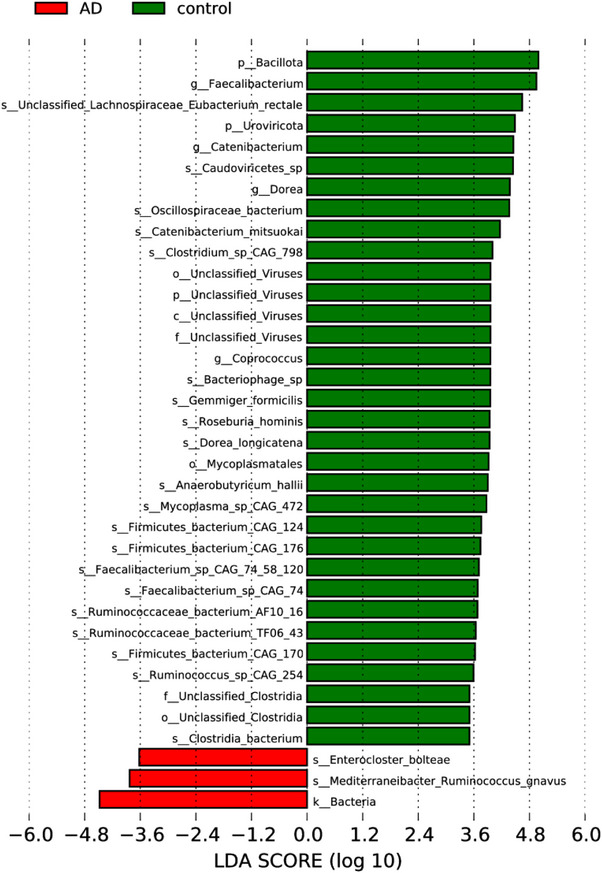
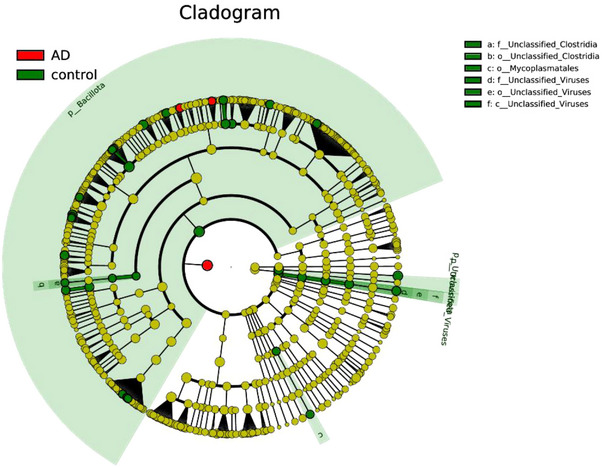
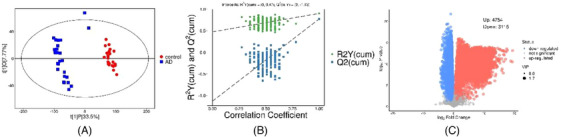
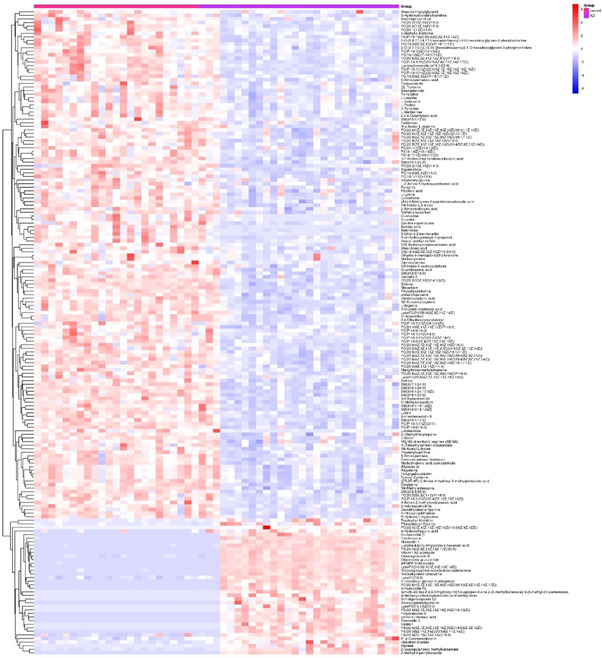
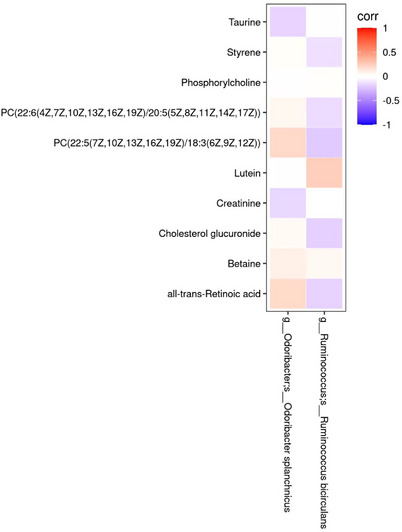
Result: Our results revealed a lower diversity of gut microbiota in the AD group compared to the NC group. The predominant Phylum in AD patients were Bacteroidetes, Pseudomonas, and Verrucomicrobia, with the most dominant bacterial genus being Faecalibacterium. At the species level, Prevotella copri and Faecalibacterium prausnitzii were found to be the most abundant bacteria. Significant differences in serum metabolite profiles were observed between NC and AD patients, with noticeable variations in metabolite expression levels. The majority of metabolites in the serum of AD patients exhibited low expression, while a few showed high expression levels. Notably, metabolites such as Cholesterol glucuronide, Styrene, Lutein, Betaine, Phosphorylcholine, Taurine, and Creatinine displayed the most pronounced alterations.
Conclusion: These findings contribute to a further understanding of the complexities underlying this disease.
Keywords: atopic dermatitis; gut microbiota; metagenomics.
© 2024 The Author(s). Skin Research and Technology published by John Wiley & Sons Ltd.
Conflict of interest statement
The authors declare no conflicts of interest.
Figures
Similar articles
-
Faecalibacterium prausnitzii subspecies-level dysbiosis in the human gut microbiome underlying atopic dermatitis.J Allergy Clin Immunol. 2016 Mar;137(3):852-60. doi: 10.1016/j.jaci.2015.08.021. Epub 2015 Oct 1. J Allergy Clin Immunol. 2016. PMID: 26431583
-
Investigating Distinct Skin Microbial Communities and Skin Metabolome Profiles in Atopic Dermatitis.Int J Mol Sci. 2024 May 10;25(10):5211. doi: 10.3390/ijms25105211. Int J Mol Sci. 2024. PMID: 38791249 Free PMC article.
-
Study of The specificity of gut microbiota in adult patients with delayed-onset of atopic dermatitis.Allergol Immunopathol (Madr). 2022 Nov 1;50(6):128-136. doi: 10.15586/aei.v50i6.705. eCollection 2022. Allergol Immunopathol (Madr). 2022. PMID: 36335456
-
The Role of the Microbiota in the Pathogenesis and Treatment of Atopic Dermatitis-A Literature Review.Int J Mol Sci. 2024 Jun 13;25(12):6539. doi: 10.3390/ijms25126539. Int J Mol Sci. 2024. PMID: 38928245 Free PMC article. Review.
-
Atopic dermatitis: Pathophysiology, microbiota, and metabolome - A comprehensive review.Microbiol Res. 2024 Apr;281:127595. doi: 10.1016/j.micres.2023.127595. Epub 2024 Jan 3. Microbiol Res. 2024. PMID: 38218095 Review.
Cited by
-
Interleukin-4 and Atopic Dermatitis: Why Does it Matter? A Narrative Review.Dermatol Ther (Heidelb). 2025 Mar;15(3):579-597. doi: 10.1007/s13555-025-01352-y. Epub 2025 Feb 10. Dermatol Ther (Heidelb). 2025. PMID: 39930311 Free PMC article. Review.
-
Impact of oral immunotherapy on diversity of gut microbiota in food-allergic children.Pediatr Allergy Immunol. 2025 Aug;36(8):e70156. doi: 10.1111/pai.70156. Pediatr Allergy Immunol. 2025. PMID: 40747641 Free PMC article.
-
Gut microbiota constituents may affect hypertrophic scarring risk through interaction with specific immune cells in a two-step, two-sample Mendelian randomization study.Sci Rep. 2025 Jul 1;15(1):20656. doi: 10.1038/s41598-025-07455-y. Sci Rep. 2025. PMID: 40596527 Free PMC article.
References
MeSH terms
Grants and funding
LinkOut - more resources
Full Text Sources
Medical
