. 2024 Oct;416(25):5485-5496.
doi: 10.1007/s00216-024-05404-8. Epub 2024 Jun 28.

Cohort-based strategies as an in-house tool to evaluate and improve phenotyping robustness of LC-MS/MS lipidomics platforms

Affiliations

Cohort-based strategies as an in-house tool to evaluate and improve phenotyping robustness of LC-MS/MS lipidomics platforms

Benedikt Zöhrer et al. Anal Bioanal Chem. 2024 Oct.

Abstract

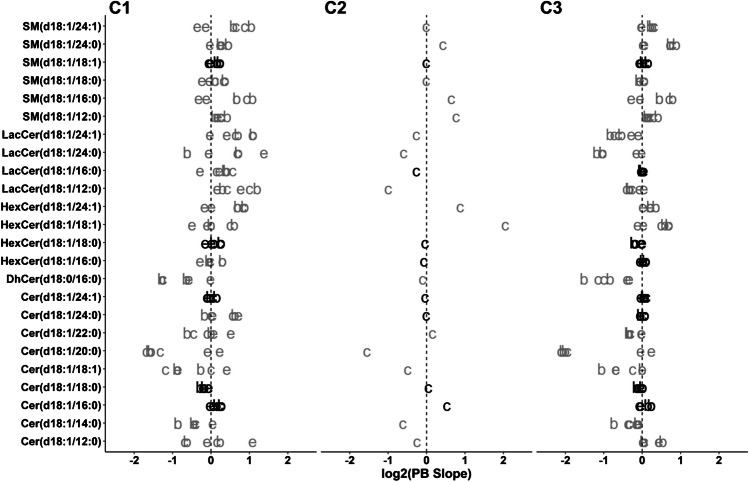
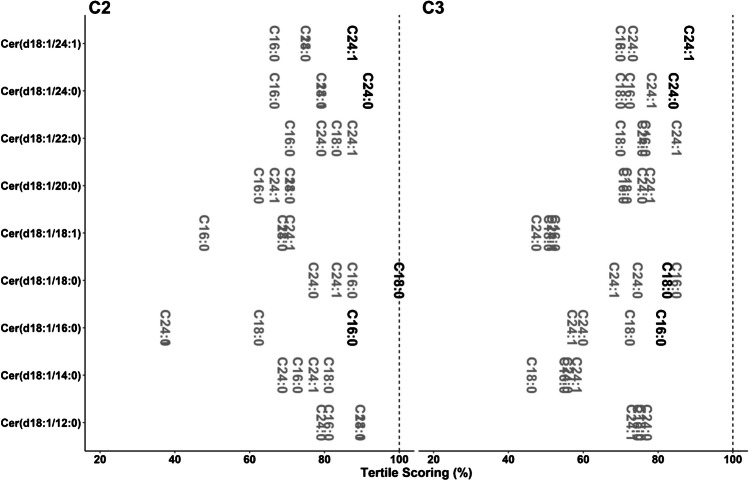
In recent years, instrumental improvements have enabled the spread of mass spectrometry-based lipidomics platforms in biomedical research. In mass spectrometry, the reliability of generated data varies for each compound, contingent on, among other factors, the availability of labeled internal standards. It is challenging to evaluate the data for lipids without specific labeled internal standards, especially when dozens to hundreds of lipids are measured simultaneously. Thus, evaluation of the performance of these platforms at the individual lipid level in interlaboratory studies is generally not feasible in a time-effective manner. Herein, using a focused subset of sphingolipids, we present an in-house validation methodology for individual lipid reliability assessment, tailored to the statistical analysis to be applied. Moreover, this approach enables the evaluation of various methodological aspects, including discerning coelutions sharing identical selected reaction monitoring transitions, pinpointing optimal labeled internal standards and their concentrations, and evaluating different extraction techniques. While the full validation according to analytical guidelines for all lipids included in a lipidomics method is currently not possible, this process shows areas to focus on for subsequent method development iterations as well as the robustness of data generated across diverse methodologies.

Keywords: Bioanalytical methods; LC-MS/MS; Lipidomics; Sphingolipids.


Conflict of interest statement

The authors declare no competing interests.

Figures

Fig. 1
Fig. 1
Passing-Bablok regression slopes for all possible method comparisons for C1, C2, and C3. Slopes are depicted as log2 so that the deviation of the ideal slope of log2 (1) = 0 represents comparable changes in either direction. Letters represent the change between the compared methods (c, column; e, extraction; b, both). For C2, no comparison of extraction was performed. Compounds quantified with their own LIS are presented in black. Dashed vertical line represents the value where calculated concentrations are the same
Fig. 2
Fig. 2
Spearman’s correlation for all possible method comparisons for C1, C2, and C3. Letters represent the change during the analyses (c, column; e, extraction; b, both). For C2, no comparison of extraction was performed. Compounds quantified with their own LIS are presented in black. Dashed vertical line represents the maximum value
Fig. 3
Fig. 3
Tertile scoring for all possible method comparisons for C1, C2, and C3. Letters represent the change during the analyses (c, column; e, extraction; b, both). For C2, no comparison of extraction was performed. Compounds quantified with their own LIS are presented in black. Dashed vertical line represents the maximum value
Fig. 4
Fig. 4
Spearman’s correlation for all possible combinations of ceramide/LIS for C2 and C3. Text represents the acyl chain of the d7-labeled internal standard used for the quantification. For C3, results are presented as the average value per compound/LIS obtained for all six possible comparisons (2 extractions × 2 chromatographic separations). For individual values, see Table S10 (ESM 2). Values calculated using the own LIS was used are presented in black. Dashed vertical line represents the maximum value
Fig. 5
Fig. 5
Tertile scoring for all possible method comparisons for C2 and C3. Text represents the acyl chain of the d7-LIS used for the quantification. Results are presented as the average value per compound/LIS obtained for all the injected methods (n = 2 and 4, respectively). For individual values, see Table S10 (ESM 2). Results where the own LIS was used are presented in black. Dashed vertical line represents the maximum value
Fig. 6
Fig. 6
Spearman’s correlation for the comparison between Zorbax C18 and CSH C18 LC-MS/MS methods after the application of the workflow. Only compounds included in both methodologies are shown. Compounds which are quantified on their own labeled internal standard are depicted in black

References

    1. Nemet I, Saha PP, Gupta N, Zhu W, Romano KA, Skye SM, et al. A cardiovascular disease-linked gut microbial metabolite acts via adrenergic receptors. Cell. 2020;180(5):862–77 e22. - PMC - PubMed
    1. Akawi N, Checa A, Antonopoulos AS, Akoumianakis I, Daskalaki E, Kotanidis CP, et al. Fat-secreted ceramides regulate vascular redox state and influence outcomes in patients with cardiovascular disease. J Am Coll Cardiol. 2021;77(20):2494–513. - PMC - PubMed
    1. Scerri TS, Quaglieri A, Cai C, Zernant J, Matsunami N, Baird L, et al. Genome-wide analyses identify common variants associated with macular telangiectasia type 2. Nat Genet. 2017;49(4):559–67. - PubMed
    1. Subburaj D, Ng B, Kariminia A, Abdossamadi S, Lauener M, Nemecek ER, et al. Metabolomic identification of alpha-ketoglutaric acid elevation in pediatric chronic graft-versus-host disease. Blood. 2022;139(2):287–99. - PubMed
    1. Vogeser M, Seger C. Pitfalls associated with the use of liquid chromatography-tandem mass spectrometry in the clinical laboratory. Clin Chem. 2010;56(8):1234–44. - PubMed

LinkOut - more resources