. 2025 Apr;480(4):2301-2330.
doi: 10.1007/s11010-024-05039-4. Epub 2024 Jun 28.

Early-life bisphenol A exposure causes neuronal pyroptosis in juvenile and adult male rats through the NF-κB/IL-1β/NLRP3/caspase-1 signaling pathway: exploration of age and dose as effective covariates using an in vivo and in silico modeling approach

Affiliations

Early-life bisphenol A exposure causes neuronal pyroptosis in juvenile and adult male rats through the NF-κB/IL-1β/NLRP3/caspase-1 signaling pathway: exploration of age and dose as effective covariates using an in vivo and in silico modeling approach

Ahmed S Al-Shami et al. Mol Cell Biochem. 2025 Apr.

Abstract

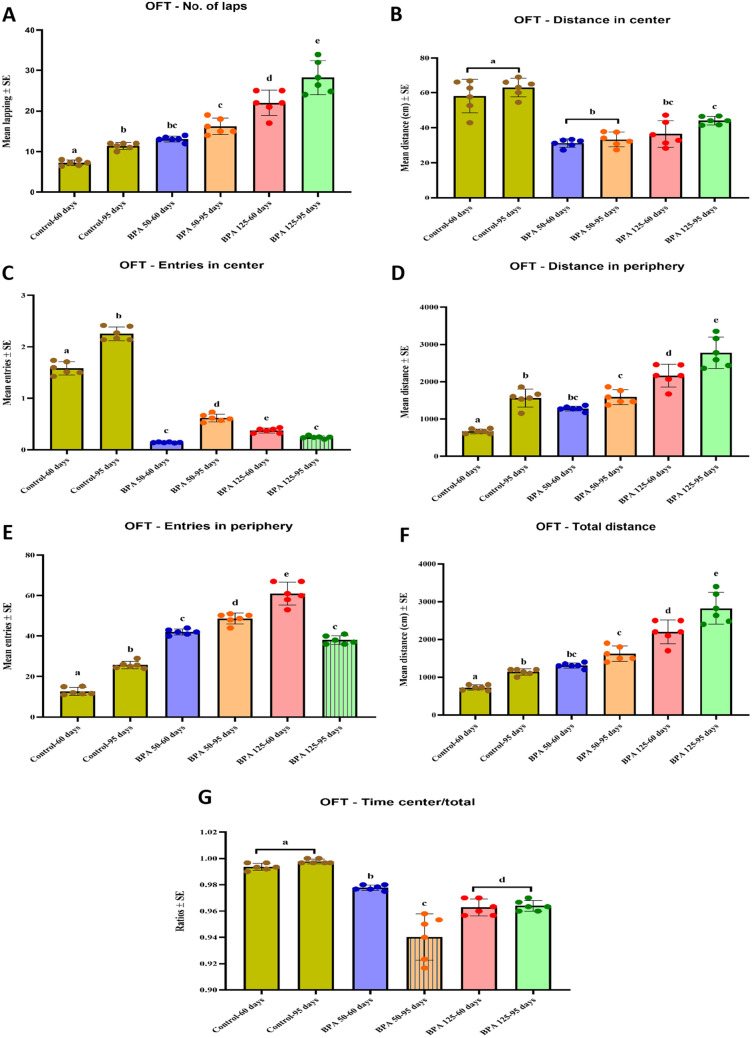
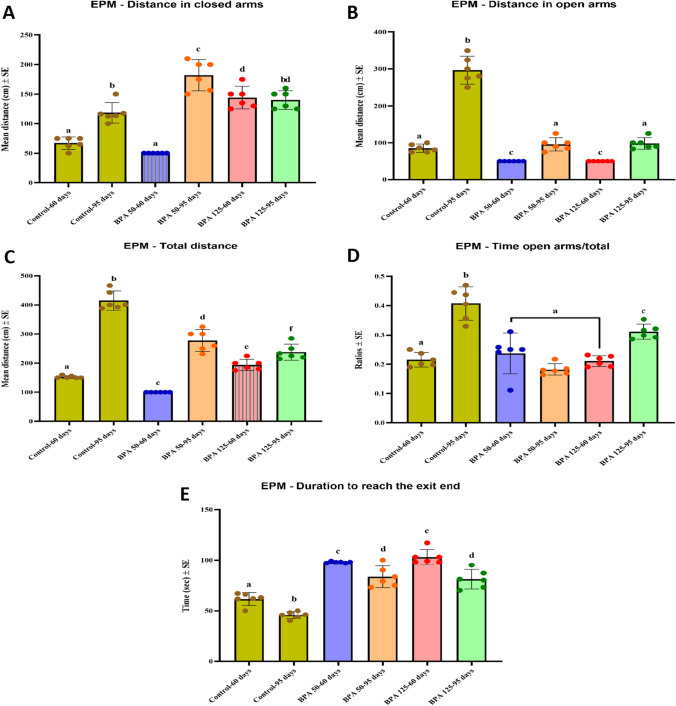
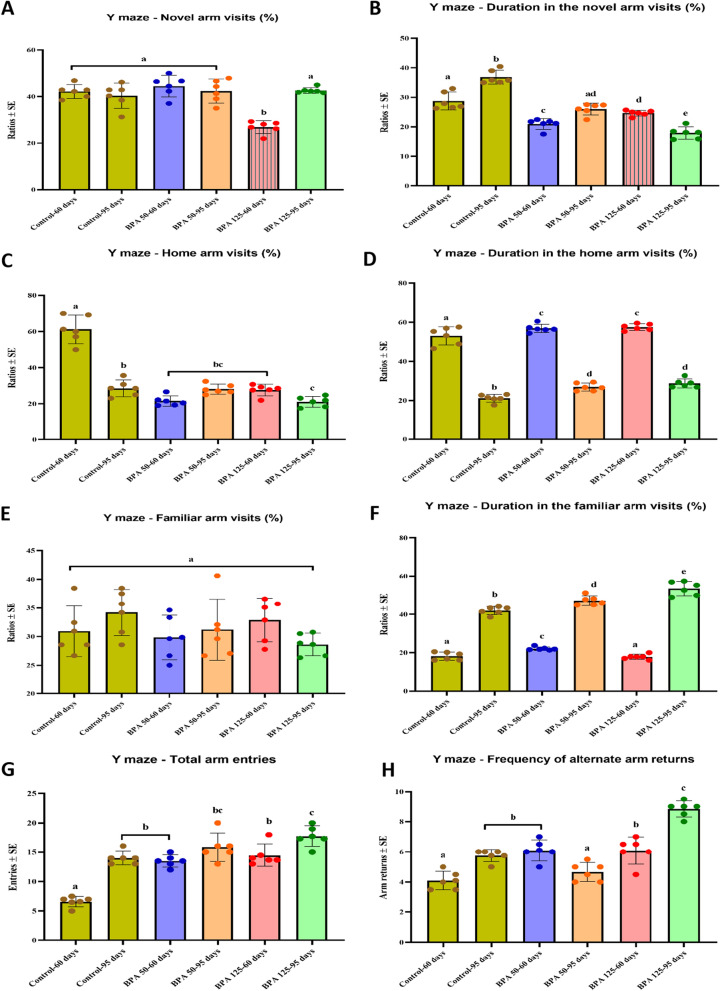
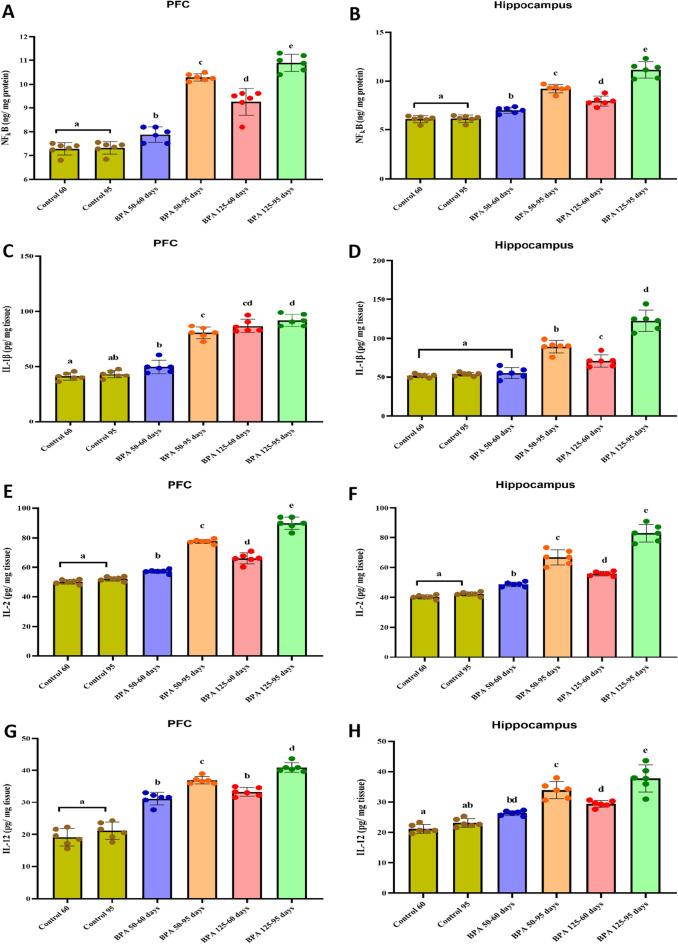
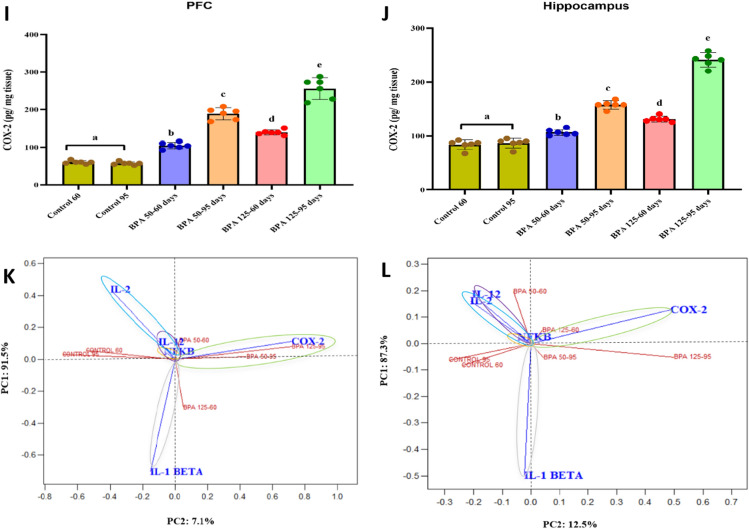
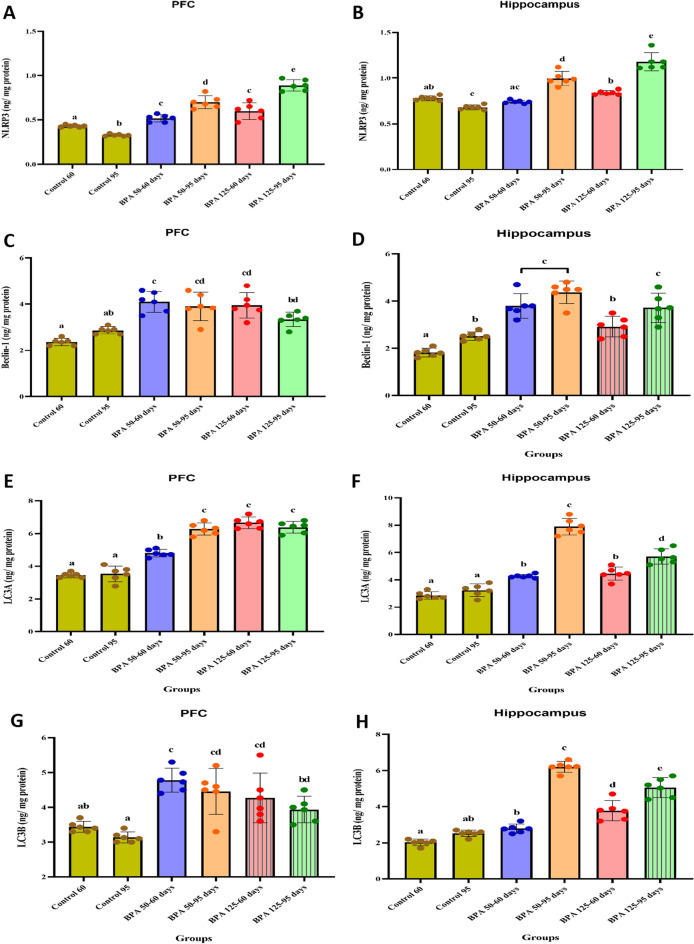
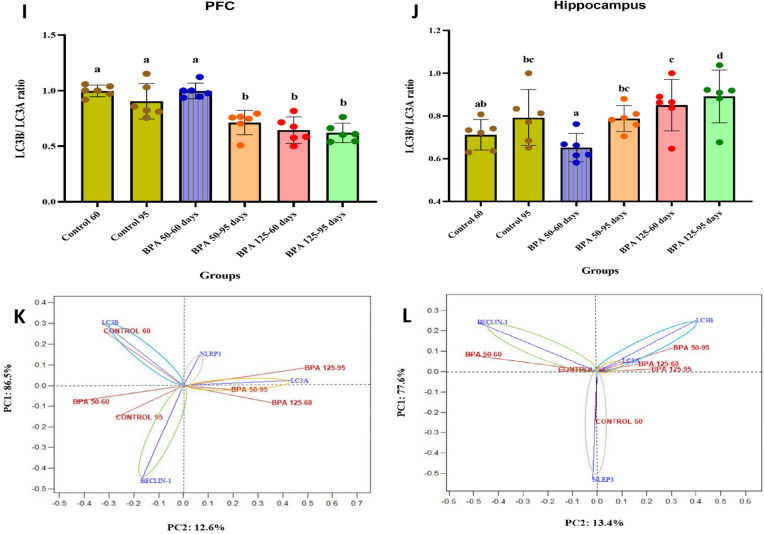
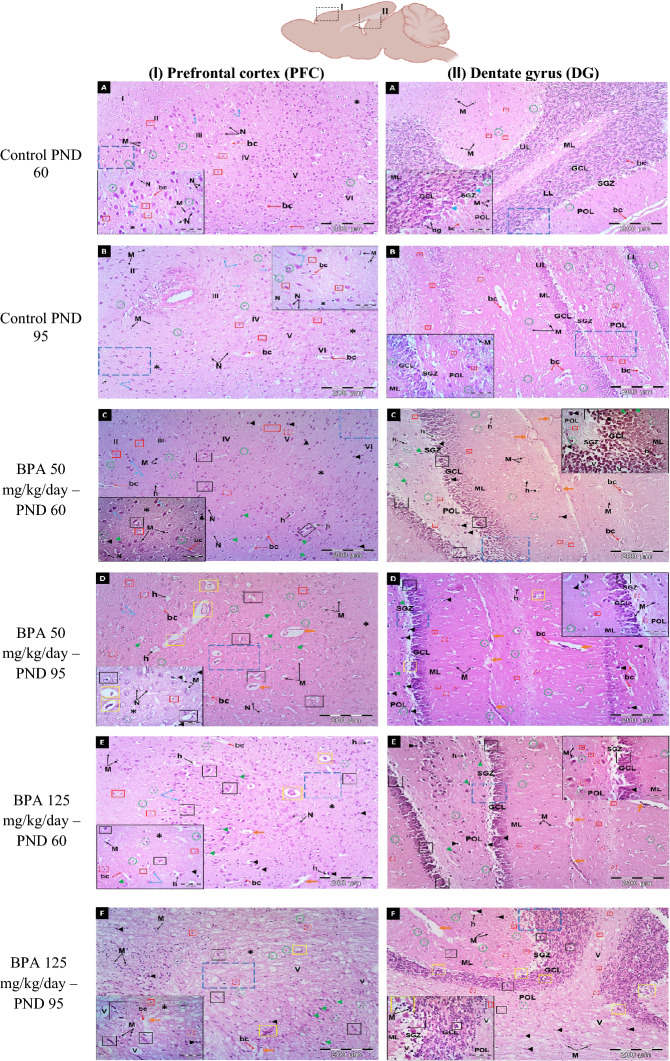
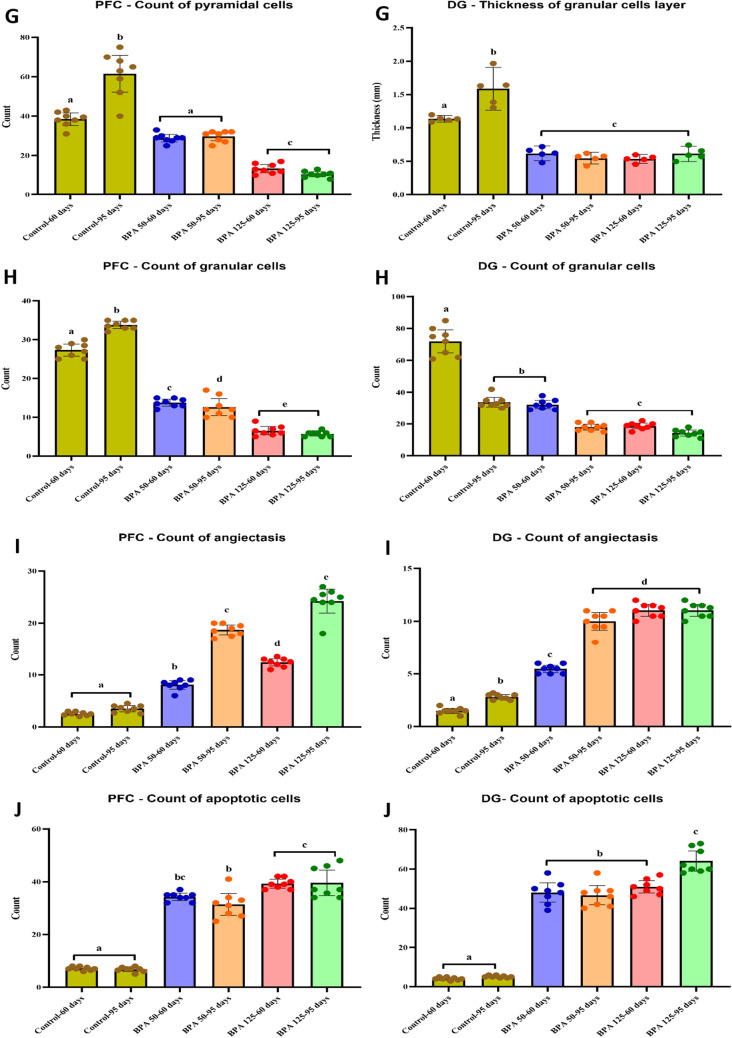
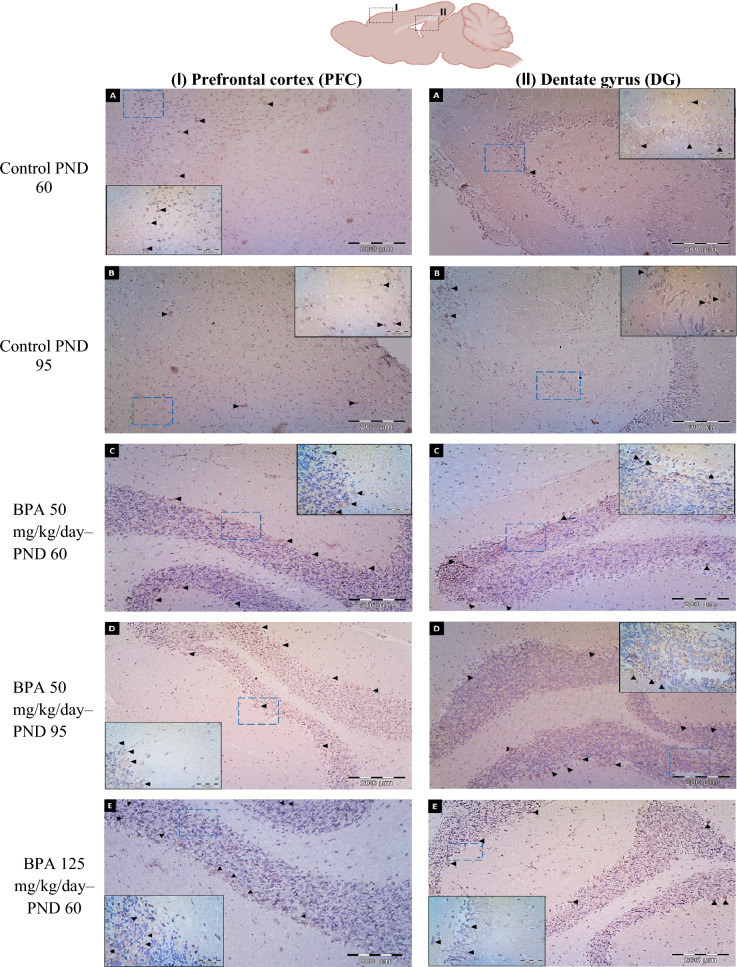
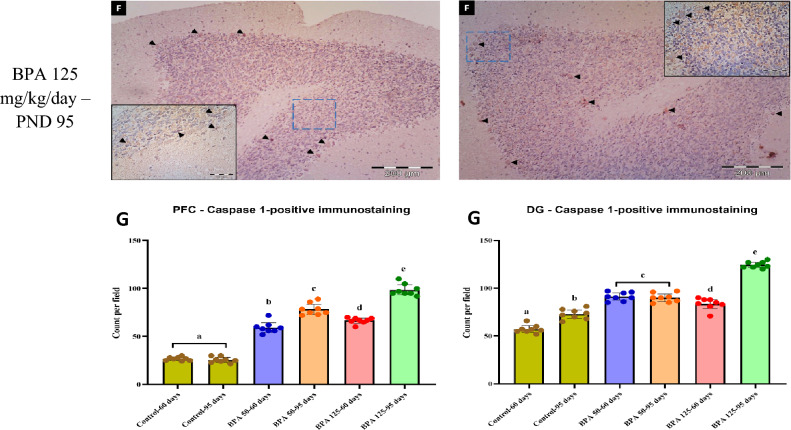
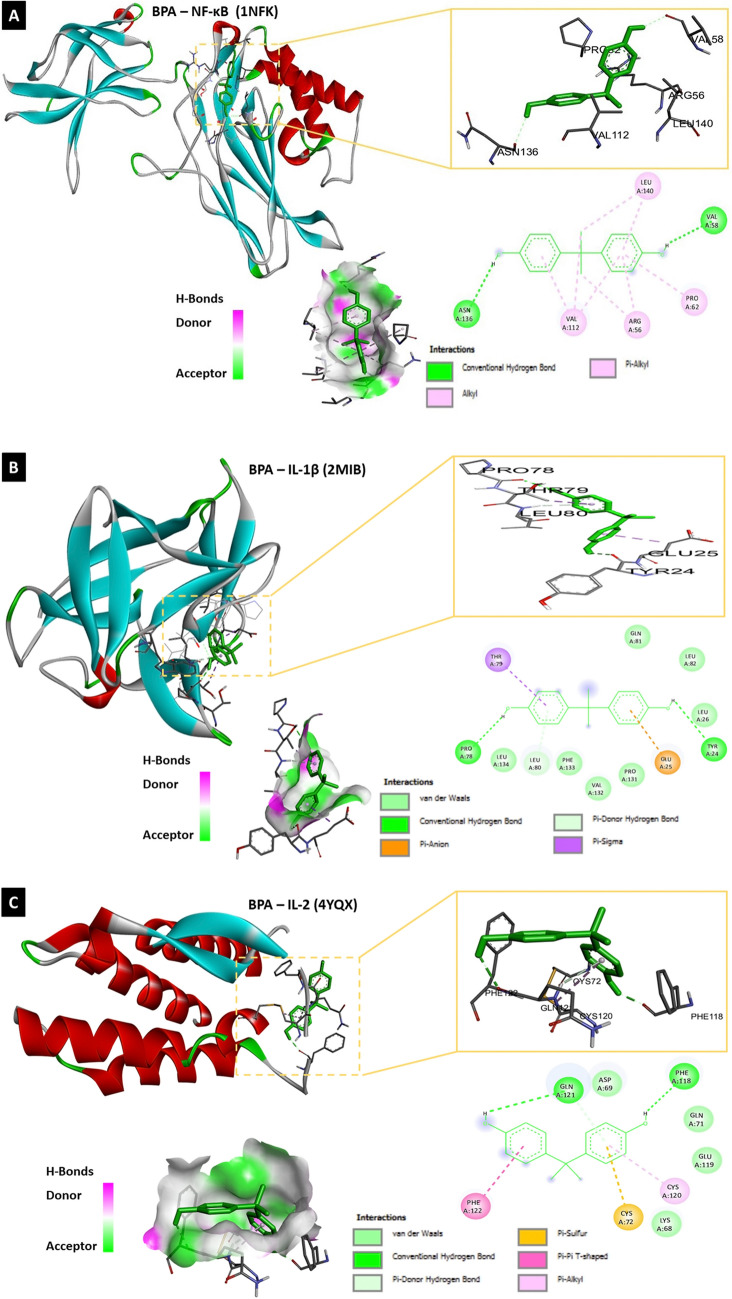
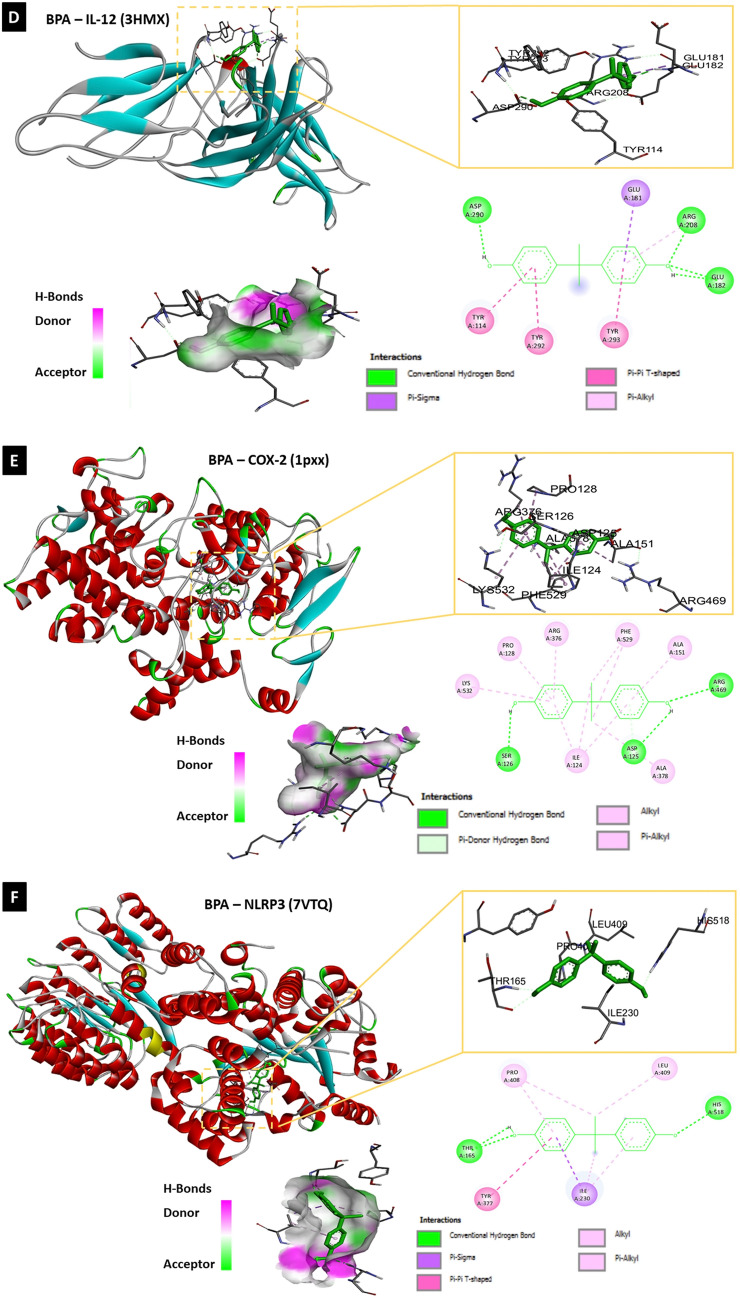
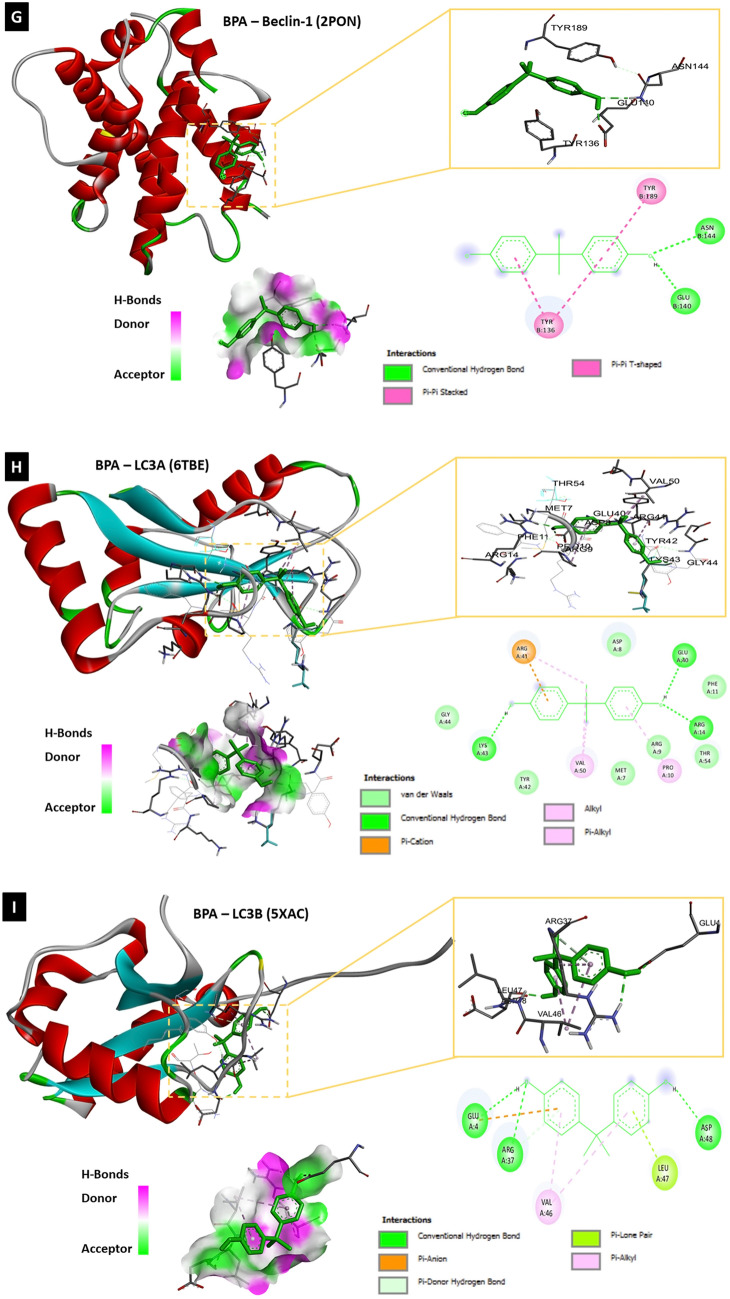
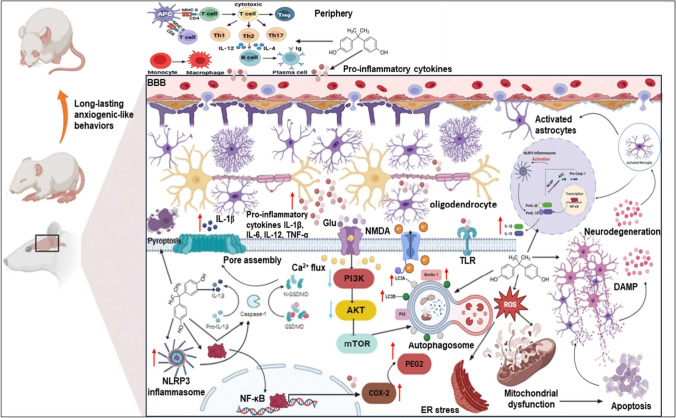
Bisphenol A (BPA), a common endocrine-disrupting chemical, is found in a wide range of home plastics. Early-life BPA exposure has been linked to neurodevelopmental disorders; however, the link between neuroinflammation, pyroptosis, and the development of psychiatric disorders is rarely studied. The current study attempted to investigate the toxic effect of BPA on inflammatory and microglial activation markers, as well as behavioral responses, in the brains of male rats in a dose- and age-dependent manner. Early BPA exposure began on postnatal day (PND) 18 at dosages of 50 and 125 mg/kg/day. We started with a battery of behavioral activities, including open field, elevated plus- and Y-maze tests, performed on young PND 60 rats and adult PND 95 rats. BPA causes anxiogenic-related behaviors, as well as cognitive and memory deficits. The in vivo and in silico analyses revealed for the first time that BPA is a substantial activator of nuclear factor kappa B (NF-κB), interleukin (IL)-1β, -2, -12, cyclooxygenase-2, and the NOD-like receptor family pyrin domain-containing 3 (NLRP3) inflammasome, with higher beclin-1 and LC3B levels in BPA rats' PFC and hippocampus. Furthermore, BPA increased the co-localization of caspase-1 immunoreactive neurons, as well as unique neurodegenerative histopathological hallmarks. In conclusion, our results support the hypothesis that neuroinflammation and microglial activation are involved with changes in the brain after postnatal BPA exposure and that these alterations may be linked to the development of psychiatric conditions later in life. Collectively, our findings indicate that BPA triggers anxiety-like behaviors and pyroptotic death of nerve cells via the NF-κB/IL-1β/NLRP3/Caspase-1 pathway.

Keywords: Anxiety; Early BPA exposure; Juvenile and adult ages; NF-kB/IL-1β/NLRP3/Caspase-1 pathway; Neuroinflammation; Pyroptosis.


Conflict of interest statement

Declarations. Conflict of interest: The authors declare there is no conflict of interest. authors declare no competing interests. Ethical approval: This article does not contain any studies with human. Experimental protocols and animal handling procedures were approved by Alexandria University Institutional Animal Care and Use Committee (ALEXU-IACUC), a member of the International Council for Laboratory Animal Science (ICLAS) (Approval number: AU14-22–1003-2–5). Consent to participate: Not applicable. Consent for publication: All authors have agreed to publish this manuscript.

Figures

Fig. 1
Fig. 1
Effect of postnatal BPA exposure on the performance of PND60 and PND95 male rats in the OFT A number of laps, B Distance in the center, C Distance in the periphery, D Total distance, E Number of entries in center zone, F Number of entries in periphery, G Time center/total time The results are expressed as the mean ± SE (n = 6 rats/group). Groups with different superscript letters means there is a significant change between them at P < 0.05. Statistical significance test for comparison was done by MANOVA, followed by post hoc Tukey’s HSD multiple comparison test
Fig. 2
Fig. 2
Effect of postnatal BPA exposure on the performance of PND60 and PND95 male rats in the EPM. A Distance in the closed arm, B distance in the open arm, C total distance, D time in the open arm/total time, E duration to reach the exit end. The results are expressed as the mean ± SE (n = 6 rats/group). Groups with different superscript letters means there is a significant change between them at P < 0.05. Statistical significance test for comparison was done by MANOVA, followed by post hoc Tukey’s HSD multiple comparison test
Fig. 3
Fig. 3
Effect of postnatal BPA exposure on the on the behavioral performance of PND60 and PND95 male rats in the Y-maze test. A Novel arm visits %, B duration in the novel arm %, C home arm visits %, D duration in the home arm, E familiar arm visits %, F duration in the familiar arm %, G total arm entries, H frequency of alternate arm returns. The results are expressed as the mean ± SE (n = 6 rats/group). Groups with different superscript letters means there is a significant change between them at P < 0.05. Statistical significance test for comparison was done by MANOVA, followed by post hoc Tukey’s HSD multiple comparison test
Fig. 4
Fig. 4
Effect of postnatal exposure to BPA (50 and 125 mg/kg/day) on the expression level of NF-kB (A and B), IL-1β (C and D), IL-2 (E and F), IL-12 (G and H), COX-2 (I and J) in the PFC and hippocampusof PND60 and PND95 male rats. Inflammatory markers for each dose and age plotted on axes 1 and 2 of a Principal Coordinates (PCO) graph by computing the distance between centroids based on the groups in the PFC and hippocampus (K and L). The results are expressed as the mean ± SE (n = 6 rats/group). Groups with different superscript letters means there is a significant change between them at P < 0.05. Statistical significance test for comparison was done by MANOVA, followed by post hoc Tukey’s HSD multiple comparison test
Fig. 4
Fig. 4
Effect of postnatal exposure to BPA (50 and 125 mg/kg/day) on the expression level of NF-kB (A and B), IL-1β (C and D), IL-2 (E and F), IL-12 (G and H), COX-2 (I and J) in the PFC and hippocampusof PND60 and PND95 male rats. Inflammatory markers for each dose and age plotted on axes 1 and 2 of a Principal Coordinates (PCO) graph by computing the distance between centroids based on the groups in the PFC and hippocampus (K and L). The results are expressed as the mean ± SE (n = 6 rats/group). Groups with different superscript letters means there is a significant change between them at P < 0.05. Statistical significance test for comparison was done by MANOVA, followed by post hoc Tukey’s HSD multiple comparison test
Fig. 5
Fig. 5
Effect of postnatal exposure to BPA (50 and 125 mg/kg/day) on the expression level of NLRP3 (A and B), Beclin-1 (C and D), LC3A (E and F), LC3B (G and H), and LC3B/LC3A ration (I and J) in the PFC and hippocampusof PND60 and PND95 male rats. Autophagy markers for each dose and age plotted on axes 1 and 2 of a Principal Coordinates (PCO) graph by computing the distance between centroids based on the groups in the PFC and hippocampus (K and L). The results are expressed as the mean ± SE (n = 6 rats/group). Groups with different superscript letters means there is a significant change between them at P < 0.05. Statistical significance test for comparison was done by MANOVA, followed by post hoc Tukey’s HSD multiple comparison test
Fig. 5
Fig. 5
Effect of postnatal exposure to BPA (50 and 125 mg/kg/day) on the expression level of NLRP3 (A and B), Beclin-1 (C and D), LC3A (E and F), LC3B (G and H), and LC3B/LC3A ration (I and J) in the PFC and hippocampusof PND60 and PND95 male rats. Autophagy markers for each dose and age plotted on axes 1 and 2 of a Principal Coordinates (PCO) graph by computing the distance between centroids based on the groups in the PFC and hippocampus (K and L). The results are expressed as the mean ± SE (n = 6 rats/group). Groups with different superscript letters means there is a significant change between them at P < 0.05. Statistical significance test for comparison was done by MANOVA, followed by post hoc Tukey’s HSD multiple comparison test
Fig. 6
Fig. 6
Representative photomicrograps of H&E stained coronal sections at the prefrontral cortex (PFC) and Dentate gyrus (DG) of rats in the six experimental groups: A Control PND 60, B Control PND 95, C BPA 50-PND 60, D BPA 50-PND 95, E BPA 125-PND 60, F BPA 125-PND 95, G count of pyramidal cells in PFC and thickness of GCL in DG, H count of granular cells, I count of angiectasis, J count of apoptotic cells, K relative area of inflammation, L relative area of neuronal loss. Abbreviations and symbols I Molecular layer, II External granular layer, III External pyramidal layer, IV Internal granular layer, V Internal pyramidal layer, VI Polymorphic (multiform) layer, ML molecular layer of DG, POL polymorphic layer, GCL granular cell layer, SGZ subgranular zone, UL upper limb of DG, LL lower limb, bc and red arrow blood capillary, N larger neuronal cell bodies with vesicular open face nuclei, M microglial cell, h pericellular halo, V vacuole, asterisk neuropile, blue arrow pyramidal cell, green arrow head flame-like cell with pointed end, black arrow head pyknotic cell, orange arrow angiectasis, black square neuronal degeneration, yellow square neurophagia, red square astrocyte, dashed red square degenerated astrocyte, green circle oligodendrocyte, dashed green circle degenerated oligodendrocyte. The blue dashed square indicated the area of magnification. The results are expressed as the mean ± SE (n = 8 fields/group). Groups with different superscript letters means there is a significant change between them at P < 0.05. Statistical significance test for comparison was done by MANOVA, followed by post hoc Tukey’s HSD multiple comparison test
Fig. 6
Fig. 6
Representative photomicrograps of H&E stained coronal sections at the prefrontral cortex (PFC) and Dentate gyrus (DG) of rats in the six experimental groups: A Control PND 60, B Control PND 95, C BPA 50-PND 60, D BPA 50-PND 95, E BPA 125-PND 60, F BPA 125-PND 95, G count of pyramidal cells in PFC and thickness of GCL in DG, H count of granular cells, I count of angiectasis, J count of apoptotic cells, K relative area of inflammation, L relative area of neuronal loss. Abbreviations and symbols I Molecular layer, II External granular layer, III External pyramidal layer, IV Internal granular layer, V Internal pyramidal layer, VI Polymorphic (multiform) layer, ML molecular layer of DG, POL polymorphic layer, GCL granular cell layer, SGZ subgranular zone, UL upper limb of DG, LL lower limb, bc and red arrow blood capillary, N larger neuronal cell bodies with vesicular open face nuclei, M microglial cell, h pericellular halo, V vacuole, asterisk neuropile, blue arrow pyramidal cell, green arrow head flame-like cell with pointed end, black arrow head pyknotic cell, orange arrow angiectasis, black square neuronal degeneration, yellow square neurophagia, red square astrocyte, dashed red square degenerated astrocyte, green circle oligodendrocyte, dashed green circle degenerated oligodendrocyte. The blue dashed square indicated the area of magnification. The results are expressed as the mean ± SE (n = 8 fields/group). Groups with different superscript letters means there is a significant change between them at P < 0.05. Statistical significance test for comparison was done by MANOVA, followed by post hoc Tukey’s HSD multiple comparison test
Fig. 7
Fig. 7
Immunohistochemistry showing the expression of caspase-1 in the PFC and DG of rats in the six experimental groups: A Control PND 60, B Control PND 95, C BPA 50-PND 60, D BPA 50-PND 95, E BPA 125-PND 60, F BPA 125-PND 95. Black arrow heads denote positively brown stained neurons. The blue dashed square indicated the area of magnification. G The results are expressed as the mean ± SE (n = 8 fields/group). Groups with different superscript letters means there is a significant change between them at P < 0.05. Statistical significance test for comparison was done by MANOVA, followed by post hoc Tukey’s HSD multiple comparison test
Fig. 7
Fig. 7
Immunohistochemistry showing the expression of caspase-1 in the PFC and DG of rats in the six experimental groups: A Control PND 60, B Control PND 95, C BPA 50-PND 60, D BPA 50-PND 95, E BPA 125-PND 60, F BPA 125-PND 95. Black arrow heads denote positively brown stained neurons. The blue dashed square indicated the area of magnification. G The results are expressed as the mean ± SE (n = 8 fields/group). Groups with different superscript letters means there is a significant change between them at P < 0.05. Statistical significance test for comparison was done by MANOVA, followed by post hoc Tukey’s HSD multiple comparison test
Fig. 8
Fig. 8
The molecular docking analysis of BPA and neuroinflammatory, autophagic as well as, pyroptotic molecules displaying 2D and 3D binding interactions of BPA [PubChem CID: 6623] against A NF-kB [PDB ID: 1NFK], B IL-1β [PDB ID: 2MIB], C IL-2 [PDB ID: 4YQX], D IL-12 [PDB ID: 3HMX], E COX-2 [PDB ID: 1PXX], F NLRP3 [PDB ID: 7vtq], G Beclin-1 [PDB ID: 2PON], H LC3A [PDB ID: 6TBE], I LC3B [PDB ID: 5XAC], J Caspase-1 [PDB ID: 6VIE]. The green dotted lines denote hydrogen bonds between ligand and aminoacids, whereas bink/purple dotted lines represent hydrophobic interactions. Electrostatic interactions are shown as orange dotted lines. The red dotted line indicate an unfavorable donor-donor
Fig. 8
Fig. 8
The molecular docking analysis of BPA and neuroinflammatory, autophagic as well as, pyroptotic molecules displaying 2D and 3D binding interactions of BPA [PubChem CID: 6623] against A NF-kB [PDB ID: 1NFK], B IL-1β [PDB ID: 2MIB], C IL-2 [PDB ID: 4YQX], D IL-12 [PDB ID: 3HMX], E COX-2 [PDB ID: 1PXX], F NLRP3 [PDB ID: 7vtq], G Beclin-1 [PDB ID: 2PON], H LC3A [PDB ID: 6TBE], I LC3B [PDB ID: 5XAC], J Caspase-1 [PDB ID: 6VIE]. The green dotted lines denote hydrogen bonds between ligand and aminoacids, whereas bink/purple dotted lines represent hydrophobic interactions. Electrostatic interactions are shown as orange dotted lines. The red dotted line indicate an unfavorable donor-donor
Fig. 9
Fig. 9
Schematic illustration showing the influence of BPA on the cross-talk between neuroinflammation and autophagy mediated initiation of pyroptosis and progression of anxiety-related behaviors in postnatal male rats. BPA exposure resulted in a remarkable elevation in the level of proinflammatory cytokines particularly IL-2 and IL-12 that are significant for differentiation and function of T-cells. The Canonical NLRP3 inflammasome activation requires two steps: the first is priming step and the second is activation step. In the priming step, toll-like receptors (TLR) stimulation promotes the transcription and expression of NLRP3 and pro-IL-1β through NF-κB. Subsequently, various DAMPs and PAMPs induce the activation step by initiating numerous cellular and molecular cascades, including K+ efflux, Ca2+ influx, mitochondrial dysfunction, reactive oxygen species (ROS) release, and lysosomal disruption. The NLRP3-dependent self-cleavage and activation of pro-caspase-1 self-cleavage and activation leads to the maturation of the pro-inflammatory cytokines IL-1β and IL-18. Additionally, gasdermin D (GSDMD) is cleaved by activated caspase-1, releasing its N-terminal domain, which then integrates into the cell membrane to create pores. These pores allow the release of cellular contents, including IL-1β and IL-18, and trigger pyroptosis. BPA exposure caused a significant elevation in the expression level of NF-κB, IL-1β, NLRP3 and caspase-1. The release of DAMPs and PAMPs is a combined by an increase in extracellular glutamate levels, which further leads to excitotoxic neuron damage through NMDA receptors. Furthermore, glutamate-mediated Ca2+ influx occurs through NMDA receptors. mTOR is a downstream target of PI3K and AKT pathway which could be downregulated by apoptotic signals, therefore, induction of autophagy by inhibition of the mTOR may result in dysregulated autophagic machinery led to neuronal degeneration. Damaged and dying neurons secrete DAMPs besides prevalence of cytokines all together lead to activation of microglia via binding to cell surface receptors (e.g. TLR), resulting in activation of the NF-κB pathway. This activation induces a signaling cascade, causing enhancement in the expression of cytokines such as pro-IL-1β and pro-IL-18 as well as NLRP3. Autophagy begins with the formation of double-membrane vesicles known as autophagosomes. Autophagosomes combine with lysosomes to generate autophagolysosomes, which degrade their contents into basic molecules that can be recycled for reuse. The elevated beclin-1, LC3A, and LC3B levels by inhibiting the PI3K/Akt/mTOR signaling pathway, triggering autophagy in brain tissue. Once microglia get activated, they become polarized to an M1, pro-inflammatory phenotype and secrete pro-inflammatory cytokines and factors as well as, activating astrocytes. Activation and dysfunction of astrocytes contributes to BBB, allowing infiltration of different immunological cells. Note At the end of each line, the arrowhead indicates activating the neural projection, while short line for inhibition

References

    1. Negri-Cesi P (2015) Bisphenol A interaction with brain development and functions. Dose Response 13:15593258–15590394 - PMC - PubMed
    1. Bakoyiannis I, Kitraki E, Stamatakis A (2021) Endocrine-disrupting chemicals and behaviour: a high risk to take? Best Pract Res Clin Endocrinol Metab 35:e101517 - PubMed
    1. Pironti C, Ricciardi M, Proto A, Bianco PM, Montano L, Motta O (2021) Endocrine-disrupting compounds: an overview on their occurrence in the aquatic environment and human exposure. Water 13:e1347
    1. Abraham A, Chakraborty P (2020) A review on sources and health impacts of bisphenol A. Rev Environ Health 35:201–210 - PubMed
    1. Presunto M, Mariana M, Lorigo M, Cairrao E (2023) The effects of bisphenol A on human male infertility: a review of current epidemiological studies. Int J Mol Sci 24:e12417 - PMC - PubMed

MeSH terms

LinkOut - more resources