. 2024 Sep;27(5):1016-1030.
doi: 10.1007/s10120-024-01528-z. Epub 2024 Jun 28.

The extracellular matrix protein EMILIN-1 impacts on the microenvironment by hampering gastric cancer development and progression

Affiliations

The extracellular matrix protein EMILIN-1 impacts on the microenvironment by hampering gastric cancer development and progression

Alessandra Capuano et al. Gastric Cancer. 2024 Sep.

Abstract

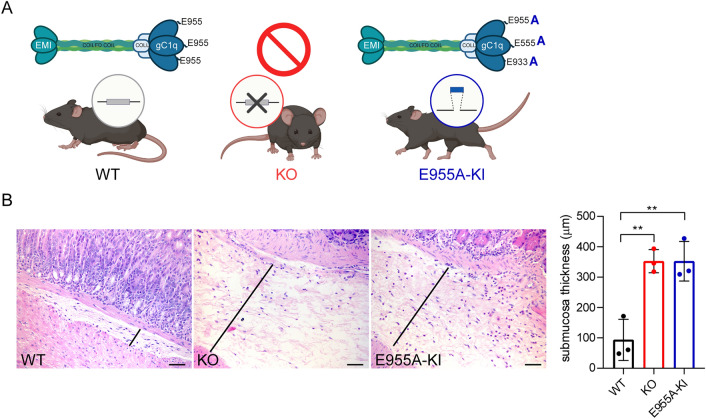
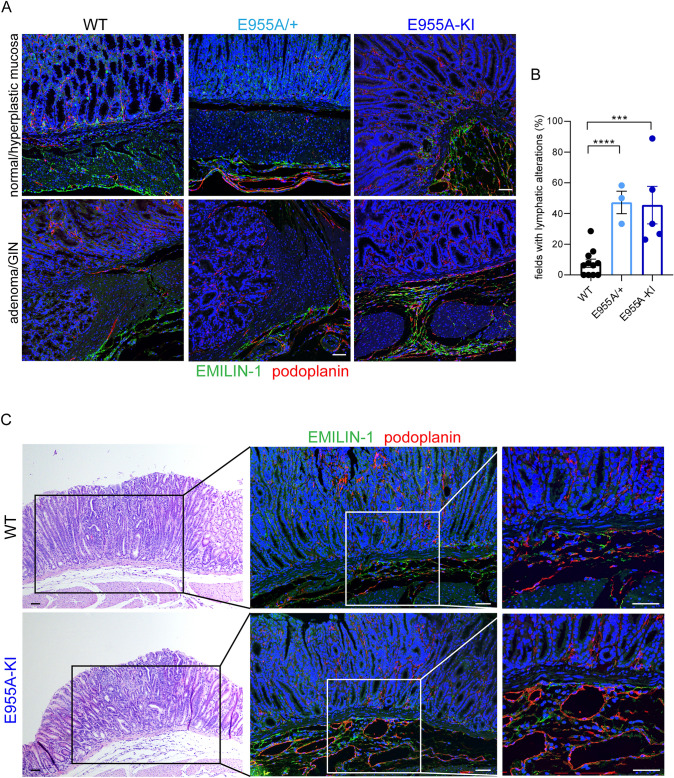
Background: The contribution of the tumor microenvironment and extracellular matrix to the aggressive biology of Gastric Cancer (GC) has been recently characterized; however, the role of EMILIN-1 in this context is unknown. EMILIN-1 is an essential structural element for the maintenance of lymphatic vessel (LV) integrity and displays anti-proliferative properties as demonstrated in skin and colon cancer. Given the key role of LVs in GC progression, the aim of this study was to investigate the role of EMILIN-1 in GC mouse models.

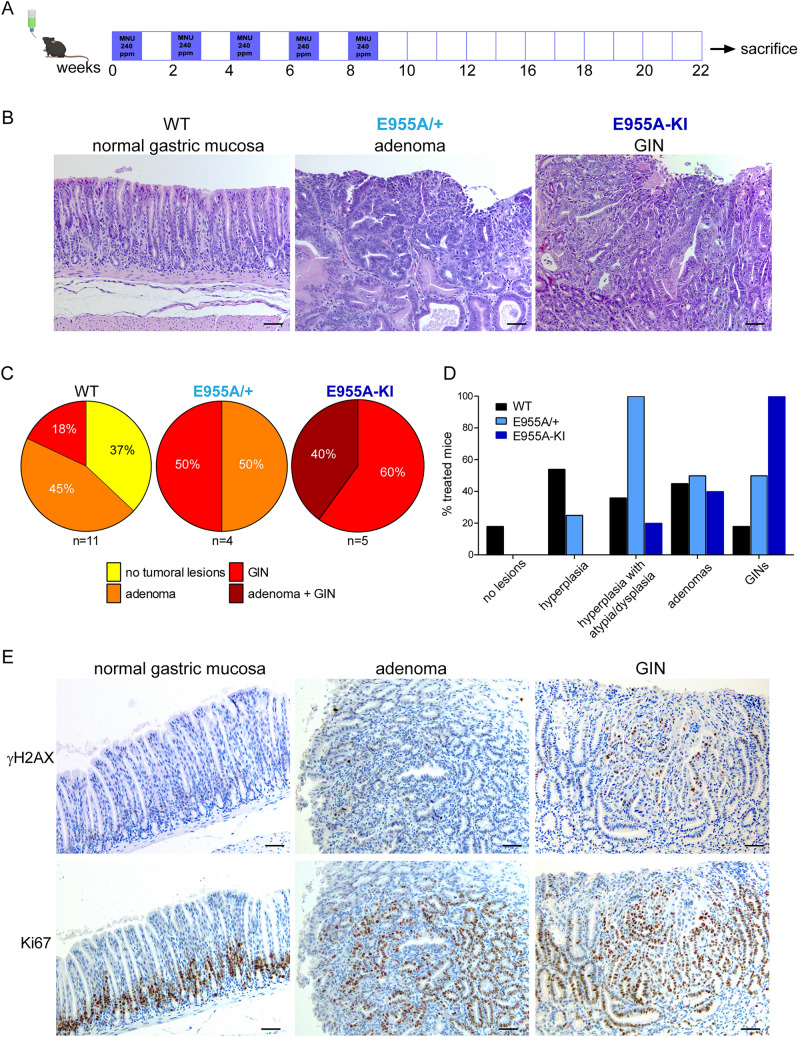
Methods: We used the syngeneic YTN16 cells which were injected subcutaneously and intraperitoneally in genetically modified EMILIN-1 mice. In alternative, carcinogenesis was induced using N-Methyl-N-nitrosourea (MNU). Mouse-derived samples and human biopsies were analyzed by IHC and IF to the possible correlation between EMILIN-1 expression and LV pattern.

Results: Transgenic mice developed tumors earlier compared to WT animals. 20 days post-injection tumors developed in EMILIN-1 mutant mice were larger and displayed a significant increase of lymphangiogenesis. Treatment of transgenic mice with MNU associated with an increased number of tumors, exacerbated aggressive lesions and higher levels of LV abnormalities. A significant correlation between the levels of EMILIN-1 and podoplanin was detected also in human samples, confirming the results obtained with the pre-clinical models.

Conclusions: This study demonstrates for the first time that loss of EMILIN-1 in GC leads to lymphatic dysfunction and proliferative advantages that sustain tumorigenesis, and assess the use of our animal model as a valuable tool to verify the fate of GC upon loss of EMILIN-1.

Keywords: Extracellular matrix; Gastrointestinal intraepithelial neoplasia; Lymphatic vessels; Mouse models; Tumor microenvironment.


Conflict of interest statement

The authors declare that they have no conflict of interest.

Figures

Fig. 1
Fig. 1
EMILIN-1 transgenic mice display gastric mucosa thickening. A Schematic representation of the EMILIN-1 in vivo models: the wild-type C57BL/6 J mouse (WT), the EMILIN-1 knockout mouse (KO) and the knock-in mouse carrying the E955A mutation in the gC1q domain (E955A-KI) (created with BioRender.com). B H&E staining of normal gastric mucosa from 10-month-old mice. On the right, graph reporting the measurements of submucosa thickness. Note the presence of edema in KO and E955A-KI submucosa. The results represent the mean ± SD of 3 mice/genotype. The black lines indicate the range of measurement evaluated (at least 5 measurements/mouse). P-values were calculated using the two-tailed Student’s t-test. **P < 0.01. Scale bar = 50 µm
Fig. 2
Fig. 2
Loss of EMILIN-1 function promotes GC growth and tumor spread. A Schematic representation of the experimental procedure for the subcutaneous (s.c.) injection. B Tumor masses developed 20 days after s.c. injection of YTN16 murine GC cells in both flanks (LT, left and RT, right) of WT (n = 6), KO (n = 4) and E955A-KI (n = 6) mice. Volume curves (C) and endpoint weight (D), expressed as mean ± SD, show accelerated and increased tumor growth in transgenic mice. E Representative immunofluorescence images of cryostat sections of tumors developed in WT, KO and E955A-KI mice. KO and E955A-KI have higher lymphatic vessel density compared to WT tumors, as shown by Lyve-1 staining. The density of blood vessels is similar in the three genotypes, as shown by CD31 staining. The corresponding graphs (F) report the Lyve-1 and CD31 positive volume calculated with the Volocity software in the entire analyzed sections (20x). For each sample, at least 5 fields were analyzed and the mean value was reported. Results represent the mean ± SD of 8–12 tumors/genotype. G Schematic representation of the experimental procedure for intraperitoneal (i.p.) injection. H Quantification of the total score used to evaluate tumor spread (see “Materials and Methods”) and shown in the graph as mean ± SD of n = 3 mice per group. I Representative images of the gastric serosal wall showing the spread of YTN16 cells 20 days after i.p. injection in WT, KO, and E955A- KI mice. Black arrows indicate tumor masses. Schemes in (A) and (G) have been created with BioRender.com. P-values were calculated using a two-tailed Student’s t-test. *P < 0.05, **P < 0.01, ****P < 0.001. Scale bar = 50 µm
Fig. 3
Fig. 3
Gastric Carcinogenesis induced by MNU is more pronounced in EMILIN-1 transgenic mice. A Scheme of administration regimen of N-Methyl-N-nitrosourea (MNU) to the animals (created with BioRender.com). Representative H&E images of the most common lesions (adenomas and GINs) in the stomach in the three genotypes (B) and the relative quantifications (C), expressed as a percentage of the total treated mice, as indicated. D Graphical representation of the distribution of hyperplasia, atypia, dysplasia and lesions in all treated mice. E Representative images of paraffin-embedded serial sections of normal gastric mucosa, adenoma and GIN, immunostained with an anti-γH2AX antibody as a marker for DNA double-strand breaks, and with an anti-Ki-67 antibody as a marker for cell proliferation. Scale bar = 50 µm
Fig. 4
Fig. 4
The EMILIN-1 transgenic mice display extensive LV aberrations. A Representative images of normal and tumor gastric mucosa and submucosa immunostained with anti-EMILIN-1 (green) and the anti-podoplanin (red) antibodies in MNU-treated mice. B Graph showing the frequency of lymphatic changes (assessed as the presence and extent of LVs with dilated lumen in the submucosa) reported as mean ± SD of 11 WT, 3 E955A/ + and 5 E955A-KI mice, as indicated by the number of dots in each histogram. C Analysis of LVs (red) in the submucosa of GIN lesions from WT and E955A-KI mice. Paraffin-embedded serial sections were stained with H&E to identify the lesion and immunostained for EMILIN-1 (green) and podoplanin (red). The outlined areas correspond to the region analyzed by immunofluorescence. ***P < 0.005; ****P < 0.001. Scale bar = 50 µm
Fig. 5
Fig. 5
EMILIN-1 expression is downregulated in human GC samples. A Representative images of cryostat sections of a tumor and the corresponding adjacent healthy human gastric tissue from two different patients immunostained for EMILIN-1 (green) and podoplanin (red). The enlarged fields on the right correspond to the white outlined areas in the tumor samples and show details of the LVs. Graphs quantifying EMILIN-1 (B) and podoplanin (C) positive volumes in the entire analyzed sections (20x) of the paired samples. At least 5 fields were analyzed for each sample. 20 GC patients were analyzed and the mean value was reported for each. D The graph shows the inverse correlation between the expression of EMILIN-1 and podoplanin in the patient cohort. The fold change was determined by comparing the intensities of the tumor and normal counterpart in paired samples. Pearson’s correlation coefficient was calculated between the two variables. Scale bar = 50 µm. P-values were calculated using a two-tailed paired Student’s t-test. *P < 0.05, **P < 0.01
Fig. 6
Fig. 6
EMILIN-1 expression is downregulated in tumors and inversely associates with podoplanin, elastase, MMP9 and MMP14. A Graph showing EMILIN1 expression in different tumors and the corresponding normal tissue as assessed with the TNMplot tool. The tumors with statistically different values are indicated in the graph. The graph represents the gene expression analysis of EMILIN1 (B) and podoplanin (PDPN) (C) evaluated with the GEO dataset GSE66229 (healthy, n = 100; tumor, n = 300). D Distribution of EMILIN1 expression at different GC stages (GSE26253; 1B, n = 68; 2, n = 167; 3A, n = 111; 3B, n = 19; 4, n = 67). E Representative images of sections of healthy gastric and tumor tissue from our patient cohort, immunostained for elastase (green). Graphical representation of MMP9 (F) and MMP14 (G) expression using the GEO dataset GSE66229. P-values were calculated using a two-tailed Student’s t-test. ****P < 0.0001. Scale bar = 50 µm
Fig. 7
Fig. 7
The inflammatory infiltrate in tumor lesions is associated with LV anomalies and density. Graphical distribution of the inflammatory infiltrate in tumor lesions (A) and in the corresponding submucosa (B) in MNU-treated animals. Gr, granulocytes/neutrophils; M, macrophages; L, lymphocytes. C Representative images of Iba1 staining of tumor mucosa (top) and submucosa (bottom) in WT, E955A/ + and E955-KI mice. Qualitative analysis of inflammatory infiltrate in the bioptic samples of GC patients grouped by histotype (D) or LV density (E). LV density was scored by podoplanin-positive staining in 20 × fields as follows: low (< 10 LVs/field), high (≥ 10 LVs/field). F) Representative images of IHC staining for the detection of macrophages (CD68) (left) and LVs (podoplanin) (right) in human tumor samples. One patient is shown for each of the “low” and “high” LV density groups. Scale bar = 50 µm

References

    1. Smyth EC, Nilsson M, Grabsch HI, van Grieken NC, Lordick F. Gastric cancer. Lancet. 2020;396:635–48. 10.1016/S0140-6736(20)31288-5 - DOI - PubMed
    1. Deng J-Y, Liang H. Clinical significance of lymph node metastasis in gastric cancer. World J Gastroenterol. 2014;20:3967–75. 10.3748/wjg.v20.i14.3967 - DOI - PMC - PubMed
    1. Pellino A, Riello E, Nappo F, Brignola S, Murgioni S, Djaballah SA, et al. Targeted therapies in metastatic gastric cancer: current knowledge and future perspectives. World J Gastroenterol. 2019;25:5773–88. 10.3748/wjg.v25.i38.5773 - DOI - PMC - PubMed
    1. Wang C, Chu M. Advances in drugs targeting lymphangiogenesis for preventing tumor progression and metastasis. Front Oncol. 2021;11:783309. 10.3389/fonc.2021.783309 - DOI - PMC - PubMed
    1. Kim H, Kataru RP, Koh GY. Inflammation-associated lymphangiogenesis: a double-edged sword? J Clin Invest. 2014;124:936–42. 10.1172/JCI71607 - DOI - PMC - PubMed

Substances