. 2024 Jul 23;43(7):114347.
doi: 10.1016/j.celrep.2024.114347. Epub 2024 Jun 26.

Hair follicles modulate skin barrier function

Affiliations

Hair follicles modulate skin barrier function

Noah C Ford et al. Cell Rep. .

Abstract

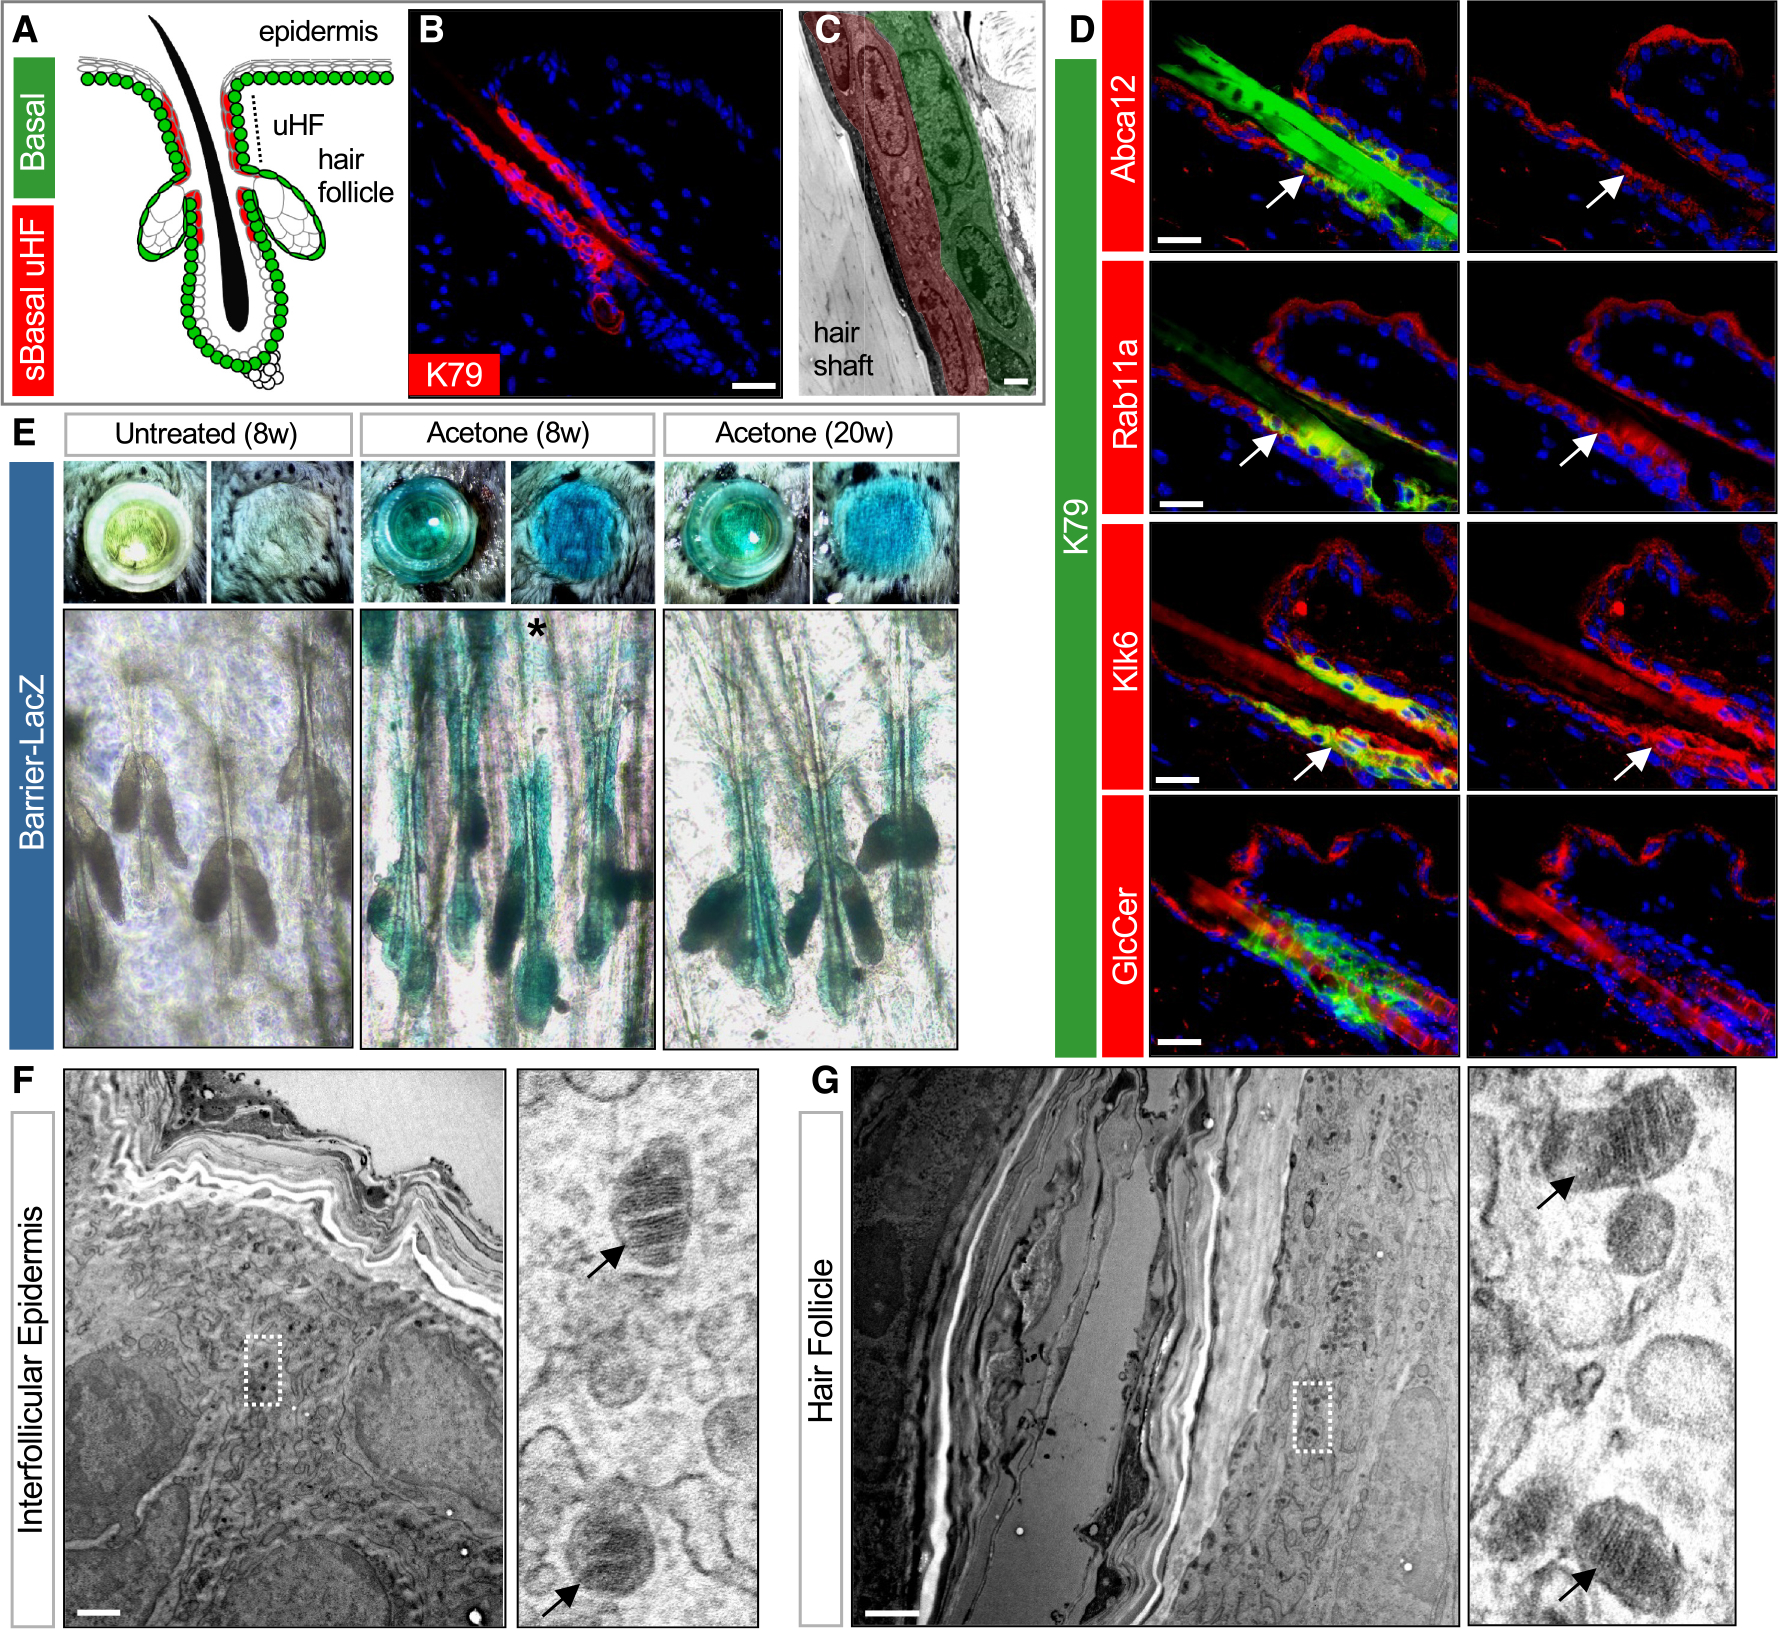
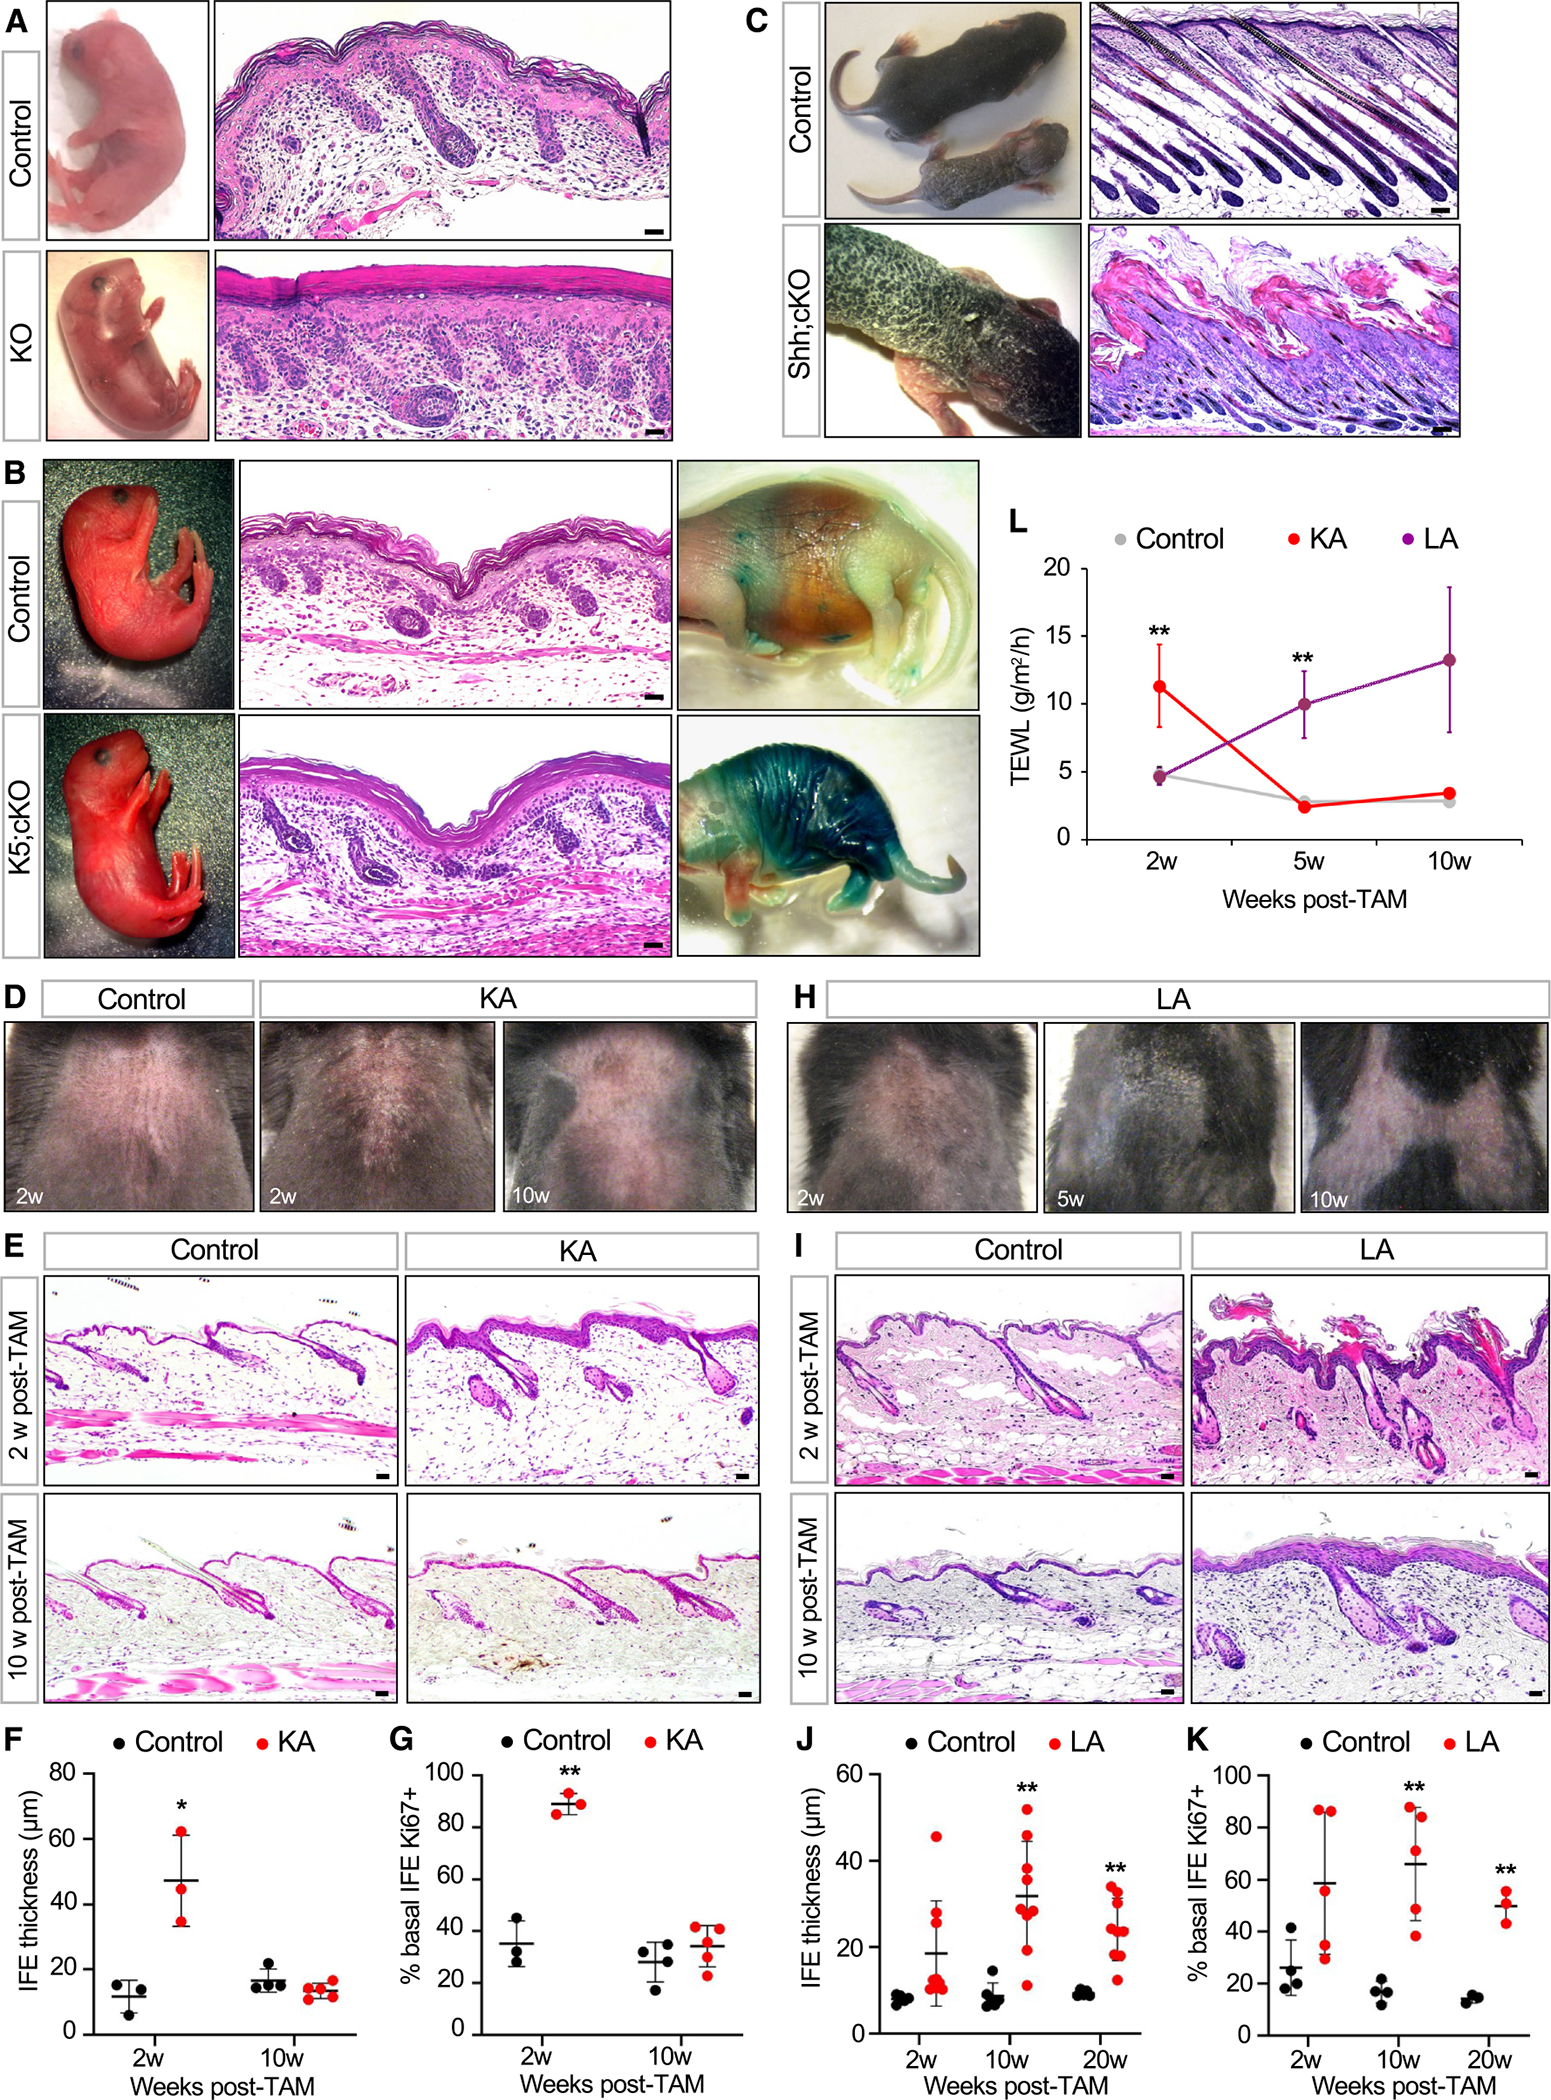
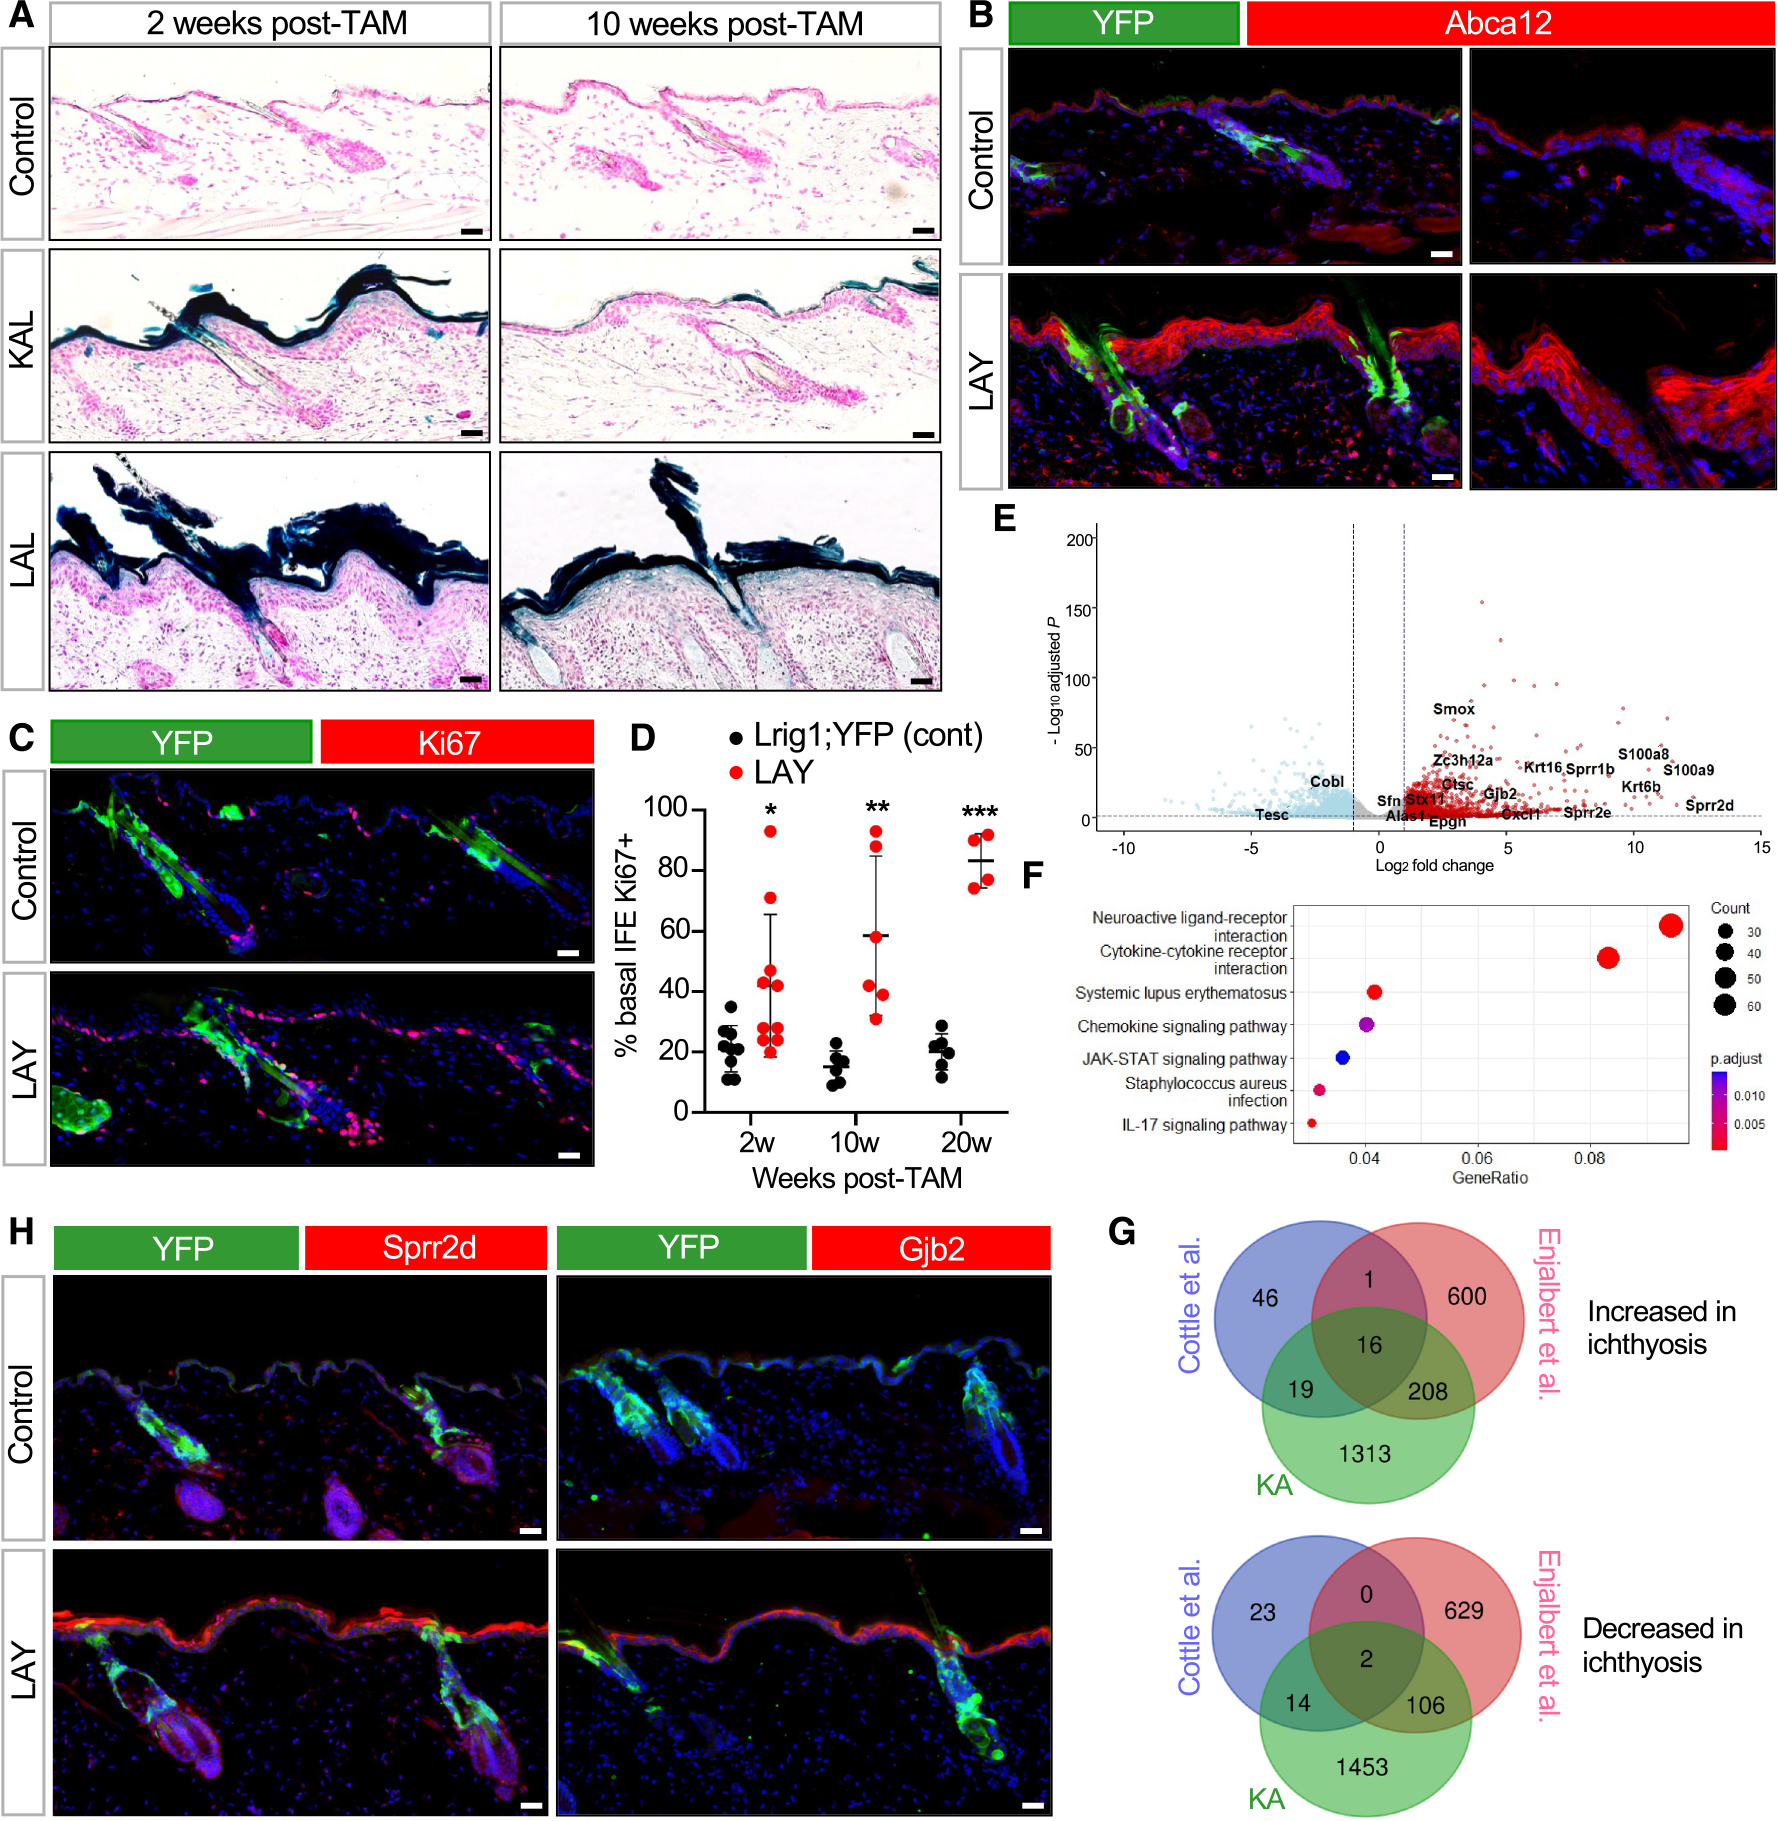
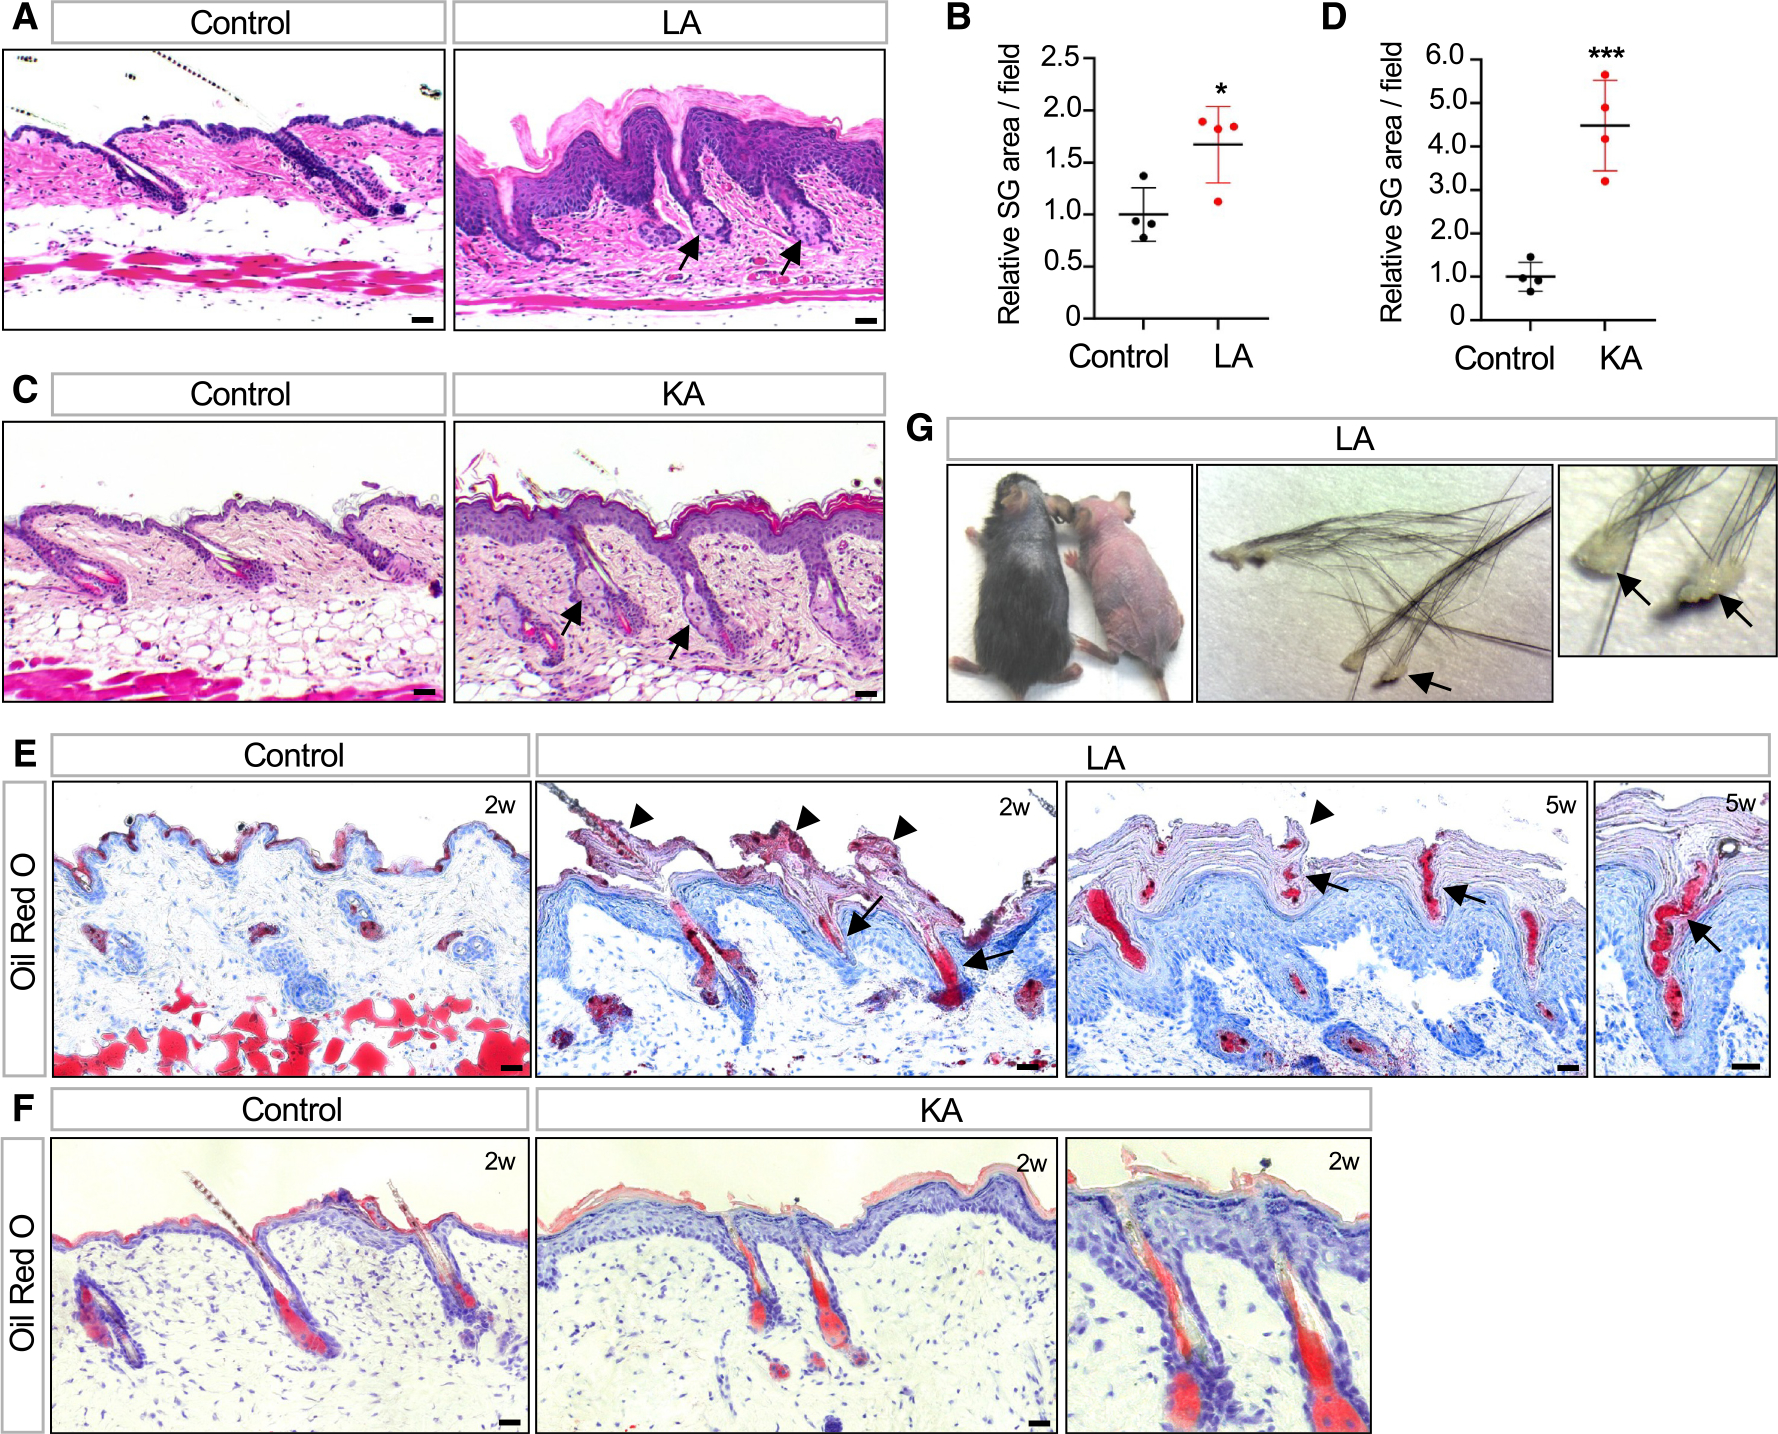
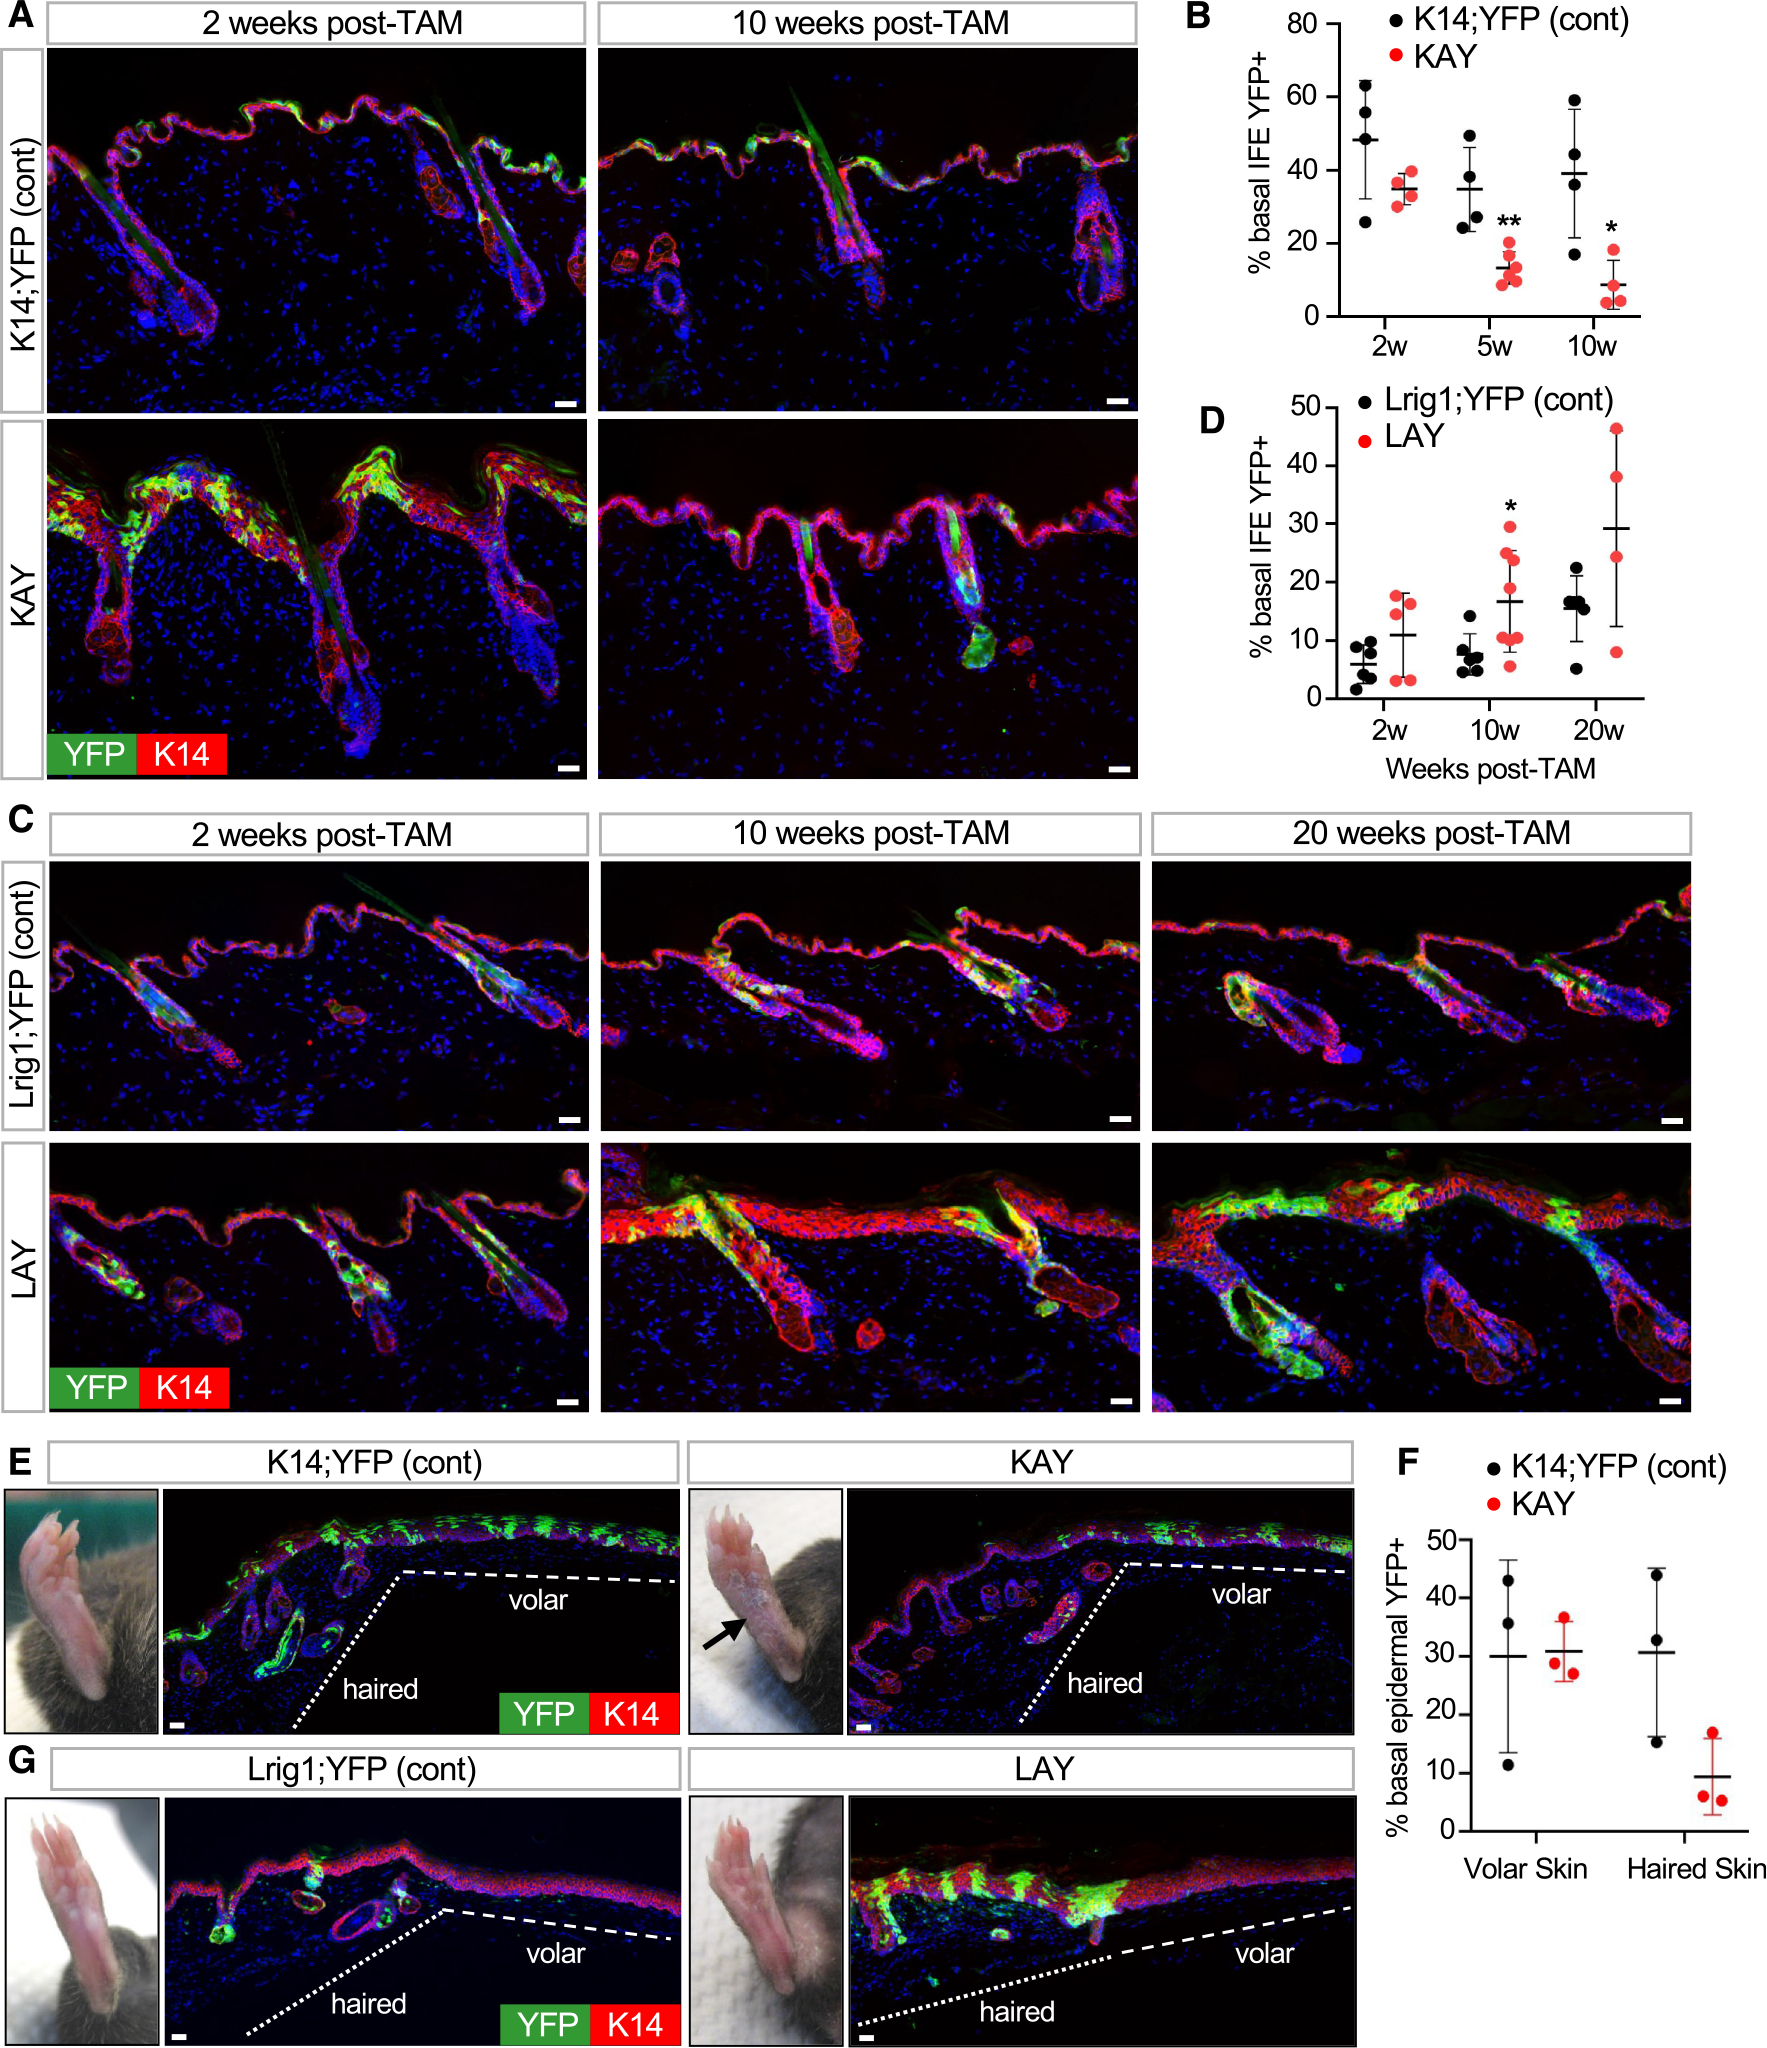
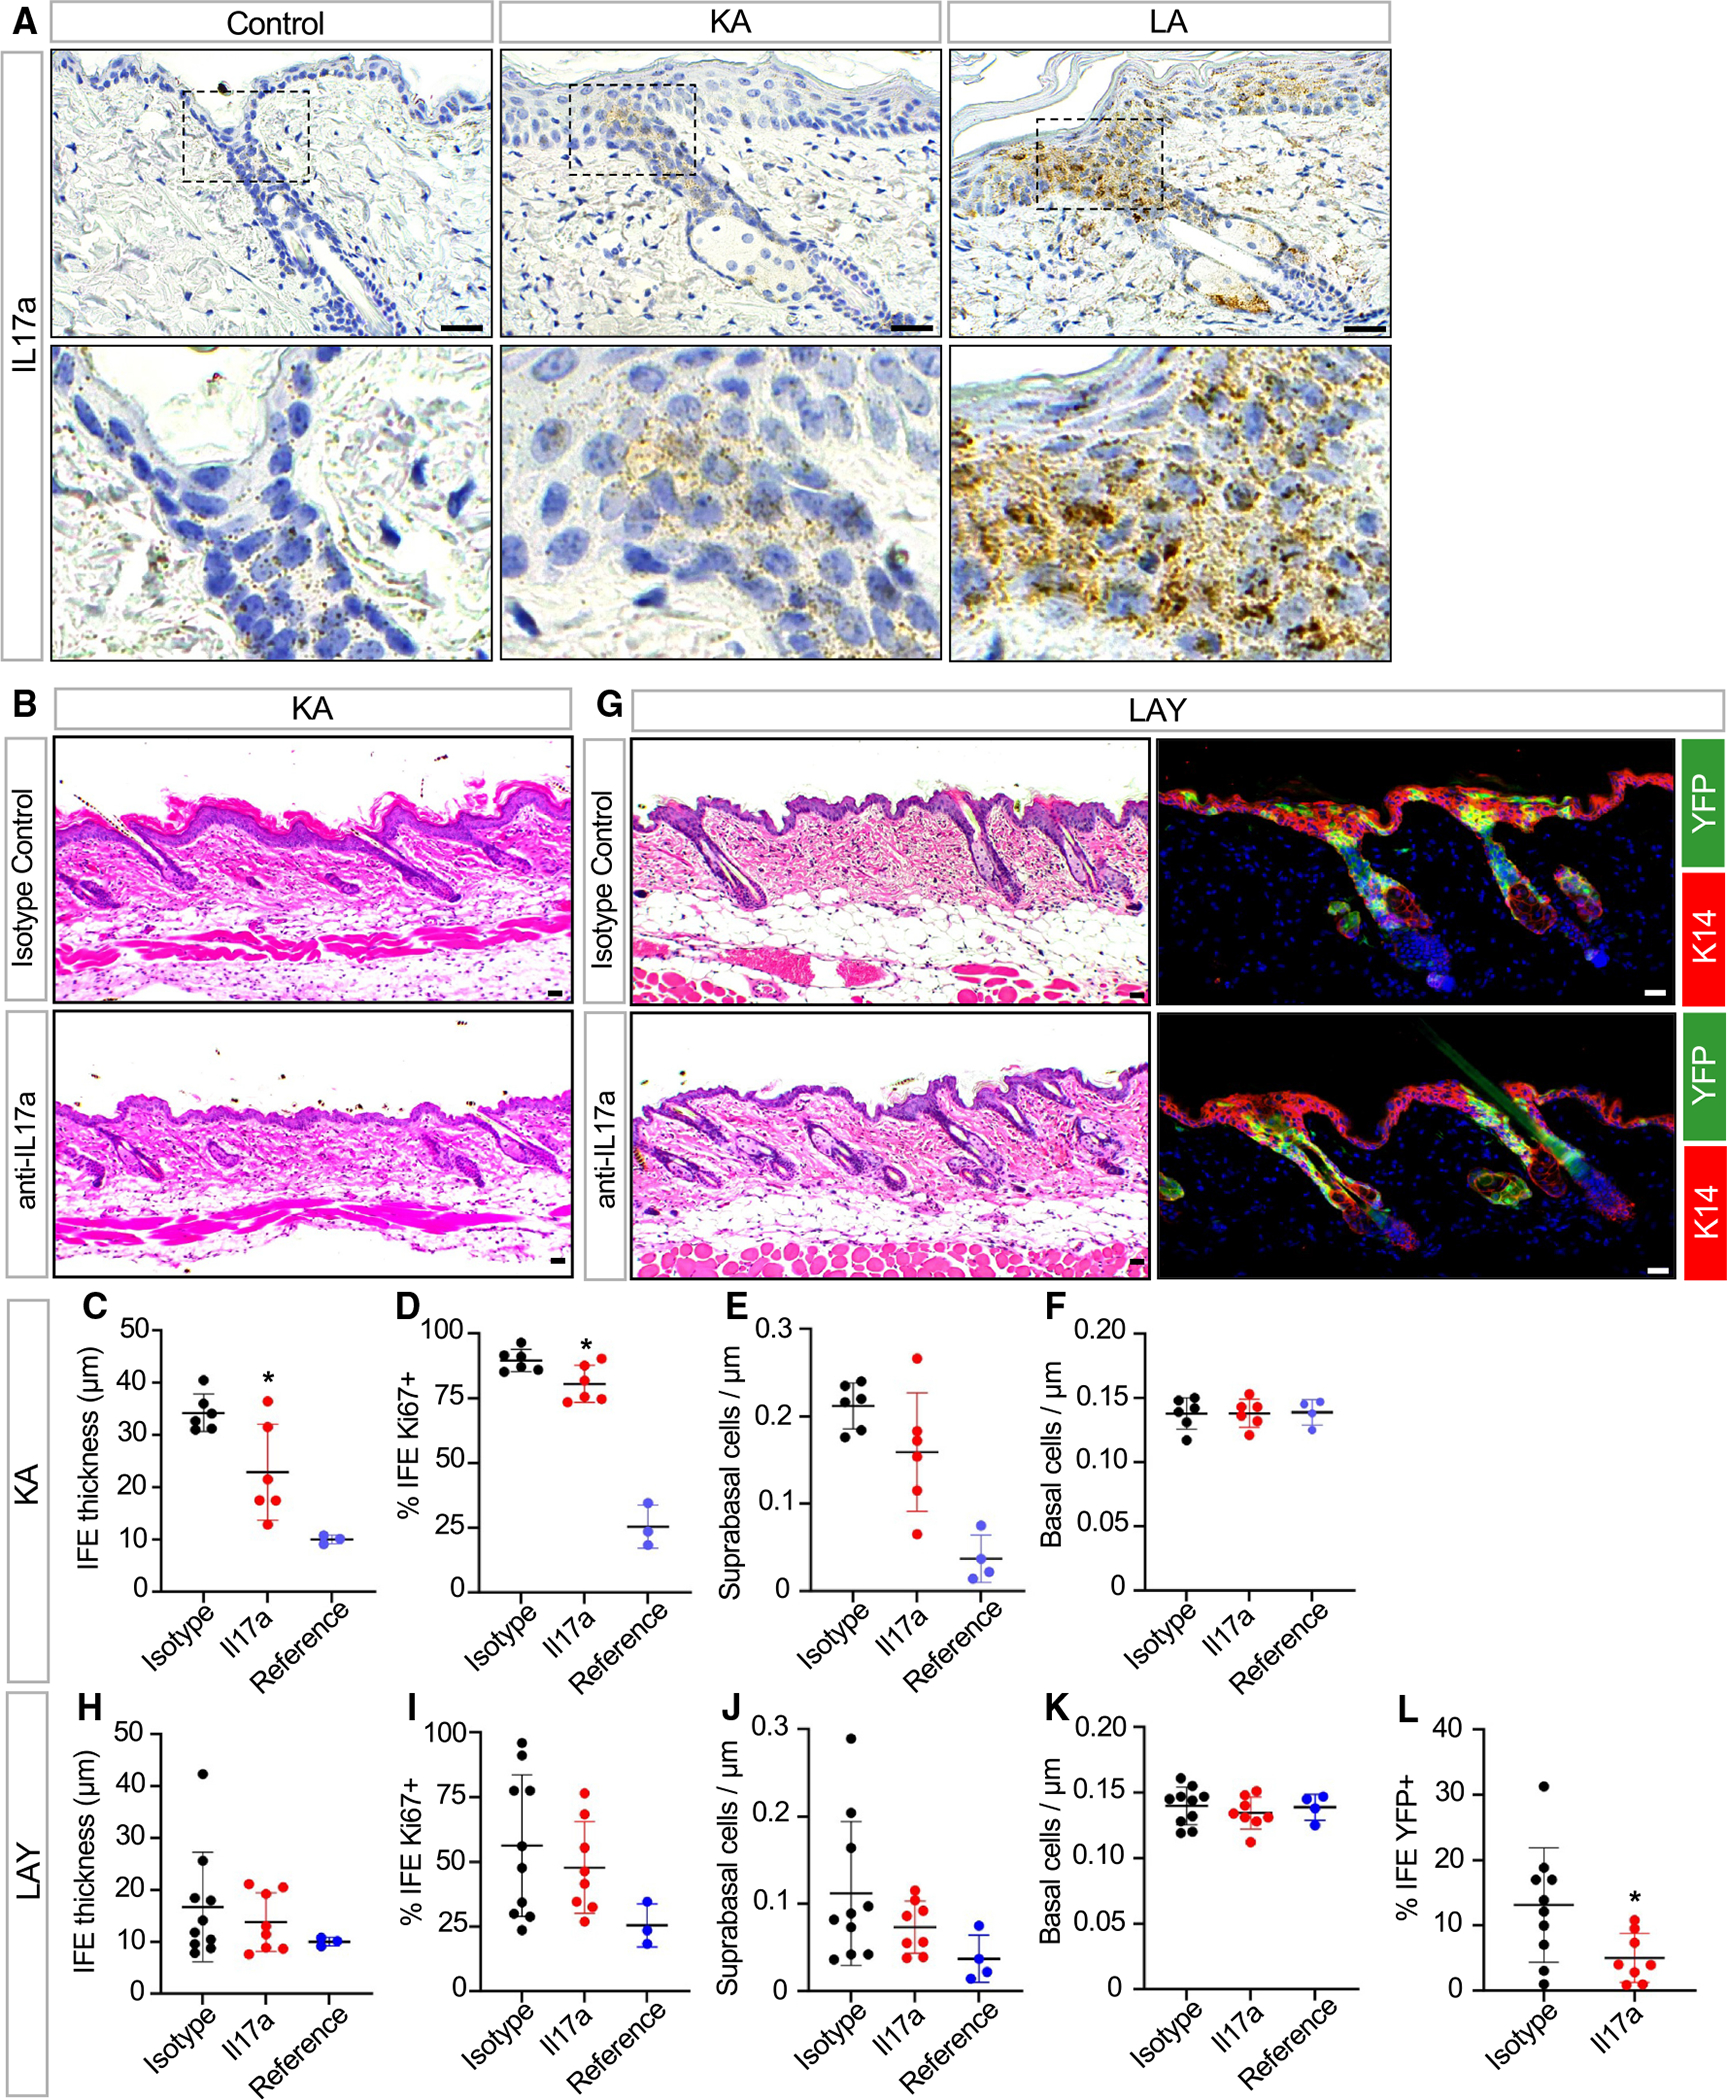
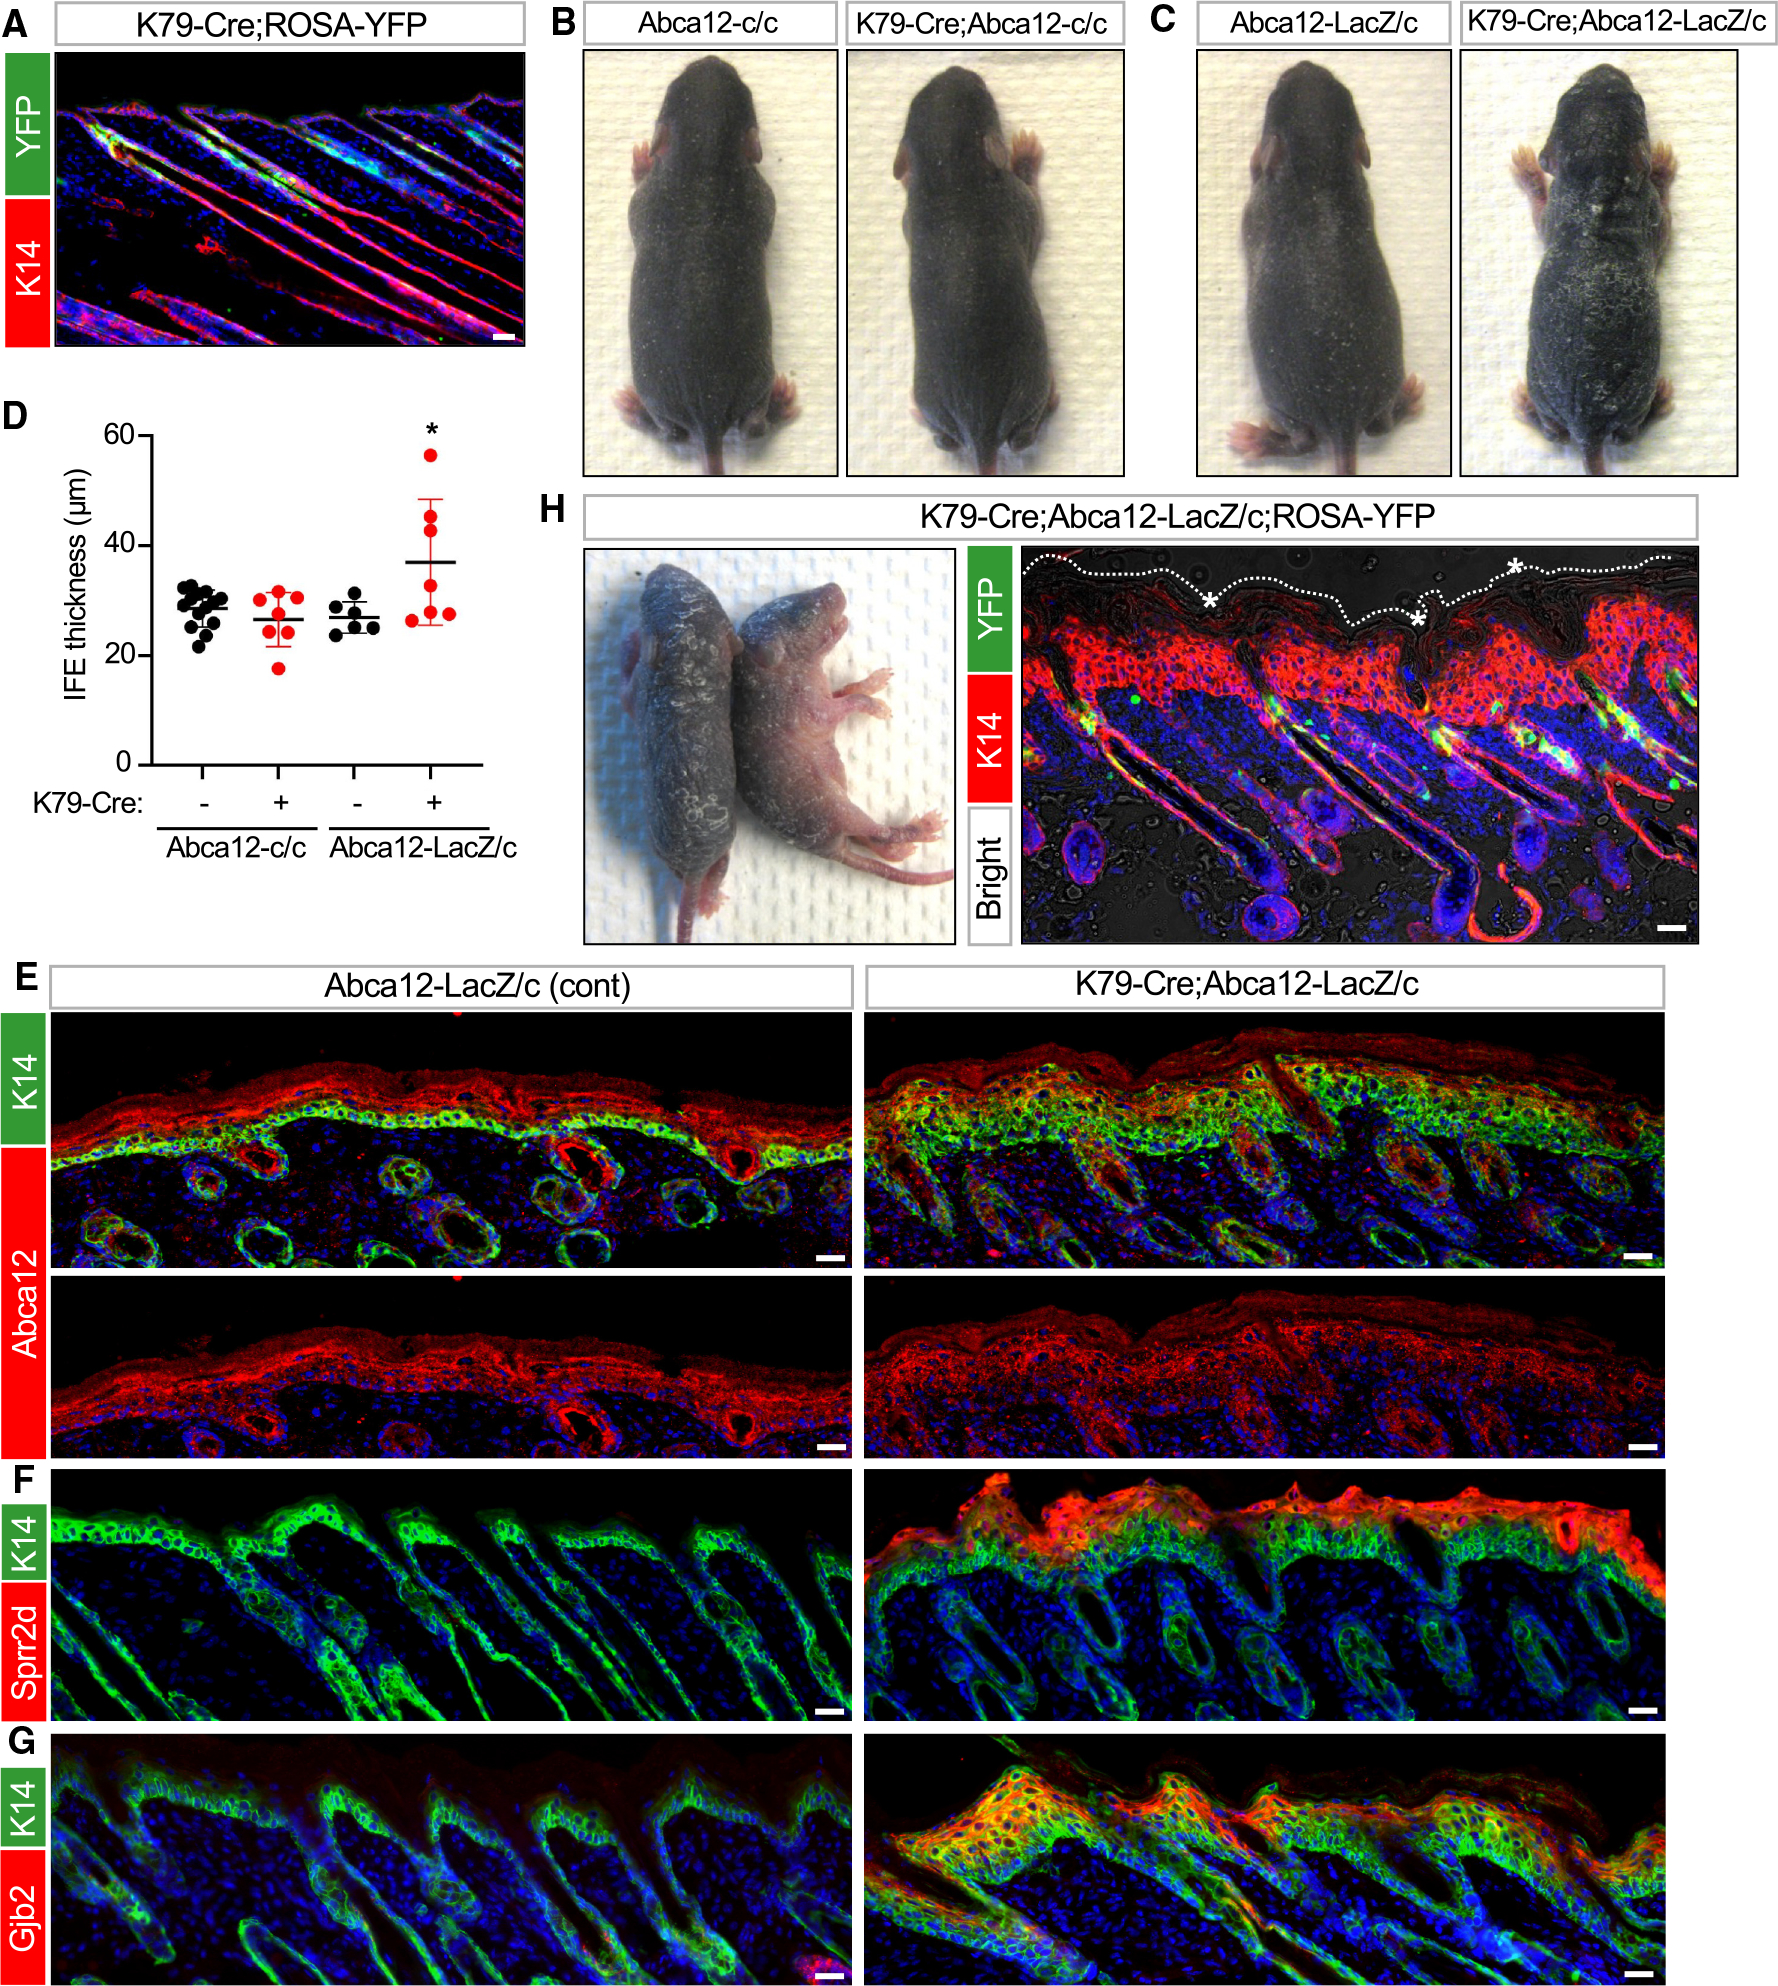
Our skin provides a protective barrier that shields us from our environment. Barrier function is typically associated with the interfollicular epidermis; however, whether hair follicles influence this process remains unclear. Here, we utilize a potent genetic tool to probe barrier function by conditionally ablating a quintessential epidermal barrier gene, Abca12, which is mutated in the most severe skin barrier disease, harlequin ichthyosis. With this tool, we deduced 4 ways by which hair follicles modulate skin barrier function. First, the upper hair follicle (uHF) forms a functioning barrier. Second, barrier disruption in the uHF elicits non-cell-autonomous responses in the epidermis. Third, deleting Abca12 in the uHF impairs desquamation and blocks sebum release. Finally, barrier perturbation causes uHF cells to move into the epidermis. Neutralizing IL-17a, whose expression is enriched in the uHF, partially alleviated some disease phenotypes. Altogether, our findings implicate hair follicles as multi-faceted regulators of skin barrier function.

Keywords: CP: Developmental biology; K79; Krt79; hair canal; hair follicle stem cells; infundibulum; sebaceous gland.


Conflict of interest statement

Declaration of interests The authors declare no competing interests.

Figures

Figure 1.
Figure 1.. The hair follicle forms a functioning barrier
(A) Schematic of telogen hair follicle. Green, basal progenitors. Red, K79+ suprabasal (sBasal) cells in the upper hair follicle (uHF). Note that K79 is also expressed by sebocytes (not highlighted here). (B) Immunohistochemical (IHC) staining for K79 (red). (C) Transmission electron microscopy (TEM) of uHF showing basal (green) and suprabasal (red) hair follicle epithelium and hair shaft. (D) IHC for barrier-associated proteins (red) and K79 (green). Right images show single-channel views of barrier-associated protein expression. Arrows, regions of overlap with K79+ uHF cells. (E) Top images, overhead views of skin following incubation with X-gal in cloning cylinders (left) or with cylinders removed (right). Bottom images, whole mounts showing LacZ staining of untreated 8-week-old skin (left), acetone-treated 8-week-old skin (middle), and acetone-treated 20-week-old skin (right). Asterisk, occasional LacZ+ cells in the IFE. (F) TEM of IFE. Right image is a magnified view showing LGs (arrows). (G) TEM of uHF. Right image is a magnified view showing LGs (arrows). Scale bars for (C), (F), and (G), 1 μm; all others, 50 μm. See also Figure S1.
Figure 2.
Figure 2.. Abca12 mutant mice provide a genetic tool to probe barrier function
(A) Gross images of and skin histology from newborn Abca12 KO pup or littermate control. (B) Similar to (A) but comparing newborn K5;cKO pup and littermate control. Rightmost images, LacZ barrier assay, with blue staining indicating dysfunctional skin barrier. Note that the cKO allele does not contain the LacZ transgene. (C) Similar to (A) but comparing Shh;cKO pup and littermate control on post-natal days (P) 7–8. (D) Gross images of shaved dorsal skin from control or KA mice at the indicated number of weeks post-TAM. (E) Skin histology of control or KA mice at 2 weeks (top) or 10 weeks (bottom) post-TAM. (F) Quantitation of IFE thickness in control (black) or KA (red) mice. (G) Quantitation of basal IFE proliferation in control or KA mice. (H) Gross images of shaved dorsal skin from LA mice at the indicated times post-TAM. See Figure S3B for an image of littermate control mouse. (I) Skin histology of control or LA mice at 2 weeks (top) or 10 weeks (bottom) post-TAM. (J) Quantitation of IFE thickness in control (black) or LA (red) mice. (K) Quantitation of basal IFE proliferation in control or LA mice. (L) TEWL measurements from control (gray), KA (red), and LA (purple) mice. For (F), (G), (J), and (K): *p < 0.05 and **p < 0.01 by unpaired t test, comparing only samples from the same time point. n ≥ 3 mice per genotype per time point. Error bars indicate mean ± SD. For (L): **p < 0.01 by one-way ANOVA with post hoc Tukey test, comparing only samples from the same time point. For each time point, n = 4–5 KA mice, 6–9 LA mice, and ≥14 control mice. Data are represented as mean ± SE. Scale bar for (C), 100 μm; all others, 50 μm. See also Figures S2 and S3.
Figure 3.
Figure 3.. Abca12 deletion in the uHF induces non-cell-autonomous responses in the IFE
(A) LacZ staining, as a readout for Abca12 promoter activity, in K14-CreERT;Abca12-KO/cKO (KAL) or Lrig1-CreERT2;Abca12-KO/cKO (LAL) mice. Controls are Abca12-KO/cKO mice lacking Cre. (B) IHC for Abca12 in Lrig1-CreERT2;Abca12-c/c;ROSA-YFP (LAY) mice 2 weeks post-TAM. Control mice are similar to LAY mutants but possess one wild-type copy of Abca12 (Abca12-c/+). Right images are magnified, single-channel views showing non-cell-autonomous upregulation of Abca12 (red) in LAY mutant skin that does not overlap with YFP+ uHF cells (green). (C) Same as (B) but with IHC for Ki67 (red) 10 weeks post-TAM. (D) Quantitation of proliferation in YFP-negative, basal IFE cells. (E) Volcano plot showing upregulated (red) and downregulated (blue) differentially expressed genes (DEGs) in KA mice compared to control Abca12-c/c mice lacking Cre. (F) KEGG enrichment analysis of DEGs. (G) Venn diagrams showing overlap of DEGs in KA mice, patients with HI, and Abca12-mutant embryonic mice. Overlapping genes from the 3 datasets are depicted in (E). (H) Same as (B) but with IHC for Sprr2d (red, left) or Gjb2 (red, right) 2 weeks post-TAM. For (D): *p < 0.05, **p < 0.01, and ***p < 0.001 by unpaired t test, comparing only samples from the same time point. n ≥ 4 mice per genotype per time point. Error bars indicate mean ± SD. Scale bar, 50 μm. See also Figure S3 and Data S1.
Figure 4.
Figure 4.. Impaired sebum secretion and hair loss following Abca12 deletion in the uHF
(A) Histology showing enlarged SGs (arrows) in LA skin. (B) Quantitation of SG area in LA (red) or control (black) skin. (C) Histology showing enlarged SGs (arrows) in KA skin. (D) Quantitation of SG area in KA (red) or control (black) skin. (E) Oil red O staining showing sebum lipids (arrows) trapped by hyperkeratotic material in the follicle (arrowheads) in LA mice 2–5 weeks post-TAM. (F) Same as (E) but for KA mice 2 weeks post-TAM. Note that follicular hyperkeratosis and sebum occlusion are not observed even though the adjacent IFE is hyperplastic. Right image is magnified view of the center. (G) Photo showing hair loss in two LA mutant mice, both 5 weeks post-TAM (left photo). Enlarged views of hair clumps with oily plugs (arrows) at the proximal end (middle and right photos). For (B) and (D): *p < 0.05 and ***, p < 0.001 by unpaired t test. n = 4 mice per genotype. Error bars indicate mean ± SD. Scale bar, 50 μm.
Figure 5.
Figure 5.. Mutant uHF cells move into the IFE
(A) IHC to trace recombined YFP+ cells (green) in K14-CreERT;Abca12-c/c;ROSA-YFP (KAY) mice. Control mice are similar to KAY mutants but possess one wild-type copy of Abca12 (Abca12-c/+). (B) Quantitation of basal YFP+ cells in the IFE of KAY (red) or control (black) mice. (C) IHC to identify recombined YFP+ cells (green) in LAY mice or controls. Genotypes are identical to those described in Figure 3B. (D) Quantitation of basal YFP+ cells in the IFE of LAY (red) or control (black) mice. (E) IHC for YFP+ cells (green) in KAY or control paw volar skin 15 weeks post-TAM. Arrow, persistent skin thickening in KAY volar skin. (F) Quantitation of basal epidermal YFP+ cells in volar and adjacent haired skin from KAY (red) or control (black) mice. n = 3 mice per genotype. (G) IHC for YFP+ cells (green) in LAY or control volar skin 10 weeks post-TAM. No recombination occurred in volar skin epidermis. For (B) and (D): *p < 0.05 and **p < 0.01 by unpaired t test, comparing only samples from the same time point. n ≥ 4 mice per genotype per time point. Error bars indicate mean ± SD. Scale bar, 50 μm. See also Figure S3.
Figure 6.
Figure 6.. IL-17a neutralization partially alleviates some disease phenotypes
(A) RNAscope in situ staining for Il17a in control, KA, and LA skin 2 weeks post-TAM. Bottom images are magnified views of the uHF. (B) Histology of KA skin treated with anti-IL-17a neutralizing antibody (bottom) or isotype control (top) 2 weeks post-TAM. (C) Quantitation of IFE thickness in KA mice treated with anti-IL-17a neutralizing antibody (red) or isotype control (black) 2 weeks post-TAM. Measurements from untreated control mice (blue) are shown as a reference. (D) Same as (C) but with quantitation for basal IFE proliferation. (E) Same as (C) but with quantitation for suprabasal IFE cell abundance. (F) Same as (C) but with quantitation for basal IFE cell abundance. (G) Histology of LAY skin treated with anti-IL-17a neutralizing antibody (bottom) or isotype control (top) 2 weeks post-TAM (left). IHC for YFP+ mutant cells (green) in these samples (right). (H) Quantitation of IFE thickness in LAY mice treated with anti-IL-17a neutralizing antibody (red) or isotype control (black) 2 weeks post-TAM. Measurements from untreated control mice (blue) are shown as a reference. (I) Same as (H) but with quantitation for basal IFE proliferation. (J) Same as (H) but with quantitation for suprabasal IFE cell abundance. (K) Same as (H) but with quantitation for basal IFE cell abundance. (L) Same as (H) but with quantitation for basal YFP+ mutant cells in the IFE. *p < 0.05 by unpaired t test, comparing only samples from antibody-treated mice. For KA studies, n = 6 mice per treatment group. For LAY studies, n ≥ 8 mice per treatment group. Error bars indicate mean ± SD. Note that identical reference data are shown for (C)–(F) and (H)–(K), respectively, and that reference data were not used for statistical comparisons. n= 3–4 mice for reference data. Scale bar, 50 μm.
Figure 7.
Figure 7.. Targeted deletion of Abca12 in K79+ uHF cells induces ichthyosis-associated phenotypes
(A) IHC for YFP (green) confirming recombination in K79+ uHF cells in K79-Cre;ROSA-YFP mice at P12. (B and C) Gross photos of P7 pups of the indicated genotypes. Only K79-Cre;Abca12-LacZ/c pups exhibited severe skin thickening and flakiness. (D) Quantitation of epidermal thickness for P7 pups of the indicated genotypes. Each data point represents a single mouse. (E) IHC for Abca12 (red) confirming that the protein was not ablated from the IFE of K79-Cre;Abca12-LacZ/c skin at P7. Bottom images are single-channel views of Abca12 staining. (F) IHC for Sprr2d (red) in K79-Cre;Abca12-LacZ/c or control skin at P7. (G) Same as (F) but with staining for Gjb2 (red). (H) Left image, gross photos of two P6 mutant pups, both of genotype K79-Cre;Abca12-LacZ/c with ROSA-YFP. Right image, IHC showing YFP expression (green) in developing hair canals after Cre-mediated recombination and thickened epidermis (red). Asterisk, hyperkeratotic material obstructing hair canals, visible by bright-field overlay. Dotted line denotes the top of the epidermis. See Figure S4E for IHC of littermate control skin. For (D): *p < 0.05 by one-way ANOVA with post hoc Tukey test, comparing K79-Cre;Abca12-LacZ/c pups against Abca12-LacZ/c or K79-Cre;Abca12-c/c pups. n ≥ 6 mice per genotype. Error bars indicate mean ± SD. Scale bar, 50 μm. See also Figure S4.

Update of

References

    1. Candi E, Schmidt R, and Melino G (2005). The cornified envelope: a model of cell death in the skin. Nat. Rev. Mol. Cell Biol. 6, 328–340. - PubMed
    1. Lippens S, Denecker G, Ovaere P, Vandenabeele P, and Declercq W (2005). Death penalty for keratinocytes: apoptosis versus cornification. Cell Death Differ. 12, 1497–1508. - PubMed
    1. Elias PM, Gruber R, Crumrine D, Menon G, Williams ML, Wake-field JS, Holleran WM, and Uchida Y (2014). Formation and Functions of the Corneocyte Lipid Envelope (CLE). Biochim. Biophys. Acta 1841, 314–318. - PMC - PubMed
    1. Lopez-Pajares V, Yan K, Zarnegar BJ, Jameson KL, and Khavari PA (2013). Genetic pathways in disorders of epidermal differentiation. Trends Genet. 29, 31–40. - PMC - PubMed
    1. Feingold KR, and Elias PM (2014). Role of lipids in the formation and maintenance of the cutaneous permeability barrier. Biochim. Biophys. Acta 1841, 280–294. - PubMed

Substances