An official website of the United States government
The .gov means it’s official.
Federal government websites often end in .gov or .mil. Before
sharing sensitive information, make sure you’re on a federal
government site.
The site is secure.
The https:// ensures that you are connecting to the
official website and that any information you provide is encrypted
and transmitted securely.
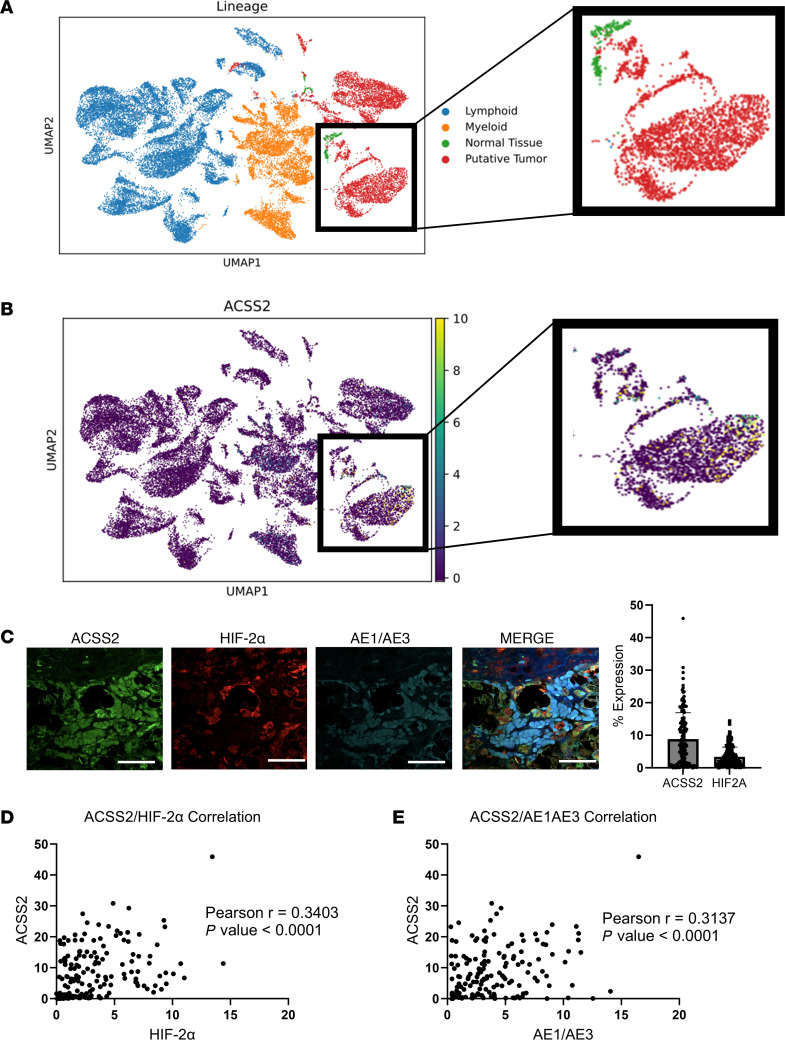
Clear cell renal cell carcinoma (ccRCC) is an aggressive cancer driven by VHL loss and aberrant HIF-2α signaling. Identifying means to regulate HIF-2α thus has potential therapeutic benefit. Acetyl-CoA synthetase 2 (ACSS2) converts acetate to acetyl-CoA and is associated with poor patient prognosis in ccRCC. Here we tested the effects of ACSS2 on HIF-2α and cancer cell metabolism and growth in ccRCC models and clinical samples. ACSS2 inhibition reduced HIF-2α levels and suppressed ccRCC cell line growth in vitro, in vivo, and in cultures of primary ccRCC patient tumors. This treatment reduced glycolytic signaling, cholesterol metabolism, and mitochondrial integrity, all of which are consistent with loss of HIF-2α. Mechanistically, ACSS2 inhibition decreased chromatin accessibility and HIF-2α expression and stability. While HIF-2α protein levels are widely regulated through pVHL-dependent proteolytic degradation, we identify a potential pVHL-independent pathway of degradation via the E3 ligase MUL1. We show that MUL1 can directly interact with HIF-2α and that overexpression of MUL1 decreased HIF-2α levels in a manner partially dependent on ACSS2. These findings identify multiple mechanisms to regulate HIF-2α stability and ACSS2 inhibition as a strategy to complement HIF-2α-targeted therapies and deplete pathogenically stabilized HIF-2α.
Conflict of interest: WKR received an unrestricted grant from the Vanderbilt-Ingram Cancer Center (VICC)–Incyte alliance. JCR is a founder, scientific advisory board member, and former stockholder of Sitryx Therapeutics, a scientific advisory board member and former stockholder of Caribou Biosciences, and a member of the scientific advisory board of Nirogy Therapeutics; has consulted for Merck, Pfizer, and Mitobridge within the past 3 years; and has received research support from Incyte Corp., Calithera Biosciences, and Tempest Therapeutics. KEB has received funding to the institution from Bristol Myers Squibb (BMS)/International Association for the Study of Lung Cancer (IASLC)/Lung Cancer Foundation of America (LCFA), consulted for Aravive, and served on the advisory board for Aveo, BMS, Exelixis, and Seagen.
Figures
Figure 1. ccRCC tumors have robust ACSS2…
Figure 1. ccRCC tumors have robust ACSS2 expression in cancer cells.
( A ) Uniform…
Figure 1. ccRCC tumors have robust ACSS2 expression in cancer cells.
(A) Uniform manifold approximation and projection (UMAP) plot depicting tumor cell lineage with lymphoid (blue), myeloid (orange), normal tissue (green), and tumor (red) represented. Data were normalized to 10,000 reads per cell using Seurat-Scanpy method, then converted to log scale. Inset focuses on large clusters of normal tissue and tumor. (B) UMAP plot (same as in A) depicting ACSS2 expression with intensity scored from 0 (purple) to 10 (yellow). Inset focuses on large clusters of normal tissue and tumor. (C) Representative images from tissue microarray immunofluorescence staining for ACSS2 (green), HIF-2α (red), AE1/AE3 (cyan), and merge with DAPI (blue). Scale bars: 20 μm. Bar graph shows the expression of ACSS2 and HIF-2α as a percentage of each respective sample (n = 159). (D) Pearson’s correlation plot for ACSS2 and HIF-2α. (E) Pearson’s correlation plot for ACSS2 and AE1/AE3.
Figure 2. ACSS2 is essential for ccRCC…
Figure 2. ACSS2 is essential for ccRCC growth and proliferation.
( A and B )…
Figure 2. ACSS2 is essential for ccRCC growth and proliferation.
(A and B) Bar graph quantification of 3 independent replicates of crystal violet growth assay performed in HKC cells (A) or 786-O cells (B). Statistical significance was determined using Tukey’s multiple-comparison test (**P < 0.01; ***P < 0.001; ****P < 0.0001). (C and D) Box-and-whisker plots showing the absorbance values detected at OD450nm of BrdU ELISA assays performed on HKC cells (C) or 786-O cells (D) treated for 24 hours (left) or 48 hours (right) with DMSO or 1 μM, 5 μM, or 10 μM ACSS2i (n = 4). Statistical significance was determined using Bonferroni’s multiple-comparison test (**P < 0.01; ***P < 0.001; ****P < 0.0001). (E) Bar graph quantification of crystal violet staining from 3 independent experiments using 786-O pTRIPZ control or pTRIPZ shACSS2 cells left untreated or treated with 2 μg/mL doxycycline for 48 hours stained with crystal violet. Statistical significance was determined using an unpaired, 2-tailed t test (*P < 0.05). (F) Box-and-whisker plots showing absorbance values detected at OD450nm of BrdU ELISA assays performed on 786-O pTRIPZ control or 786-O pTRIPZ shACSS2 cells treated with 2 μg/mL doxycycline for 24 hours (n = 4). Two-tailed paired t test was used to assess statistical significance (*P < 0.05). See also Supplemental Figure 1.
Figure 3. ACSS2 is essential for tumor…
Figure 3. ACSS2 is essential for tumor growth in vivo.
( A and B )…
Figure 3. ACSS2 is essential for tumor growth in vivo.
(A and B) Box-and-whisker plots showing individual data points for tumor volume over time and tumor weight in mice inoculated with 786-O pTRIPZ control (black, n = 5) or 786-O pTRIPZ shACSS2 (red, n = 5) cells and fed a doxycycline rodent chow or treated with vehicle (black, n = 6) or 15 mg/kg ACSS2i (red, n = 6). Statistical significance was determined using 2-way ANOVA and Šidák’s test for multiple comparisons (*P < 0.05; ***P < 0.0005; ****P < 0.0001). Tumor weight statistical significance was determined using an unpaired, 2-tailed t test (***P < 0.001). (C and D) Representative images taken at ×10 magnification of sections from tumors treated with control or shACSS2 and vehicle or 15 mg/kg ACSS2i and stained with CD31 (left) and periodic acid–Schiff (PAS, right). Scale bars: 200 μm (left), 1,000 μm (right). Data are represented as mean ± SD. See also Supplemental Figure 1.
Figure 4. HIF-2α expression and degradation are…
Figure 4. HIF-2α expression and degradation are regulated by ACSS2 activity.
( A ) Heatmap…
Figure 4. HIF-2α expression and degradation are regulated by ACSS2 activity.
(A) Heatmap showing differential gene expression expressed as fold change (downregulated or upregulated at least 1.5-fold, adjusted P value ≤ 0.05) between control (blue; n = 3) and shACSS2 (red; n = 3) groups. Bar graph showing relative transcript counts from HIF-2α RCC signaling pathway comparing control (blue) and shACSS2 (red) groups. Statistical significance was determined using multiple unpaired, 2-tailed t tests (**P < 0.01; ***P < 0.001; ****P < 0.0001). (B) Representative Western blot analysis of HIF-2α (n = 3), ACSS2 (n = 3), and actin (n = 3) expression following 24-hour doxycycline induction of 786-O pTRIPZ control and pTRIPZ shACSS2 cells. (C) Representative Western blot analysis assessing expression of HIF-2α (n = 3), VEGFR2 (n = 2), Epo (n = 2), and actin (n = 3) in 786-O cells treated with DMSO or 1 μM, 5 μM, or 10 μM ACSS2i for 24 hours. (D) Representative Western blot analysis showing expression of ACSS2 (n = 6), HIF-2α (n = 4), VEGFR2 (n = 3), Epo (n = 3), EGLN3 (n = 3), and actin (n = 6) in 786-O cells transduced with pLX304 empty vector or pLX304 V5-ACSS2 overexpression vector. (E) Representative Western blot and bar chart quantification (n = 3) depicting HIF-2α expression in 786-O cells in the absence or presence of a 1-hour incubation with 10 μM MG132 prior to treatment with DMSO or 5 μM ACSS2i for 24 hours. (F) Western blot images analyzing LC3 A/B (n = 3), K48 polyubiquitination (n = 3), and MUL1 (n = 3) in 786-O cells treated with DMSO or 5 μM ACSS2i for 48 hours. Statistical significance was determined using 2-way ANOVA and Holm-Šidák test for multiple comparisons (*P < 0.05; **P < 0.005). Data are represented as mean ± SD. See also Supplemental Figure 2.
Figure 5. MUL1 engages with HIF-2α and…
Figure 5. MUL1 engages with HIF-2α and displays inverse expression.
( A ) Western blot…
Figure 5. MUL1 engages with HIF-2α and displays inverse expression.
(A) Western blot analysis showing expression of ACSS2 (n = 2), HIF-2α (n = 2), HKII (n = 2), and MUL1 (n = 2) in response to MUL1 overexpression. (B) Western blot images following immunoprecipitations of HIF-2α or MUL1 performed on 786-O cells treated with DMSO or 5 μM ACSS2i for 24 hours (n = 2). (C) Representative images at day 16 of anchorage-independent growth assays (n = 3) performed on 786-O cells transduced to express shControl or shMUL1 and treated with either DMSO, 5 μM ACSS2i, or 10 μM PT-2385, and bar graph quantification. Scale bars: 1,050 μm. Statistical significance was determined using 2-way ANOVA and Tukey’s multiple-comparison test (*P < 0.05; ***P < 0.0005; ****P < 0.0001). See also Supplemental Figures 2 and 3.
Figure 6. ACSS2 activity supports cholesterol biosynthesis and glucose uptake.
( A ) Heatmap showing…
Figure 6. ACSS2 activity supports cholesterol biosynthesis and glucose uptake.
(A) Heatmap showing gene distance from the transcription start site as a measure of accessibility (red, no coverage; blue, maximum coverage). (B) Left: Heatmap showing differential gene expression expressed as fold change (downregulated or upregulated at least 1.1-fold, adjusted P value ≤ 0.05) between groups with 24-hour treatment of 786-O cells with DMSO (blue; n = 3) versus 5 μM ACSS2i (red; n = 3). Gene expression clustering on the y axis depicts genes that are upregulated (purple) and downregulated (green) in the DMSO group. Middle and right: Bar graphs showing transcript counts for genes involved in the cholesterol biosynthesis pathway and glycolysis. Statistical significance was determined by multiple unpaired, 2-tailed t tests (*P < 0.05; **P < 0.005; ***P < 0.0005). (C) Western blot analysis assessing expression of GLUT1 (n = 2), HKII (n = 2), SREBP1 (n = 2), SREBP2 (n = 2), and actin (n = 3) in 786-O cells treated with DMSO or 5 μM or 10 μM ACSS2i for 24 hours. (D) Bar graph showing total cholesterol levels in 786-O cells treated with DMSO (blue; n = 3) or 5 μM ACSS2i (red; n = 3) for 24 hours. Statistical significance was determined using an unpaired, 2-tailed Student’s t test (*P < 0.05). (E) Bar graph showing measured glucose concentrations in the medium of 786-O cells treated with DMSO or 5 μM ACSS2i for 0, 24, and 48 hours (n = 3 for all conditions). Statistical significance was determined using a 2-way ANOVA and Tukey’s multiple-comparison test (***P < 0.0005). Data are represented as mean ± SD.
Figure 7. Enzymatic activity of ACSS2 is…
Figure 7. Enzymatic activity of ACSS2 is required for optimal growth and HIF-2α expression.
( …
Figure 7. Enzymatic activity of ACSS2 is required for optimal growth and HIF-2α expression.
(A) Left: Representative images of crystal violet staining of HEK293FT cells 72 hours after transfection with an empty vector control (EV), WT-ACSS2, or ΔT376K catalytically inactive mutant. Right: Bar graph showing quantification of 3 independent experiments in HEK293FT cells. Statistical significance was determined using a 1-way ANOVA and Tukey’s multiple-comparison test (*P < 0.05; **P < 0.01). Data are represented as mean ± SD. (B) Western blot images showing expression of HIF-2α (n = 3), ACSS2 (n = 3), and actin (n = 3) in 786-O Cas9 sgControl and sgACSS2 cells transfected with EV, WT-ACSS2, or ΔT376K. (C) Left: Representative images of crystal violet staining of 786-O Cas9 cells stably transduced to express sgControl or sgACSS2 72 hours after transfection with an empty vector control (EV), WT-ACSS2, or ΔT376K catalytically inactive mutant. Right: Bar graph showing quantification of 3 independent experiments in 786-O Cas9 cells. Statistical significance was determined using a 2-way ANOVA and Tukey’s multiple-comparison test (*P < 0.05; **P < 0.01). Data are represented as mean ± SD. (D) Representative images from day 4 of a tumor sphere formation assay where 786-O Cas9 sgControl and sgACSS2 cells were transfected with EV, WT-ACSS2, or ΔT376K.
Figure 8. Targeting ACSS2 elicits cancer cell-specific…
Figure 8. Targeting ACSS2 elicits cancer cell-specific mitochondrial defects.
( A and B ) Representative…
Figure 8. Targeting ACSS2 elicits cancer cell-specific mitochondrial defects.
(A and B) Representative images of HKC control cell mitochondria (A) and 786-O mitochondria (B) treated with DMSO for 72 hours or with 5 μM ACSS2i for 24, 48, and 72 hours (n = 3). (C) 786-O pTRIPZ control (n = 3) and shACSS2 (n = 3) cells induced with 2 μg/mL doxycycline for 48 hours. (D) 786-O cells overexpressing ACSS2 transduced with shControl (n = 3) or shHIF2A (n = 3). Scale bars: 1 μm for all images. See also Supplemental Figure 4.
Figure 9. ACSS2 inhibition selectively impedes cancer cell growth and HIF-2α expression in ccRCC patient…
Figure 9. ACSS2 inhibition selectively impedes cancer cell growth and HIF-2α expression in ccRCC patient samples.
(A) Western blot images showing expression of HIF-2α, AE1/AE3, E-cadherin, pan-tubulin, and actin in normal adjacent cells and tumor cells derived from a ccRCC patient. (B) Western blot images showing expression of HIF-2α, MUL1, HKII, E-cadherin, AE1/AE3, and OXPHOS complexes in cancer cells derived from a ccRCC patient treated with DMSO, 5 μM ACSS2i, or 10 μM PT-2385 for 48 hours. (C) Box plot depicting quantification of BrdU labeling in ccRCC patient cancer cells treated with DMSO, 5 μM ACSS2i, or 10 μM PT-2385 for 48 hours (n = 4). Statistical significance was determined using Bonferroni’s multiple-comparison test (*P < 0.01; **P < 0.01; ***P < 0.001). (D) Representative images from day 7 of a tumor sphere formation assay where ccRCC patient cancer cells were treated with DMSO, 5 μM ACSS2i, or 10 μM PT-2385 (n = 3). (E) Left: Representative images of crystal violet staining from a 72-hour dose-response treatment with DMSO or ACSS2i in 769-P cells. Right: Bar graph showing crystal violet quantification of 769-P cells (n = 3) in the presence or absence of 10 μM PT-2385 treated with DMSO or 1 μM, 5 μM, or 10 μM ACSS2i for 24, 48, and 72 hours (n = 3). Statistical significance was determined using a 2-way ANOVA and Tukey’s multiple-comparison test. **P < 0.01; ***P < 0.001; ****P < 0.0001. Data are represented as mean ± SD. See also Supplemental Figure 5.
Cancer Genome Atlas Research Network. Comprehensive molecular characterization of clear cell renal cell carcinoma. Nature. 2013;499(7456):43–49. doi: 10.1038/nature12222.
-
DOI
-
PMC
-
PubMed
Toma MI, et al. Loss of heterozygosity and copy number abnormality in clear cell renal cell carcinoma discovered by high-density Affymetrix 10K single nucleotide polymorphism mapping array. Neoplasia. 2008;10(7):634–642. doi: 10.1593/neo.08160.
-
DOI
-
PMC
-
PubMed
Kondo K, et al. Inhibition of HIF is necessary for tumor suppression by the von Hippel-Lindau protein. Cancer Cell. 2002;1(3):237–246. doi: 10.1016/S1535-6108(02)00043-0.
-
DOI
-
PubMed
Shen C, et al. Genetic and functional studies implicate HIF1α as a 14q kidney cancer suppressor gene. Cancer Discov. 2011;1(3):222–235. doi: 10.1158/2159-8290.CD-11-0098.
-
DOI
-
PMC
-
PubMed
Du W, et al. HIF drives lipid deposition and cancer in ccRCC via repression of fatty acid metabolism. Nat Commun. 2017;8(1):1769. doi: 10.1038/s41467-017-01965-8.
-
DOI
-
PMC
-
PubMed