. 2024 Jun 17;134(12):e175033.
doi: 10.1172/JCI175033.

STING agonist 8803 reprograms the immune microenvironment and increases survival in preclinical models of glioblastoma

Affiliations

STING agonist 8803 reprograms the immune microenvironment and increases survival in preclinical models of glioblastoma

Hinda Najem et al. J Clin Invest. .

Abstract

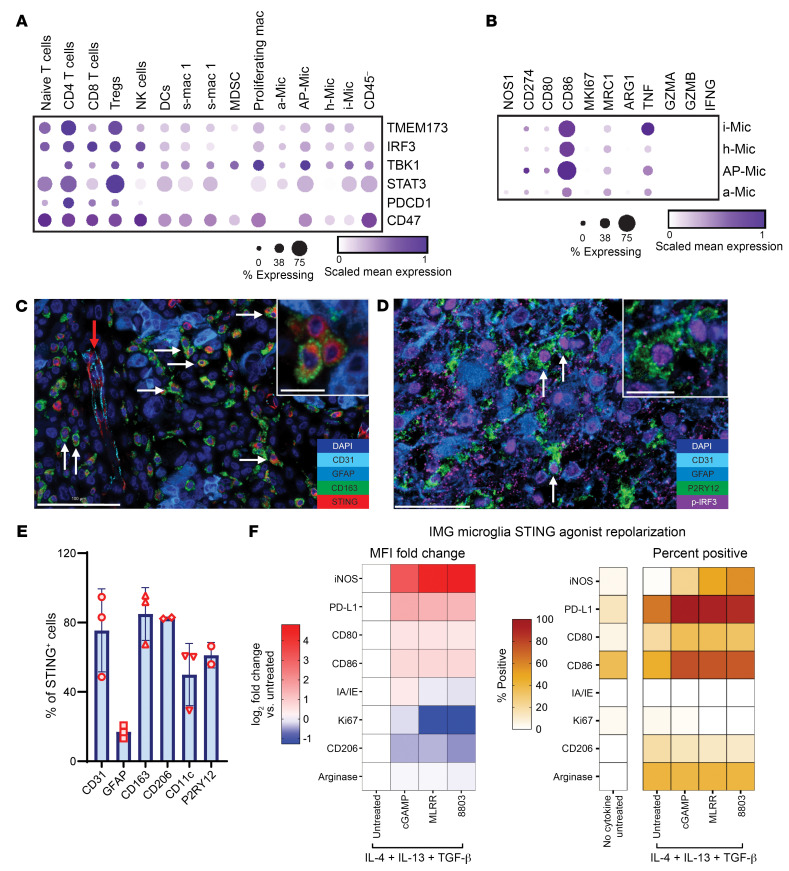
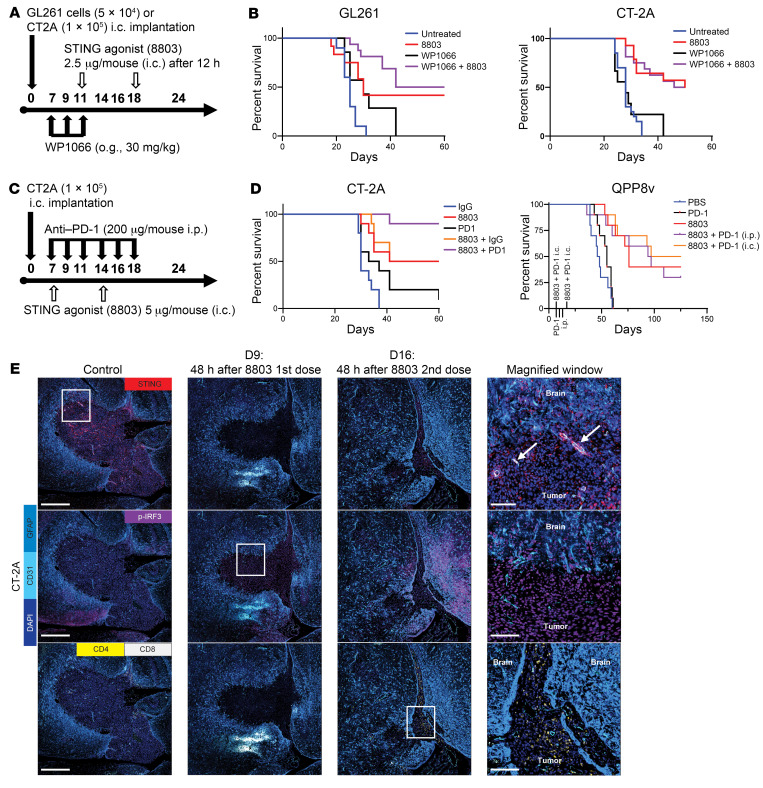
STING agonists can reprogram the tumor microenvironment to induce immunological clearance within the central nervous system. Using multiplexed sequential immunofluorescence (SeqIF) and the Ivy Glioblastoma Atlas, STING expression was found in myeloid populations and in the perivascular space. The STING agonist 8803 increased median survival in multiple preclinical models of glioblastoma, including QPP8, an immune checkpoint blockade-resistant model, where 100% of mice were cured. Ex vivo flow cytometry profiling during the therapeutic window demonstrated increases in myeloid tumor trafficking and activation, alongside enhancement of CD8+ T cell and NK effector responses. Treatment with 8803 reprogrammed microglia to express costimulatory CD80/CD86 and iNOS, while decreasing immunosuppressive CD206 and arginase. In humanized mice, where tumor cell STING is epigenetically silenced, 8803 therapeutic activity was maintained, further attesting to myeloid dependency and reprogramming. Although the combination with a STAT3 inhibitor did not further enhance STING agonist activity, the addition of anti-PD-1 antibodies to 8803 treatment enhanced survival in an immune checkpoint blockade-responsive glioma model. In summary, 8803 as a monotherapy demonstrates marked in vivo therapeutic activity, meriting consideration for clinical translation.

Keywords: Brain cancer; Cancer immunotherapy; Immunology; Oncology; Signal transduction.


Figures

Figure 1
Figure 1. The prognostic impact and localization of the STING pathway in human glioblastoma.
(A) Kaplan-Meier survival curves of newly diagnosed IDH-1–WT glioblastoma patients stratified based on high versus low expression stratified on the median of the designated marker. STING (TMEM173): high (n = 71, events = 62; median = 12.6); low (n = 71, events = 54, median = 13.8); HR = 1 (0.69–1.45); log-rank P value = 0.99; Wilcoxon’s P value = 0.92. IRF3: high (n = 71; events = 62; median = 11.2); low (n = 71, events = 54; median = 14.7); HR = 0.84 (0.58–1.22); log-rank P value = 0.37; Wilcoxon’s P value = 0.08. Tbk1: high (n = 72, events = 57, median = 12.9); low (n = 70, events = 59, median = 13.8); HR = 0.74 (0.51–1.08); log-rank P value = 0.12; Wilcoxon’s P value = 0.67. STAT3: high (n = 72, events = 57, median = 11.8); low (n = 70, events = 59, median = 13.8); HR = 0.74 (0.51–1.08); log-rank P value = 0.11; Wilcoxon’s P value = 0.23. PD-1 (PDCD1): high (n = 72, events = 57, median = 12.3); low (n = 70, events = 59, median = 13.8); HR = 0.94 (0.65–1.36); log-rank P value = 0.76; Wilcoxon’s P value = 0.72. (B) RNA sequencing data from the Ivy Glioblastoma Atlas project was analyzed based on differences in the anatomical locations of these markers in primary gliomas. The y axes show z score–normalized mRNA expression. LE, leading edge; IT, infiltrating tumor; CT, cellular tumor; PZ, perinecrotic zone; PS, pseudopalisading cells around necrosis; HPV, hyperplastic blood vessels in cellular tumor; MP, microvascular proliferation. (C) Representative multiplexed sequential immunofluorescence (SeqIF) imaging of human glioblastoma showing the transition of the microenvironment from tumor to brain, with the highest expression of perivascular STING at the edge. Color panel: DAPI, dark blue; CD31, cyan blue; GFAP, blue; and STING, red. Scale bar: 500 μm. (D) Representative multiplexed SeqIF imaging of human glioblastoma, demonstrating the confinement of T cells to the perivascular regions of CD31+ vessels, as described and quantified in the spatial bioinformatic analysis protocol by Najem et al. (57). Color panel: DAPI, dark blue; CD31, cyan blue; GFAP, blue; STING, red; CD4, yellow; and CD8, white. Yellow arrows indicate CD4+ T cells and white arrows indicate CD8+ T cells. Scale bar: 100 μm. (E) Analysis of mRNA STING expression in non–tumor-bearing brain relative to high-grade glioma (HGG) (27). Box-and-whisker plots show the minimum and maximum; lines represent 25%, median, and 75%. For non-tumor, min: 5.936, max: 7.743, 25%: 6.113, 75%: 7.083, median: 6.753. For HGG, min: 6.715, max: 8.158, 25%: 7.451, 75%: 8.229, median: 7.668. ****P < 0.0001 (2-tailed Student’s t test).
Figure 2
Figure 2. Therapeutic effect of the STING agonist 8803 in immune checkpoint blockade–resistant preclinical models of glioblastoma.
(A) Treatment of immunocompetent C57BL/6J mice with i.c. implantation of either QPP4 or QPP8 glioma cells. The survival rate of C57BL/6J mice with i.c. implanted QPP4 treated with 8803 (5 μg) on days 14 and 28 (n = 16) significantly prolonged survival relative to vehicle control mice (n = 16; median survival [MS] = 72 days; log-rank P = 0.0003). Similarly, both 8803 and 8879 (n = 17; undefined MS) were curative in the QPP8 model (control group: n = 15; MS = 103 days) when they were administered on days 14, 21, and 28 after implantation. Agonist 8803 versus vehicle control (log-rank P < 0.0001); 8879 versus vehicle control (log-rank P = 0.0002). (B) Flow cytometric analysis of tumor-infiltrating immune cells using BD LSRFortessa X-30 prototype flow cytometry. QPP8 cells were orthotopically implanted in C57BL/6J mice and then treated with PBS or 5 μg 8803 on days 60 and 67. Tumors were isolated 48 hours after the final treatment and immune cells were collected using a Percoll gradient. The total amount of immune cells was quantified based on all live CD45+ cells and specifically on CD11b+Ly6C+ expression of mono-MDSCs. (C) Within the myeloid compartment from the tumor and cervical lymph nodes (LNs), immune cell lineages were identified based on standard surface markers (Supplemental Table 1), and then the mean fluorescence intensity (MFI) was quantified based on treatment. Each dot represents an analyzed tumor or LN. (D) Expression of immunosuppressive markers CD206 and CD163 spanning myeloid populations and as a function of treatment. (E) Myeloid PD-L1 expression on various immune lineages in tumors and LNs. (F) Conventional type 1 DCs (cDC1s) were increased in both tumor and LNs in response to 8803. (G) Immunosuppressive arginase expression spanning myeloid populations and as a function of treatment. *P < 0.05; **P < 0.01; ***P < 0.001; ****P < 0.0001 by 2-tailed Student’s t test (BG).
Figure 3
Figure 3. STING agonist 8803 induces immune effector responses within gliomas.
Flow cytometric analysis of QPP8-infiltrating immune cells using BD LSRFortessa X-30 prototype flow cytometer. QPP8 cells were orthotopically implanted into C57BL/6J mice and then treated with PBS or 5 μg 8803 on days 60 and 67. Tumors were isolated 48 hours after the final treatment, and immune cells were collected using a Percoll gradient. (A) Within the CD8+ T cell compartment from the tumor and cervical lymph nodes (LNs), 8803 enhanced the number of infiltrating CD8+ T cells. (B) CD8+ T cell immune exhaustion markers such as PD-1 and LAG-3 were decreased, but proliferation and granzyme B expression increased. (C) NK cell infiltration and frequency and granzyme B expression were increased in 8803-treated gliomas. (D) The survival rate estimated by the Kaplan-Meier method of RAG–/– versus WT C57BL/6J mice implanted with QPP8v (subclone) and treated with STING agonist 8803 versus PBS. RAG–/– control (PBS): 5 mice (median survival [MS]: 63 days); WT control: 5 mice (MS: 76 days); RAG–/– 8803: 5 mice (MS: 55 days); WT 8803: 5 mice (MS: undefined; 3 long-term survivors). Statistics (log-rank test): RAG–/– control versus WT control P = 0.209; RAG–/– control versus RAG–/– 8803 P = 0.192; RAG–/– control versus WT 8803 P = 0.0018; RAG–/– 8803 versus WT 8803 P = 0.0018; RAG–/– 8803 versus WT control P = 0.014; WT control versus WT 8803 P = 0.0018. (E) The survival estimated by the Kaplan-Meier method of C57BL/6J mice implanted with QPP8v and treated with either 8803 or the combination of 8803 + NK1.1 antibody (αNK1.1). Control (PBS): 5 mice (MS: 34 days); 8803: 5 mice (MS: 76 days); 8803 + αNK1.1: 5 mice (MS: 79 days). Statistics (log-rank test): control versus 8803 P = 0.0017; control versus 8803 + αNK1.1 P = 0.0062; 8803 versus 8803 + αNK1.1 P = 0.92. (F) Expansion of OT-1 CD8+ T cells or WT CD8+ T cells collected from spleen and then treated with PBS versus 8803 at 1, 5, and 10 μM. *P < 0.05; **P < 0.01; ***P < 0.001; ****P < 0.0001 by 2-tailed Student’s t test (AC) or 2-way ANOVA (F).
Figure 4
Figure 4. STING expression within human glioblastoma microglia and reprogramming with 8803.
(A) Dot plot showing key gene expression from scRNA-seq of 44 tumor fragments representing 18 glioma patients, including low-grade gliomas (n = 2), newly diagnosed glioblastoma (n = 11), and recurrent glioblastoma (n = 5) analyzed from Abdelfattah et al. (56). Bubble size corresponds to the percentage of cells expressing a gene marker; colors indicate scaled mean expression. (B) Dot plot of selected gene expression within microglia subtypes. CD45 cells include both endothelial and tumor cells. (B) Immune effector functions of microglia subtypes. (C) Representative multiplexed sequential immunofluorescence (SeqIF) imaging of human glioblastoma demonstrating the expression of STING in CD163+ macrophages denoted by white arrows in proximity to the CD31 tumor vasculature (red arrow). Scale bar: 100 μm. A higher magnification image of STING+ CD163+ cells is represented at the upper right quadrant (scale bar: 20 μm). (D) Representative multiplexed SeqIF imaging of human glioblastoma, demonstrating the expression of p-IRF3 (downstream activation of STING pathway) in P2RY12+ microglia denoted by the white arrows. Scale bar: 50 μm. A higher magnification image of p-IRF3+P2RY12+ cells is represented at the upper right quadrant (scale bar: 20 μm). (E) Quantification plot showing the percentages of STING expression in the different cell populations within the human glioblastoma TME. (F) IL-4–, IL-13–, and TGF-β–polarized murine IMG microglia were treated for 48 hours with STING agonists (10 μg/mL), with increasing potency from cGAMP to MLRR-S2-CDA to 8803, and profiled based on various markers. These were quantified based on MFI fold change or percentage of cells that are positive and then presented as a heatmap.
Figure 5
Figure 5. Therapeutic effect of STING agonist 8803 in humanized glioma mouse model recapitulating human glioblastoma.
(A) Multiplexed sequential immunofluorescence images of the STING expression at baseline in humanized mouse brain implanted with U87 glioma cells and collected at endpoint. The right image represents a high magnification of the white box drawn in the left image. The white arrows highlight CD31+STING+ vessels and green arrows highlight the CD163+STING+ macrophages. DAPI (dark blue), GFAP (light blue), CD31 (cyan blue), STING (red), CD163 (green). Scale bars: 500 μm (left panel) and 50 μm (right panel). A higher magnification image of a CD163+STING+ cell is represented at the upper right quadrant of the right image (scale bar: 20 μm). (B) Humanized mice that underwent i.c. implantation of 112.5 × 10³ (survival) or 90 × 103 (immune infiltrate analysis) human U87 glioma cells treated with PBS (n = 18), the moderately potent STING agonist MLRR-S2-CDA (n = 19), or 8803 (n = 12) on days 5, 10, and 15. The survival rate of the humanized mice was estimated by the Kaplan-Meier method. Control: median survival (MS): 26.5 days, MLRR-S2-CDA MS: 35 days, 8803 MS: 43.5 days. Statistics: control versus MLRR-S2-CDA log-rank ****P < 0.0001; control versus 8803 log-rank ****P < 0.0001. (C) Luxol Fast Blue demonstrating uniform staining without evidence of clearance that would be reflective of demyelination in the CNS in either the control or 8803-treated brains (×1.5 magnification). (D) Representative hematoxylin and eosin–stained coronal sections of mice at the survival endpoint demonstrating persistent glioma after treatment with 8803. Original magnification, ×1.25 (left and middle images) and ×10 (bottom right image). (E) Ex vivo Flow cytometric analysis of U87-infiltrating human immune cells using BD LSRFortessa X-30 prototype flow cytometer. MFI, mean fluorescence intensity; h, human; TAM, tumor-associated macrophage; Mono, monocyte; PMN, peripheral mononuclear cell; MDSC, myeloid-derived suppressor cell. (F) WT C57BL/6J mouse bone marrow–derived macrophages pretreated with IL-4 for 48 hours followed by STING agonist 8803 for the indicated times (24 hours and 48 hours). The markers were assessed via Cytek Aurora flow cytometer and the CD45+CD11b+ population was analyzed for the indicated markers. *P < 0.05; **P < 0.01; ***P < 0.001; ****P < 0.0001 by 2-tailed Student’s t test (EF).
Figure 6
Figure 6. The STAT3 inhibitor, WP1066, in combination with STING in the GL261 murine glioma model.
(A) Schema of the treatment of immunocompetent mice that underwent i.c. implantation of GL261 glioma cells. Seven days after GL261 implantation, mice were treated with WP1066 (60 mg/kg) by oral gavage (o.g.) 3 times per week (M/W/F) for 3 weeks. On day 7, mice were treated intratumorally with the STING agonist 8803 (5 μg). The survival rate of C57BL/6J mice was estimated by the Kaplan-Meier method. Control: 11 mice (median survival [MS]: 18 days), WP1066: 8 mice (MS: 21 days), 8803: 8 mice (MS: 143.5 days); 4 long-term survivor), WP1066 + 8803 agonist: 7 mice (MS: 25 days). Statistics (log-rank test): control versus WP1066 P = 0.0047; control versus 8803 P < 0.0001; control versus WP1066 + 8803 P = 0.0002; WP1066 versus WP1066 + 8803 P = 0.02; 8803 versus WP1066 + 8803 P = 0.0005; 8803 versus WP1066 P < 0.0001. (B) In vitro luciferase expression assay for the induction of IFN responses. Various concentrations of the STING agonist 8803 were used to induce the luciferase expression in the top panels. A physiological (2 μM) and a high dose (5 μM) of WP1066 was used in combination. Direct cellular cytotoxicity was measured during the above experimental conditions (lower panels). At a WP1066 concentration of 5 μM, there was a decrease in IFN activity, which was not attributed to cell viability. (C) WP1066 decreases STING protein expression in THP-1 cells in a dose-dependent manner. THP-1 cells were treated with the indicated concentrations of WP1066. Cells were collected and analyzed by Western blotting. (D) Ubiquitination assay of STING in THP-1 cells indicates that WP1066 induces STING ubiquitination in a dose-dependent manner. MG132, proteasome inhibitor used in all conditionsl; IB, immunoblotting; UB, ubiquitination blotting; IP, immunoprecipitation.
Figure 7
Figure 7. Dose and schedule adjustments for combinatorial WP1066 with 8803: combination with anti–PD-1.
(A) Schema of the treatment of immunocompetent mice that underwent i.c. implantation of either GL261 or CT-2A glioma cells. (B) The survival rate estimated by the Kaplan-Meier method of C57BL/6J mice implanted with GL261 and CT-2A. For the GL261 survival: control: 10 mice (median survival [MS]: 25 days), WP1066: 10 mice (MS: 30 days), 8803: 14 mice (MS: 30 days; 5 long-term survivors), WP1066 + 8803: 16 mice (MS: 71 days; 8 long-term survivors). Statistics (log-rank test): control versus WP1066 P = 0.04; control versus 8803 P = 0.01; control versus WP1066 + 8803 P < 0.0001; WP1066 versus WP1066 + 8803 P = 0.006; 8803 versus WP1066 + 8803 P = 0.32. For the CT-2A survival: control: 10 mice (MS: 28 days), WP1066: 9 mice (MS: 28 days), 8803: 14 mice (MS: 50 days; 7 long-term survivors), WP1066 + 8803: 16 mice (MS: 48 days; 8 long-term survivors). Statistics (log-rank test): control versus WP1066 P = 0.57; control versus 8803 P < 0.0001; control versus WP1066 + 8803 P < 0.0001; WP1066 versus WP1066 + 8803 P < 0.001; 8803 versus WP1066 + 8803 P = 0.95. (C) Schema of the treatment of immunocompetent mice that underwent i.c. implantation of either CT-2A or QPP8v (subclone) glioma cells. QPP8v tumors received 8803 (5 μg/mouse i.c. on days 7 and 17), anti–PD-1 (25 μg i.c. on days 7 and 17), and vehicle control (PBS) or anti–PD-1 (250 μg i.p. on days 7, 10, and 13) in single and combination therapies. (D) The survival rate estimated by the Kaplan-Meier method of C57BL/6J mice implanted with CT-2A and QPP8. For CT-2A: IgG: 10 mice (MS: 30 days); anti–PD-1: 10 mice (MS: 35 days), 8803: 10 mice (MS: 56 days, 4 long-term survivors); 8803 + anti–PD-1: 10 mice (MS: undefined, 8 long-term survivors); 8803 + IgG: 10 mice (MS: 65.5 days, 5 long-term survivors). Statistics (log-rank test): IgG versus anti–PD-1 P = 0.04; IgG versus 8803 P < 0.01; IgG versus 8803 + anti–PD-1 P < 0.0001; anti–PD-1 versus 8803 + anti–PD-1 P < 0.001; 8803 versus 8803 + anti–PD-1 P = 0.04; 8803 + IgG versus 8803 + anti–PD-1 P = 0.12. For QPP8: PBS: 10 mice (MS: 47 days); anti–PD-1: 10 mice (MS: 55 days); 8803: 10 mice (MS: 76 days, 4 long-term survivors); 8803 + anti–PD-1 (i.p.): 10 mice (MS: 95.5 days, 3 long-term survivors); 8803 + anti–PD-1 (i.c.): 10 mice (MS: 111 days, 5 long-term survivors). Statistics (log-rank test): PBS versus anti–PD-1 P = 0.164; PBS versus 8803 P < 0.0001; PBS versus 8803 + anti–PD-1 (i.p.) P = 0.0006; PBS versus 8803 + anti–PD-1 (i.c.) P < 0.0001; anti–PD-1 versus 8803 P < 0.0001; anti–PD-1 versus 8803 + anti–PD-1 (i.p.) P = 0.002; anti–PD-1 versus 8803 + anti–PD-1 (i.c.) P < 0.0001; 8803 versus 8803 + anti–PD-1 (i.c.) P = 0.57; 8803 versus 8803 + anti–PD-1 (i.p.) P = 0.85. (E) Multiplexed sequential immunofluorescence images of untreated CT-2A gliomas (n = 3). Forty-eight hours after either the first (day 9) or second dose (day 16) of 8803, animals were euthanized and the brains were imaged for the following (n = 3/group): DAPI (dark blue), GFAP (light blue), CD31 (cyan blue), STING (red), p-IRF3 (pink), CD4+ (yellow), and CD8+ (white) T cells. White boxes outline the portion shown at higher magnification in the right column of images. Scale bars: 500 μm (left 3 columns) and 50 μm (right column).

References

    1. Stupp R, et al. Effect of tumor-treating fields plus maintenance temozolomide vs maintenance temozolomide alone on survival in patients with glioblastoma: a randomized clinical trial. JAMA. 2017;318(23):2306–2316. doi: 10.1001/jama.2017.18718. - DOI - PMC - PubMed
    1. Lukas RV, Mrugala MM. Pivotal therapeutic trials for infiltrating gliomas and how they affect clinical practice. Neurooncol Pract. 2017;4(4):209–219. doi: 10.1093/nop/npw016. - DOI - PMC - PubMed
    1. Gong J, et al. Development of PD-1 and PD-L1 inhibitors as a form of cancer immunotherapy: a comprehensive review of registration trials and future considerations. J Immunother Cancer. 2018;6(1):8. doi: 10.1186/s40425-018-0316-z. - DOI - PMC - PubMed
    1. Reardon DA, et al. Effect of nivolumab vs bevacizumab in patients with recurrent glioblastoma: the checkmate 143 phase 3 randomized clinical trial. JAMA Oncol. 2020;6(7):1003–1010. doi: 10.1001/jamaoncol.2020.1024. - DOI - PMC - PubMed
    1. Arrieta VA, et al. The possibility of cancer immune editing in gliomas. A critical review. Oncoimmunology. 2018;7(7):e1445458. doi: 10.1080/2162402X.2018.1445458. - DOI - PMC - PubMed