. 2024 Jun 28;10(26):eado1855.
doi: 10.1126/sciadv.ado1855. Epub 2024 Jun 28.

TGR5 deficiency in excitatory neurons ameliorates Alzheimer's pathology by regulating APP processing

Affiliations

TGR5 deficiency in excitatory neurons ameliorates Alzheimer's pathology by regulating APP processing

Chenli Li et al. Sci Adv. .

Abstract

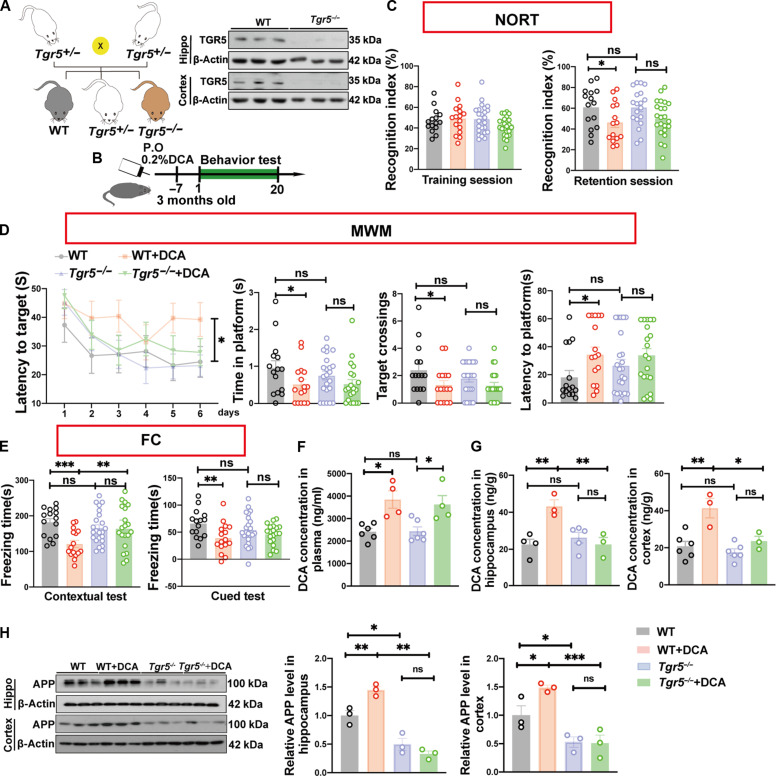
Bile acids (BAs) metabolism has a significant impact on the pathogenesis of Alzheimer's disease (AD). We found that deoxycholic acid (DCA) increased in brains of AD mice at an early stage. The enhanced production of DCA induces the up-regulation of the bile acid receptor Takeda G protein-coupled receptor (TGR5), which is also specifically increased in neurons of AD mouse brains at an early stage. The accumulation of exogenous DCA impairs cognitive function in wild-type mice, but not in TGR5 knockout mice. This suggests that TGR5 is the primary receptor mediating these effects of DCA. Furthermore, excitatory neuron-specific knockout of TGR5 ameliorates Aβ pathology and cognition impairments in AD mice. The underlying mechanism linking TGR5 and AD pathology relies on the downstream effectors of TGR5 and the APP production, which is succinctly concluded as a "p-STAT3-APH1-γ-secretase" signaling pathway. Our studies identified the critical role of TGR5 in the pathological development of AD.


Figures

Fig. 1.
Fig. 1.. Enhanced of DCA level and TGR5 expression in brain of 5×FAD mice.
(A) Relative levels of bile acid in hippocampus and cortex of 5×FAD mice and littermate age-matched controls. (B) Concentration of DCA in hippocampus and cortex of 5×FAD and control mice at the age of 1, 3, and 4.5 months. (C) Major membrane and nucleus BA receptors. (D) Relative mRNA levels of membrane BA receptors in hippocampus and cortex of 5×FAD mice and age-matched controls. (E) Relative mRNA levels of membrane receptors in primary neurons treated with DCA. (F) Expression of TGR5 in cultured primary neurons, astrocytes, and microglia in vitro. (G) Double immunostaining of TGR5 with NeuN, GFAP, and Iba1 in CA1 of hippocampus and cortex; sections were counterstained with 4′,6-diamidino-2-phenylindole (DAPI) (blue). Scale bar, 2 μm. (H and I) Protein levels of APP and TGR5 in hippocampus (H) and cortex (I) of 5×FAD mice and age-matched controls were measured by Western blotting. (J) TGR5 protein levels in primary neurons treated with 100 nM Aβ1–42. (K) TGR5 protein levels in primary neurons treated with 100 μM DCA and 100 nM Aβ1–42 for 24 hours. The statistical analysis was presented below. (L and M) Neuron-specific expression DEGs in AD (L) and the mRNA levels of Tgr5 form patients with AD (M) (GEO: GSE162873 and GSE63060). Error bars represent SEM, and statistical analyses were done using unpaired two-tailed Student’s t test or one-way ANOVA (Tukey’s post hoc test). *P < 0.05 and **P < 0.01. WT, wild type; DMSO, dimethyl sulfoxide; PBS, phosphate-buffered saline, ns, not significant.
Fig. 2.
Fig. 2.. TGR5 deletion attenuates cognitive impairments and APP up-regulation induced by DCA.
(A) Generation of TGR5 general knockdown mice (Tgr5−/− mice) and the TGR5 protein levels in hippocampus and cortex from WT and Tgr5−/− mice were measured by Western blotting. (B) Schematic diagram of chronic oral DCA supplementation (drinking water for 1 week). (C to E) Four groups of mice were subjected to NORT (C), MWM (D), and FC (E) analysis. (F and G) DCA levels in plasm (F) and hippocampus/cortex (G) of WT mice, WT + DCA mice, Tgr5−/− mice, and Tgr5−/− mice + DCA mice. (H) The APP protein levels in hippocampus and cortex from WT mice, WT + DCA mice, Tgr5−/− mice, and Tgr5−/− + DCA mice were measured by Western blotting. Error bars represent SEM, and statistical analyses were done using one-way analysis of variance (ANOVA) (Tukey’s post hoc test), *P < 0.05 and **P < 0.01.
Fig. 3.
Fig. 3.. TGR5 deficiency rescues learning and memory impairments in 5×FAD mice.
(A) Generation strategy of TGR5-AD knockout mice: Tgr5+/− mice were crossed with Tgr5+/−5×FAD mice to generate Tgr5−/−5×FAD mice. (B) Six-month-old mice were subjected to behavioral tests. (C to E) WT, 5xFAD, and Tgr5−/−5×FAD mice were subjected to the NORT tests (C), the MWM tests (D), and the FC tests (E). (F) DCA levels in hippocampus, cortex, and plasm from WT, 5×FAD, and Tgr5−/−5×FAD mice. (G to I) Representative Aβ immunostaining in the hippocampus and cortex of WT, 5×FAD, and Tgr5−/−5×FAD mice. The whole-brain Aβ immunostaining was presented in (G), and the statistical analysis of Aβ burdens in hippocampus and cortex was also presented. Scale bars, 2 mm and 50 μm, respectively. (J and K) APP protein levels in hippocampus (J) and cortex (K) 5×FAD and Tgr5−/−5×FAD mice were measured by Western blotting. Error bars represent SEM, and statistical analyses were done using one-way ANOVA (Tukey’s post hoc test). *P < 0.05 and **P < 0.01.
Fig. 4.
Fig. 4.. Excitatory neuron deletion of TGR5 ameliorates cognitive impairments induced by DCA, not in inhibitory neuron.
(A) The double staining of TGR5 (green) with excitatory neuronal marker CamKII (red) or inhibitory neuronal marker GAD67 (red) in brain sections from 3-month-old WT mice; sections were counterstained with DAPI (blue). Scale bar, 20 μm. (B and C) Generation of excitatory neuronal TGR5 knockdown mice (B) by crossing Tgr5F/F mice with CamKIIα-Cre mice and inhibitory neuronal TGR5 knockout mice (C) by crossing Tgr5F/F mice with Gad2-Cre mice. (D) Schematic diagram of chronic oral DCA supplementation and following behavioral tests. (E to G) Six groups of mice indicated were subjected to NORT (E), MWM (F), and FC (G) analysis. (H) DCA levels in hippocampus and cortex from Tgr5F/F mice; Tgr5F/F + DCA mice; CamKIIα,Tgr5F/F mice, CamKIIα,Tgr5F/F + DCA mice; Gad2, Tgr5F/F mice; and Gad2, Tgr5F/F + DCA mice. (I) APP protein levels in hippocampus and cortex of Tgr5F/F mice, Tgr5F/F + DCA mice; CamKIIα,Tgr5F/F mice; and CamKIIα,Tgr5F/F + DCA mice were measured by Western blotting, and the statistical analysis of APP protein levels was also presented. (J) APP protein levels in hippocampus and cortex of Tgr5F/F mice; Tgr5F/F + DCA mice; Gad2, Tgr5F/F mice; and Gad2, Tgr5F/F + DCA mice were measured by Western blotting, and the statistical analysis of APP protein levels were also presented. Error bars represent SEM, and statistical analyses were done using one-way ANOVA (Tukey’s post hoc test). *P < 0.05 and **P < 0.01.
Fig. 5.
Fig. 5.. Excitatory neuron deletion of TGR5 ameliorates cognitive impairments and Aβ burdens in 5×FAD mice.
(A) Generation of excitatory neuronal TGR5 knockout 5×FAD (CamKIIα,Tgr5F/F5×FAD) mice and the littermate control mice. (B) These mice were subjected for behavioral tests at 6 months old. (C to E) CamKIIα,Tgr5F/F5×FAD mice, Tgr5F/F5×FAD mice, and Tgr5F/F mice were subjected to NORT tests (C), the MWM tests (D), and FC tests (E). (F) DCA levels in cortex from Tgr5F/F mice; Tgr5F/F5×FAD mice; and CamKIIα,Tgr5F/F5×FAD mice. (G) Protein levels of APP and TGR5 in hippocampus and cortex of Tgr5F/F mice; Tgr5F/F5×FAD mice; CamKIIα,Tgr5F/F mice; and CamKIIα,Tgr5F/F5×FAD mice were measured by Western blotting, and the statistical analysis of APP and TGR5 protein levels was presented on the below. (H) Levels of Aβ1–42 in Tgr5F/F; Tgr5F/F 5×FAD; and CamKIIα,Tgr5F/F5×FAD mice were measured by using ΕLISA kit. (I and J) Representative Aβ immunostaining in the hippocampus and cortex of Tgr5F/F mice; Tgr5F/F5×FAD mice; and CamKIIα,Tgr5F/F5×FAD mice. The whole-brain Aβ immunostaining was presented in (I), and the statistical analysis of Aβ burdens in hippocampus and cortex were also resented. Scale bars, 2 mm and 50 μm, respectively. Error bars represent SEM, and statistical analyses were done using one-way ANOVA (Tukey’s post hoc test). *P < 0.05 and **P < 0.01.
Fig. 6.
Fig. 6.. TGR5 regulates APP processing through p-STAT3–APH1–γ-secretase signaling pathway.
(A) RNA-seq diagram from WT, 5×FAD and Tgr5−/−5×FAD mice hippocampal. (B and C) Total of 244 DEGs were found up-regulated and down-regulated in AD versus WT or Tgr5−/−5×FAD versus 5×FAD. (D and E) KEGG (D) and GO (E) analysis of these 244 DEGs. (F) Top changed DEGs in AD. (G) mRNA levels of γ-secretase complex in WT, Tgr5−/− 5×FAD, and Tgr5−/−5×FAD mice. (H) Sequences of Aph1b, Aph1c, and Aph1a proteins. (I) Protein levels of APP, APP-CTFs, and BACE1 in hippocampus and cortex from Tgr5F/F; Tgr5F/F5×FAD; CamKIIα,Tgr5F/F; and CamKIIα,Tgr5F/F5×FAD mice. (J) WT and Tgr5−/− neurons were treated with Int777 or DCA for 24 hours. The protein levels of p-STAT3, STAT3, and TGR5 were measured. (K) Primary neurons were treated with DCA for 24 hours followed by Stattic for 2 hours. The protein levels p-STAT3 and STAT3 were measured. (L) Cytoplasmic and nuclear proteins were separated in human embryonic kidney–293 T cells treated with for 24 hours, and the protein lysates were subjected for p-STAT3, STAT3, and TGR5. (M) ChIP-PCR for p-STAT3 binding to the Aph1 promoter. (N and O) Protein levels of p-STAT3, STAT3, APH1a, PS1, and Nicastrin in hippocampus (N) and cortex (O) of Tgr5F/F5×FAD and CamKIIα,Tgr5F/F5×FAD mice were measured. Error bars represent SEM, and statistical analyses were done using unpaired two-tailed Student’s t test or one-way ANOVA (Tukey’s post hoc test). *P < 0.05 and **P < 0.01.

References

    1. Jia W., Rajani C., Kaddurah-Daouk R., Li H., Expert insights: The potential role of the gut microbiome-bile acid-brain axis in the development and progression of Alzheimer's disease and hepatic encephalopathy. Med. Res. Rev. 40, 1496–1507 (2020). - PubMed
    1. Mahajan U. V., Varma V. R., Griswold M. E., Blackshear C. T., An Y., Oommen A. M., Varma S., Troncoso J. C., Pletnikova O., O'Brien R., Hohman T. J., Legido-Quigley C., Thambisetty M., Dysregulation of multiple metabolic networks related to brain transmethylation and polyamine pathways in Alzheimer disease: A targeted metabolomic and transcriptomic study. PLOS Med. 17, e1003012 (2020). - PMC - PubMed
    1. van Lengerich B., Zhan L., Xia D., Chan D., Joy D., Park J. I., Tatarakis D., Calvert M., Hummel S., Lianoglou S., Pizzo M. E., Prorok R., Thomsen E., Bartos L. M., Beumers P., Capell A., Davis S. S., de Weerd L., Dugas J. C., Duque J., Earr T., Gadkar K., Giese T., Gill A., Gnörich J., Ha C., Kannuswamy M., Kim D. J., Kunte S. T., Kunze L. H., Lac D., Lechtenberg K., Leung A. W., Liang C. C., Lopez I., McQuade P., Modi A., Torres V. O., Nguyen H. N., Pesämaa I., Propson N., Reich M., Robles-Colmenares Y., Schlepckow K., Slemann L., Solanoy H., Suh J. H., Thorne R. G., Vieira C., Wind-Mark K., Xiong K., Zuchero Y. J. Y., Diaz D., Dennis M. S., Huang F., Scearce-Levie K., Watts R. J., Haass C., Lewcock J. W., Di Paolo G., Brendel M., Sanchez P. E., Monroe K. M., A TREM2-activating antibody with a blood-brain barrier transport vehicle enhances microglial metabolism in Alzheimer's disease models. Nat. Neurosci. 26, 416–429 (2023). - PMC - PubMed
    1. Andersen J. V., Schousboe A., Verkhratsky A., Astrocyte energy and neurotransmitter metabolism in Alzheimer's disease: Integration of the glutamate/GABA-glutamine cycle. Prog. Neurobiol. 217, 102331 (2022). - PubMed
    1. Wang H., Tan Y. Z., Mu R. H., Tang S. S., Liu X., Xing S. Y., Long Y., Yuan D. H., Hong H., Takeda G protein-coupled receptor 5 modulates depression-like behaviors via hippocampal CA3 pyramidal neurons afferent to dorsolateral septum. Biol. Psychiatry 89, 1084–1095 (2021). - PubMed

Publication types

MeSH terms

Substances