. 2024 Jun 28;10(26):eadm8454.
doi: 10.1126/sciadv.adm8454. Epub 2024 Jun 28.

Netrin-1-engineered endothelial cell exosomes induce the formation of pre-regenerative niche to accelerate peripheral nerve repair

Affiliations

Netrin-1-engineered endothelial cell exosomes induce the formation of pre-regenerative niche to accelerate peripheral nerve repair

Jinsheng Huang et al. Sci Adv. .

Abstract

The formation of vascular niche is pivotal during the early stage of peripheral nerve regeneration. Nevertheless, the mechanisms of vascular niche in the regulation of peripheral nerve repair remain unclear. Netrin-1 (NTN1) was found up-regulated in nerve stump after peripheral nerve injury (PNI). Herein, we demonstrated that NTN1-high endothelial cells (NTN1+ECs) were the critical component of vascular niche, fostering angiogenesis, axon regeneration, and repair-related phenotypes. We also found that NTN1+EC-derived exosomes (NTN1 EC-EXO) were involved in the formation of vascular niche as a critical role. Multi-omics analysis further verified that NTN1 EC-EXO carried a low-level expression of let7a-5p and activated key pathways associated with niche formation including focal adhesion, axon guidance, phosphatidylinositol 3-kinase-AKT, and mammalian target of rapamycin signaling pathway. Together, our study suggested that the construction of a pre-regenerative niche induced by NTN1 EC-EXO could establish a beneficial microenvironment for nerve repair and facilitate functional recovery after PNI.


Figures
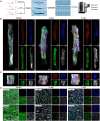
Fig. 1.
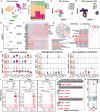
Fig. 1.. NTN1-related vascular niche formed at the injury site following PNI.
(A) Schematic representation of experimental design of tissue clearing procedure, immunostaining, and whole nerve imaging by light-sheet microscopy. (B) Light-sheet microscope fluorescent images of CD31, NTN1, MBP, and TuJ1 immunostaining of cleared whole-sciatic nerve from sham, 3- and 7-dpc groups. Scale bar, 500 μm. (C) Selected areas within the injury sites magnified to further show the fluorescent signal of CD31, NTN1, MBP, and TuJ1 staining. Scale bar, 200 μm. (D) Coimmunostaining of CD31, NTN1, MBP, and TuJ1 in cross and longitudinal sections of nerve injury sites. Scale bar, 20 μm.
Fig. 2.
Fig. 2.. scRNA-seq revealed the remarkable role of NTN1+ECs in the formation of vascular niche.
(A) UMAP embedding for total cells sampled, with annotated clustering. (B) Proportions of the indicated cell types in sham, 3- and 7-dpc groups (n = 3). (C) UMAP display of EC clusters. (D) Relative density of NTN1 in ECs. (E) UMAP figures showing proportions of NTN1+ECs in different groups. (F) Heatmap of DEGs between NTN1-ECs and NTN1+ECs. (G) KEGG enrichment and GO enrichment analyses between NTN1-ECs and NTN1+ECs. (H) Violin plots showing exosomal markers, angiogenesis markers, and axon guidance molecules and their distribution in different cell subgroups. (I) Network and heatmap figures showing the number of cell interactions in VEGF signaling pathway between different groups. The sender cells (ligand sources) are shown on the y axis and receiving cells (receptor expression) on the x axis. The probabilities for cells to communicate with each other are indicated. (J) The bar graphs showing the contribution of VEGF L-R pairs for each group. (K) Violin plots showing the expression of VEGF signaling–associated genes (Vegfa, Vegfc, Kdr, and Flt4) between NTN1-ECs and NTN1+ECs.
Fig. 3.
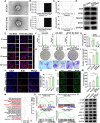
Fig. 3.. NTN1 boosted and maintained angiogenesis-related phenotypes in ECs.
(A) Schematic image showed the up-regulation of NTN1 via LV transfection. (B and C) qPCR and Western blot validated NTN1 expression in LV-NC and LV-NTN1 groups. (D) Cell growth curve was detected by CCK-8 assay in different groups. (E) Representative EdU staining images in different groups. Scale bar, 100 μm. (F) Representative images of the colony formation in different groups. Scale bar, 500 μm. (G) Statistical evaluation of percentage of EdU-positive ECs. (H) Statistical results of the colony formation in each group. (I) Representative images of the angiogenesis experiment in LV-NC and LV-NTN1 groups. Scale bar, 100 μm. (J) Cell cycle detected by flow cytometry assay. (K) Number of junctions in different groups. (L) Statistical results of the cell cycle. (M) Scratch wound migration assay in vitro. Representative images of migrating ECs in different groups for 24 and 48 hours. Scale bar, 200 μm. (N) Representative images of vertical migration of ECs in different groups for 24 and 48 hours. Scale bar, 100 μm. (O) Statistical results of wound healing rate. (P) The number of migrated ECs was counted and analyzed. (Q) The protein level of VEGFA was detected using Western blot. (R) Different genes were detected in LV-NC and LV-NTN1 groups on a coexpression Venn diagram. (S) The heatmap displayed the expression ratios of different genes between LV-NC and LV-NTN1 group. (T and U) Substantially enriched GO and KEGG pathways related to the DEGs. (V) Western blot detected the related signaling pathways activated by NTN1. ns, not significant, *P < 0.05, **P < 0.01, ***P < 0.001, ****P < 0.0001.
Fig. 4.
Fig. 4.. Pro-regenerative phenotypes and transcriptome profiles induced by EXOs derived from NTN1+ECs.
(A) Representative TEM images of EC-EXO and NTN1 EC-EXO. Scale bar, 100 nm. (B) Particle size distribution of EC-EXO and NTN1 EC-EXO measured by NTA, inset showing representative EXO images captured from the NTA video frames. (C) Zeta potential measurements of EC-EXO and NTN1 EC-EXO. (D) Western blot analysis of exosomal marker proteins (CD9, CD81, and TSG101) and NTN1 in EC-EXO and NTN1 EC-EXO. (E) PC12 cells were incubated with DiI-labeled EC-EXO and NTN1 EC-EXO, and representative fluorescence images showed the delivery of DiI-labeled EC-EXO and NTN1 EC-EXO into PC12 cells. Scale bar, 20 μm. (F) The cell cycle of PC12 cells in control group (treated with PBS), EC-EXO group (treated with EC-EXO), and NTN1 EC-EXO group (treated with NTN1 EC-EXO) was detected by flow cytometry assay. (G) Statistical results of the cell cycle. (H) Representative images of the colony formation in different groups. Scale bar, 500 μm. (I) Statistical results of the colony formation in each group. (J) Representative EdU staining images in different groups. Scale bar, 100 μm. (K) Statistical evaluation of percentage of EdU-positive cells. (L) Representative staining images of PC12 cells cocultured with EC-EXO and NTN1 EC-EXO, and PC12 cells were immunofluorescent stained for TuJ1. Scale bar, 50 μm. (M) Axonal lengths were quantified and plotted for each treatment. (N) Substantially enriched KEGG pathways related to the DEGs obtained from the comparison of EC-EXO group and NTN1 EC-EXO group. (O) GSEA of pro-regeneration associated pathways in different groups. NES, normalized enrichment score. (P) Western blot detected the related signaling pathways activated by NTN1 EC-EXO. ns, not significant, *P < 0.05, **P < 0.01, ***P < 0.001, ****P < 0.0001.
Fig. 5.
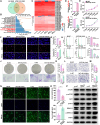
Fig. 5.. NTN1 EC-EXO boosted pro-regenerative phenotypes of PC12 cells via the down-regulation of let7a-5p.
(A) Different miRNAs were detected in EC-EXO and NTN1 EC-EXO groups on a coexpression Venn diagram. (B) KEGG pathways substantially enriched in the gene targets of miRNAs changed between PC12 cells treated with EC-EXO and NTN1 EC-EXO. (C) The heatmap displayed the expression of different miRNAs between EC-EXO and NTN1 EC-EXO groups. (D) Quantitative PCR analysis of let7a-5p expression levels in PC12 cells transfected with mimic, mimic negative control (Mi-NC), inhibitor and inhibitor negative control (In-NC). (E) Cell growth curve was detected by CCK-8 assay in different groups. (F) Representative EdU staining images in different groups. Scale bar, 50 μm. (G) Statistical evaluation of percentage of EdU-positive PC12 cells. (H) Cell cycle detected by flow cytometry assay. (I) Statistical results of the cell cycle. (J) Representative images of the colony formation in different groups. Scale bar, 500 μm. (K) Statistical results of the colony formation in each group. (L) Representative images of vertical migration of PC12 cells in different groups. Scale bar, 100 μm. (M) The number of migrated PC12 cells was counted and analyzed. (N) Representative immune-fluorescence images of PC12 cells stained with TuJ1 in different groups. Scale bar, 50 μm. (O) Axonal lengths were quantified and plotted for each treatment. (P) Western blot detected the related signaling pathways regulated by let7a-5p. ns, not significant, *P < 0.05, **P < 0.01, ***P < 0.001, ****P < 0.0001.
Fig. 6.
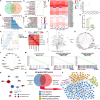
Fig. 6.. Multi-omics of EXOs identified pro-regenerative niche–associated molecular mechanism and signaling pathways induced by NTN1 EC-EXO.
(A to G) Small RNA-seq revealed miRNA cargos from EC-EXO and NTN1 EC-EXO. (A) Different miRNAs were shown on a coexpression Venn diagram. (B) GO term analyses of gene targets of substantially changed miRNAs in EC-EXO and NTN1 EC-EXO regarding their involvement in biological processes. (C) Reactome analysis of gene targets of differentially expressed miRNAs. (D) Substantially enriched KEGG pathways related to the gene targets of differentially expressed miRNAs. (E) The heatmap displayed the expression ratios of different miRNAs between EC-EXO and NTN1 EC-EXO. (F) The line graph depicted the expression of let7a-5p from small RNA-seq data. (G) The validation about the relative expression of let7a-5p in EC-EXO and NTN1 EC-EXO via qPCR. (H to N) Proteomics of EXOs to quantify protein cargos in EC-EXO and NTN1 EC-EXO. (H) Overall visualization of group classifications using a PCA score plot. (I) Pearson correlation coefficient analysis was used to detect linear correlations between two groups of data. (J) Volcano plots showed the up-regulated proteins (red), down-regulated proteins (green), and nonchanging proteins (gray). (K and L) GO enrichment and KEGG enrichment analyses of differentially expressed proteins in NTN1 EC-EXO compared to EC-EXO. (M) GSEA of pro-regeneration–associated signaling pathways in different groups. (N) Protein-protein interaction (PPI) network of differentially expressed molecules. Red indicates up-regulated molecules, and green indicates down-regulated molecules. (O and P) Pathway-level integration on EXOs multi-omics data. (O) There were 786 overlapping KEGG, Reactome, and GO pathways that were substantially enriched in the proteome and gene targets of miRNAs altered in EC-EXO and NTN1 EC-EXO. (P) PPI networks revealed four distinct annotations shared by NTN1 EC-EXO cargos, including focal adhesion, axon guidance, PI3K-AKT signaling pathway, and mTOR signaling pathway.
Fig. 7.
Fig. 7.. The distribution of NTN1 EC-EXO in nerves and histological changes of injured nerves.
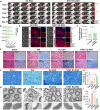
(A) Representative pictures of living imaging in EC-EXO group and NTN1 EC-EXO group at 1, 3, 7, 14, and 21 days following surgery. (B) Radiant efficiency in different groups at different days. (C) Ex vivo fluorescence images of sciatic nerves and frozen section of nerve from rats euthanized at 21 days after surgery. (D) Luminescence of sciatic nerves at 21 days was quantified. (E) Representative images of H&E and Masson staining sciatic nerve longitudinal and cross sections in sham, PNI, EC-EXO, and NTN1 EC-EXO groups at 21 days following surgery. Scale bar, 20 μm. (F) Representative images of TB staining sciatic nerve in each group. Scale bar, 20 μm. (G) Representative TEM images of sciatic nerve in each group. Scale bar, 5 μm and 500 nm. (H) Statistical analysis of the thickness of myelin sheath. (I) Statistical analysis of G-ratio; ns, not significant, *P < 0.05, **P < 0.01, ***P < 0.001, ****P < 0.0001.
Fig. 8.
Fig. 8.. NTN1 EC-EXO boosted angiogenesis and nerve repair following PNI.
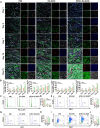
(A) Representative images of CD31/NTN1/TuJ1/MBP quadruple immunofluorescence staining of sciatic nerve at 1, 3, 7, 14, and 21 days following the operation. Scale bar, 20 μm. (B) The statistical results of percentages of CD31-, NTN1-, TuJ1-, and MBP-positive staining area in PNI, EC-EXO, and NTN1 EC-EXO groups. (C) Cell cycle detected by flow cytometry assay. (D) Statistical results of the cell cycle. (E and F) The percentages of CD31+ cells in different groups were detected using fluorescence-activated cell sorting (FACS). (G and H) The percentages of Ki67+ cells were detected using FACS. (I and J) The percentages of CD31+Ki67+ cells were detected using FACS. ns, not significant, *P < 0.05, **P < 0.01, ***P < 0.001, ****P < 0.0001.
Fig. 9.
Fig. 9.. Innervation investigation of PNI rats with NTN1 EC-EXO treatment.
(A) Schematic illustration showed the way to access footprint images of the rats. (B) Representative ipsilateral and contralateral footprint of each group at 21 days after operation. (C) SFI in each group. (D) Schematic diagram of electrodes placement of electrophysiological analysis on rat. (E) Evoked CMAP in each group at 21 days after operation. (F) Amplitude of CMAP in each group. (G) Schematic illustration showed the method to measure mechanical algesia of rats using von Frey filaments. (H) Mechanical algesia thresholds of the paws of rats at 3 days before operation, 7, 14, and 21 days following operation. (I) Representative images of harvested gastrocnemius muscles in sham, PNI, EC-EXO, and NTN1 EC-EXO groups. (J) Statistical analysis of weight ratio of gastrocnemius muscle in different groups. (K) Representative images of HE and Masson staining of gastrocnemius muscle in each group. Scale bar, 20 μm. (L) Statistical analysis of muscle fiber mean diameter. ns, not significant; **P < 0.01, ***P < 0.001, ****P < 0.0001

References

    1. Cattin A. L., Burden J. J., Van Emmenis L., Mackenzie F. E., Hoving J. J., Calavia N. G., Guo Y., McLaughlin M., Rosenberg L. H., Quereda V., Jamecna D., Napoli I., Parrinello S., Enver T., Ruhrberg C., Lloyd A. C., Macrophage-induced blood vessels guide schwann cell-mediated regeneration of peripheral nerves. Cell 162, 1127–1139 (2015). - PMC - PubMed
    1. Miyamoto N., Pham L. D., Seo J. H., Kim K. W., Lo E. H., Arai K., Crosstalk between cerebral endothelium and oligodendrocyte. Cell. Mol. Life Sci. 71, 1055–1066 (2014). - PMC - PubMed
    1. Goldman S. A., Chen Z., Perivascular instruction of cell genesis and fate in the adult brain. Nat. Neurosci. 14, 1382–1389 (2011). - PMC - PubMed
    1. Liu Y., Cao X., Characteristics and significance of the pre-metastatic niche. Cancer Cell 30, 668–681 (2016). - PubMed
    1. Maruyama K., Takemura N., Martino M. M., Kondo T., Akira S., Netrins as prophylactic targets in skeletal diseases: A double-edged sword? Pharmacol. Res. 122, 46–52 (2017). - PubMed

Publication types