. 2024 Jun 28;10(26):eadf3411.
doi: 10.1126/sciadv.adf3411. Epub 2024 Jun 28.

A genome scale transcriptional regulatory model of the human placenta

Affiliations

A genome scale transcriptional regulatory model of the human placenta

Alison Paquette et al. Sci Adv. .

Abstract

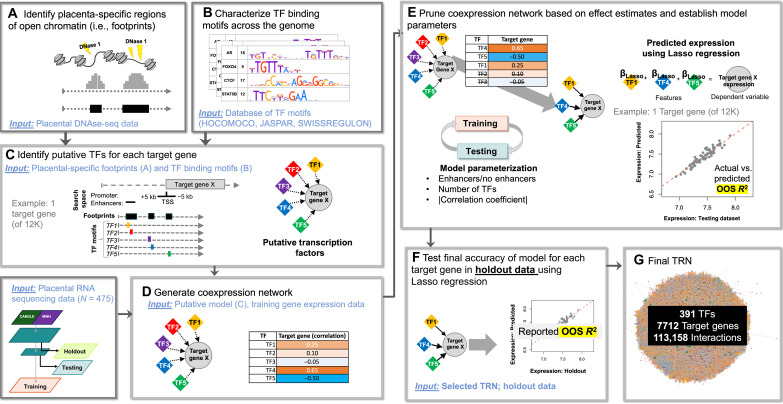
Gene regulation is essential to placental function and fetal development. We built a genome-scale transcriptional regulatory network (TRN) of the human placenta using digital genomic footprinting and transcriptomic data. We integrated 475 transcriptomes and 12 DNase hypersensitivity datasets from placental samples to globally and quantitatively map transcription factor (TF)-target gene interactions. In an independent dataset, the TRN model predicted target gene expression with an out-of-sample R2 greater than 0.25 for 73% of target genes. We performed siRNA knockdowns of four TFs and achieved concordance between the predicted gene targets in our TRN and differences in expression of knockdowns with an accuracy of >0.7 for three of the four TFs. Our final model contained 113,158 interactions across 391 TFs and 7712 target genes and is publicly available. We identified 29 TFs which were significantly enriched as regulators for genes previously associated with preterm birth, and eight of these TFs were decreased in preterm placentas.


Figures

Fig. 1.
Fig. 1.. Overview of data and strategy used to construct TRN.
(A) First, regions of open chromatin, i.e., footprints are identified from placental DNase-seq data. (B) Concurrently, TF binding motifs were curated from publicly available databases. (C) These data were overlayed (C) to identify putative regulators (TFs) of each target gene. (D) We then generated a coexpression network within these putative TF–target gene relationships using RNA-seq data. (E) We evaluated different parameters to prune the model in the training data. Lasso regression was used with selected TFs for each target gene to predict expression, and then the actual versus predicted expression was used to evaluate the model. (F) The final model was tested in our holdout data to generate final accuracy for each gene. (G) Only target genes we could predict with high confidence were included in our final model. TSS, transcriptional start site.
Fig. 2.
Fig. 2.. Accuracy of TRN model to predict target gene expression in holdout dataset.
(A) Distribution of Pearson correlation coefficients in training + testing dataset (N = 382 samples, pink) and holdout dataset (N = 93, blue). Red lines indicate 0.25, which was the cutoff in the training dataset. (B) Distribution of out of sample accuracy (OOS R2) for each of the 10,984 genes calculated in our holdout dataset. Light blue box indicates genes with OOS R2 < 0.25, which were genes not included in our final model. Dark blue genes were high confidence OOS R2.
Fig. 3.
Fig. 3.. Summary of genome scale TRN.
(A) Network diagram and (B) network connectivity of 391 TFs based on their target genes. Orange line indicates hub TFs with >500 genes. Top 15 TFs based on degree centrality are shown in green
Fig. 4.
Fig. 4.. Experimental validation for assessment of final model accuracy.
Results of Experimental validation for (A) GRHL2, (B) CREB3L2, (C) ESRRG, and (D) GCM1. X axis represents the log fold change of knockout versus control, and the Y axis represents correlation between TF and target gene. Model accuracy was calculated as the number of positively regulated genes with a negative log fold change (i.e., true positives, shown in red) added to the number of negatively regulated target genes with a positive log fold change (i.e., true negatives, shown in blue) divided by the total number of target genes for each sample. Genes that were not concordant are shaded in gray. The size and shading of each target gene represent the relative rank (1 to 15) of the TF as a regulator in our TRN.
Fig. 5.
Fig. 5.. Plot depicting the 5361 sex-specific interactions in the placental TRN, divided into four distinct interaction categories.
The x axis represents TF–target gene estimate values from linear regression analysis in the whole dataset. The y axis represents the difference in estimates between male and female samples.
Fig. 6.
Fig. 6.. Heatmap of all TFs enriched for one or more placental cell type signature as defined by Campbell et al. (30), based on overrepresentation-based analysis (FDR <0.05; Fisher’s exact test).
The color represents the proportion of total TF target genes that were cell type signatures, and we report P values adjusted for FDR. NK cells, natural killer cells.
Fig. 7.
Fig. 7.. TRN subnetwork depicting enriched TFs (P < 0.1; Fisher’s exact test) and their corresponding genes that were previously associated with preterm birth (PT).
Diamonds are TFs. Color of gene indicates directionality of log fold change in association with preterm birth. Placental-specific TFs, defined by the Human Protein Atlas (31), are outlined in green. Color of edge indicates correlation between TF and target gene, and the number represents correlation coefficient. Transcriptional regulation between enriched TFs is highlighted by red dotted edges.

References

    1. Burton G. J., Jauniaux E., What is the placenta? Am. J. Obstet. Gynecol. 213, S6–S8 (2015). - PubMed
    1. S. Mesiano, CHAPTER 11 - The endocrinology of human pregnancy and fetoplacental neuroendocrine development A2 - Strauss, Jerome F. in Yen and Jaffe’s Reproductive Endocrinology (Sixth Edition), R. L. Barbieri, Ed. (W.B. Saunders, 2009; https://sciencedirect.com/science/article/pii/B9781416049074000115), pp. 249–281.
    1. Myatt L., Placental adaptive responses and fetal programming. J. Physiol. 572, 25–30 (2006). - PMC - PubMed
    1. Y. Wang, S. Zhao, Vascular Biology of the Placenta (Morgan & Claypool Life Sciences, 2010). - PubMed
    1. Saben J., Zhong Y., McKelvey S., Dajani N. K., Andres A., Badger T. M., Gomez-Acevedo H., Shankar K., A comprehensive analysis of the human placenta transcriptome. Placenta 35, 125–131 (2014). - PMC - PubMed

Publication types

Substances