Review
. 2024 Jun;75(1):483-508.
doi: 10.1146/annurev-physchem-083122-105226.

3D Nanocrystallography and the Imperfect Molecular Lattice

Affiliations
Review

3D Nanocrystallography and the Imperfect Molecular Lattice

Niko Vlahakis et al. Annu Rev Phys Chem. 2024 Jun.

Abstract

Crystallographic analysis relies on the scattering of quanta from arrays of atoms that populate a repeating lattice. While large crystals built of lattices that appear ideal are sought after by crystallographers, imperfections are the norm for molecular crystals. Additionally, advanced X-ray and electron diffraction techniques, used for crystallography, have opened the possibility of interrogating micro- and nanoscale crystals, with edges only millions or even thousands of molecules long. These crystals exist in a size regime that approximates the lower bounds for traditional models of crystal nonuniformity and imperfection. Accordingly, data generated by diffraction from both X-rays and electrons show increased complexity and are more challenging to conventionally model. New approaches in serial crystallography and spatially resolved electron diffraction mapping are changing this paradigm by better accounting for variability within and between crystals. The intersection of these methods presents an opportunity for a more comprehensive understanding of the structure and properties of nanocrystalline materials.

Keywords: 3DED; MicroED; SFX; crystallography; nanocrystal.


Figures

Figure 1
Figure 1
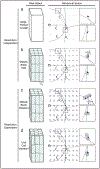
Diffraction from 3D molecular nanocrystals. The illustrations depict various strategies used to obtain diffraction from molecular nanocrystals using X-ray and electron radiation. Electron diffraction from (a) single intact crystals or (b) milled crystals yields (c) continuous-rotation movies. (d) Spatially resolved diffraction mapping and (e) serial electron diffraction, as well as (f,g) serial X-ray diffraction, yield (h) diffraction pattern series, subsets of which are combined to yield datasets used for structure determination. Electron beams are shown in lime green, and X-ray beams and pulses are shown in purple.
Figure 2
Figure 2
Slices of a reciprocal lattice point (RLP) for rotation versus still images. (a) Depiction of a reciprocal lattice swept by two Ewald sphere arcs across a narrow angular range. The inset shows planes of a given sphere intersecting a reflection, or RLP. (b) Nine images taken in sequence as a reflection moves through the Ewald sphere during rotation. For a still image, only one slice of the RLP is recorded. The measured intensity of a given reflection is plotted against the rotation angle for a series of images, matching a rocking curve. A still image is noted, representing a slice of the full reflection intensity.
Figure 3
Figure 3
Intersection of reciprocal lattices with the Ewald sphere. A reciprocal lattice point (RLP) is shown situated at vector q from the origin of reciprocal space (magenta lattice). Here, S0 is the beam vector (magnitude 1/λ) and situates the center of the Ewald sphere. To place the RLP on the surface of the Ewald sphere, the lattice is rotated through the angle ΔΨ (blue lattice) to form qE and allow construction of the diffracted ray, S1. The rotation shown is greatly exaggerated.
Figure 4
Figure 4
Gaussian models of the reciprocal lattice point (RLP) and Ewald sphere. (a) The RLP modeled as a Gaussian based on its mosaic domain size. (b) The monochromatic Ewald sphere (red) is overlaid with a Gaussian bandpass, expressed as the probability of a photon with a given wavelength being observed given a typical X-ray free electron laser bandpass. (c) The product of panel a and b, showing the combined probability of the RLP and the bandpass.
Figure 5
Figure 5
Mosaic model according to Nave (41). (a) Illustration of crystal imperfections in real space and their impact on the reciprocal lattice, shown intersected by Ewald spheres from an X-ray (purple) and electron (green) diffraction experiment. (b–d) Versions of this model with added complexity, modeling (b) mosaic block size, (c) mosaic block rotation, and (d) unit cell variation. Starting from an ideal case, imperfections in the crystal are taken into consideration, which affect the size and shape of the reciprocal lattice point in resolution-dependent and - independent ways.
Figure 6
Figure 6
Modeling diffraction from complex nanocrystal lattices. The best-fit simulated diffraction image (a) to a given real image (b) is still a poor visual match despite the exhaustive grid-search optimization of 18 parameters: isotropic rotational mosaic spread; mosaic domain size along the a, b, and c axes; beam divergence; spectral dispersion; wavelength; detector distance; beam center (2); beam direction (2); unit cell parameters (3); and crystal orientation (3). In contrast, the sum of the top three simulated images (c) is a much better match. The three orientations are shown as red dots in panel d. The blue netting is a 6-sigma contour of a 3D map composed by plotting in 3D space the correlation coefficient between the real and simulated pixels generated over a 1 × 1 × 1° grid of crystal misorientation angles. This shape is representative of the texture or 3D histogram of mosaic block orientations within the illuminated volume of the crystal for this particular X-ray free electron laser (XFEL) diffraction pattern. Real image obtained from Lyubimov et al. (40) where simulated XFEL diffraction images were generated with nanoBragg.
Figure 7
Figure 7
Example of a microcrystal electron diffraction workflow. Crystal polymorphs considered suboptimal or unsuitable for X-ray crystallography (a) might yield well-ordered fragments that provide high-resolution diffraction in the electron microscope (b,c). Data are collected by continuously rotating the crystal within the beam during the collection of diffraction exposures (typically between ±60°). (d) In data processing, Miller indices are assigned to reflections and their intensities are integrated. (e) Data from multiple crystals are merged to increase the completeness of the sampling of the reciprocal lattice. (f) Phases for each reflection are retrieved using molecular replacement with a similar predetermined crystal structure, fragment-based phasing, or direct methods, and a 3D atomic structure is determined and refined.
Figure 8
Figure 8
A nanobeam 4D scanning transmission electron microscopy scan of cobalt(II) tetraphenylporphyrin. (a) The simultaneously obtained real-space image of the crystal morphology, acquired using the annual dark field scanning transmission electron microscope detector. Regions of real space with arbitrary location and shape can be summed during postprocessing to interrogate regions of the sample. (b–f) Each colored region of the crystal produces its own consistent pattern of diffraction.
Figure 9
Figure 9
Diffraction zones of macromolecular nanocrystals probed by electron diffraction (ED) and serial femtosecond crystallography. The (HK0) zone is shown for cyclophilin and granulin datasets. For each, the resolution achieved by ED is indicated with a blue ring, while the resolution achieved by X-ray free electron laser (XFEL) is indicated by a red ring. (a) One crystal of cyclophilin A yields an incomplete dataset by microcrystal ED and a structure at 2.5-Å resolution [Protein Data Bank (PDB) ID 6U5G]. (b) Serial XFEL crystallography using over 18,000 crystals of the same type affords a complete dataset at an improved resolution of 1.56 Å (PDB ID 6U5C). (c) Serial ED (serialED) data collection affords complete sampling of reciprocal space for granulin nanocrystals (PDB ID 6S2O) and (d) resolution exceeding that of a deposited structure of the same protein determined using an XFEL (PDB ID 5G0Z).

References

    1. Aroyo MI, ed. 2016. International Tables for Crystallography: Space-Group Symmetry, Vol. Chester A, UK: Int. Union Crystallogr. 2nd ed.
    1. Karamertzanis PG, Pantelides CC. 2007. Ab initio crystal structure prediction. II. Flexible molecules. Mol. Phys 105(2–3):273–91
    1. Lovelace JJ, Borgstahl GEO. 2020. Characterizing pathological imperfections in macromolecular crystals: lattice disorders and modulations. Crystallogr. Rev 26(1):3–50 - PMC - PubMed
    1. Bragg WL. 1970. Early days. Acta Crystallogr. A 26(2):171–72
    1. Holton JM, Frankel KA. 2010. The minimum crystal size needed for a complete diffraction data set. Acta Crystallogr. D Biol. Crystallogr 66(Part 4):393–408 - PMC - PubMed

LinkOut - more resources