. 2024 Jul:105:105219.
doi: 10.1016/j.ebiom.2024.105219. Epub 2024 Jun 27.

Biomarker screen for efficacy of oncolytic virotherapy in patient-derived pancreatic cancer cultures

Affiliations

Biomarker screen for efficacy of oncolytic virotherapy in patient-derived pancreatic cancer cultures

Theresa E Schäfer et al. EBioMedicine. 2024 Jul.

Abstract

Background: Pancreatic ductal adenocarcinoma (PDAC) is a tumour entity with unmet medical need. To assess the therapeutic potential of oncolytic virotherapy (OVT) against PDAC, different oncolytic viruses (OVs) are currently investigated in clinical trials. However, systematic comparisons of these different OVs in terms of efficacy against PDAC and biomarkers predicting therapeutic response are lacking.

Methods: We screened fourteen patient-derived PDAC cultures which reflect the intra- and intertumoural heterogeneity of PDAC for their sensitivity to five clinically relevant OVs, namely serotype 5 adenovirus Ad5-hTERT, herpes virus T-VEC, measles vaccine strain MV-NIS, reovirus jin-3, and protoparvovirus H-1PV. Live cell analysis, quantification of viral genome/gene expression, cell viability as well as cytotoxicity assays and titration of viral progeny were conducted. Transcriptome profiling was employed to identify potential predictive biomarkers for response to OV treatment.

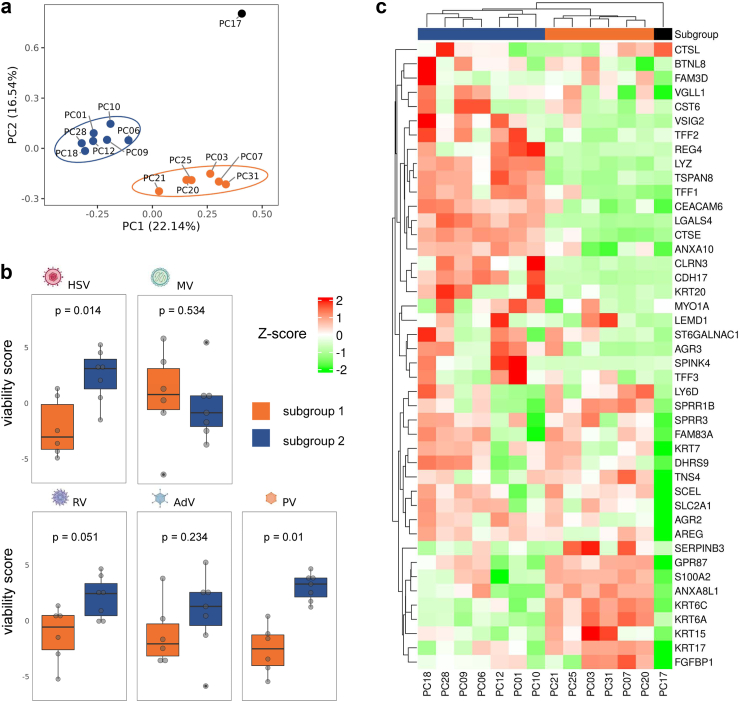
Findings: Patient-derived PDAC cultures showed individual response patterns to OV treatment. Twelve of fourteen cultures were responsive to at least one OV, with no single OV proving superior or inferior across all cultures. Known host factors for distinct viruses were retrieved as potential biomarkers. Compared to the classical molecular subtype, the quasi-mesenchymal or basal-like subtype of PDAC was found to be more sensitive to H-1PV, jin-3, and T-VEC. Generally, expression of viral entry receptors did not correlate with sensitivity to OV treatment, with one exception: Expression of Galectin-1 (LGALS1), a factor involved in H-1PV entry, positively correlated with H-1PV induced cell killing. Rather, cellular pathways controlling immunological, metabolic and proliferative signaling appeared to determine outcome. For instance, high baseline expression of interferon-stimulated genes (ISGs) correlated with relative resistance to oncolytic measles virus, whereas low cyclic GMP-AMP synthase (cGAS) expression was associated with exceptional response. Combination treatment of MV-NIS with a cGAS inhibitor improved tumour cell killing in several PDAC cultures and cells overexpressing cGAS were found to be less sensitive to MV oncolysis.

Interpretation: Considering the heterogeneity of PDAC and the complexity of biological therapies such as OVs, no single biomarker can explain the spectrum of response patterns. For selection of a particular OV, PDAC molecular subtype, ISG expression as well as activation of distinct signaling and metabolic pathways should be considered. Combination therapies can overcome resistance in specific constellations. Overall, oncolytic virotherapy is a viable treatment option for PDAC, which warrants further development. This study highlights the need for personalised treatment in OVT. By providing all primary data, this study provides a rich source and guidance for ongoing developments.

Funding: German National Science Foundation (Deutsche Forschungsgemeinschaft, DFG), German Cancer Aid (Deutsche Krebshilfe), German National Academic Scholarship Foundation (Studienstiftung des deutschen Volkes), Survival with Pancreatic Cancer Foundation.

Keywords: Cancer immunotherapy; Oncolytic virotherapy; Pancreatic cancer; Viral vectors.


Conflict of interest statement

Declaration of interests A.M. is inventor on several PV-related patents and patent applications. G.U. acts as CMO, CSO, and COO of CanVirex, a company developing oncolytic viruses for cancer therapy. C.E.E. is listed as inventor on patent applications filed by her institution related to the development of RNA viruses for cancer immunotherapy. S.H. reports an advisory role and honoraria from Amgen. L.J.A.C.H. received a grant from Flanders Innovation & Entrepreneurship (HBC18-2002) for the development of a PDXO drug screening platform.

Figures

Fig. 1
Fig. 1
Screening for sensitivity of PDAC to oncolytic virotherapy a. Characteristics of oncolytic viruses employed in the screen. b. Patient-derived PDAC cultures used in the screen including patient demographics and histology. N/A: Information not available. c. Schematic outline of the screening set-up. Assays and time points are depicted for every oncolytic virus, assays were performed with all 14 cultures listed in (b).
Fig. 2
Fig. 2
PDAC cultures exhibit differing responses to OV treatment a. Phase microscopy. Exemplary images for four PDAC cultures (PC01, PC03, PC09, and PC31) are shown. Cells were seeded in 12-well plates and inoculated with HSV (MOI 3), MV (MOI 3), RV (MOI 10), AdV (MOI 100), or PV (MOI 10). Images were acquired 72 h post virus inoculation (p.i.) scale bar: 100 μm. b. Crystal violet staining. Cells from all PDAC cultures were seeded in 96-well plates in parallel and inoculated with HSV (MOI 0.3 and 3), MV (MOI 0.3 and 3), RV (MOI 1 and 10), AdV (MOI 10 and 100), or PV (MOI 1 and 10), in technical duplicates. Crystal violet staining was performed seven days p.i. All culture-virus combinations are shown with two MOIs per virus in technical duplicates. c. Heatmap of the viability score based on the XTT assay for each culture per virus. After seeding in 12- and 96-well plates, PDAC cultures were inoculated with OVs as in (b) and cell viability was determined by XTT assay 72 h and 96 h p.i. (one sample per condition). Viability score was calculated as detailed in Methods. PDAC cultures with a relatively high viability score (red) are relatively resistant to a specific OV, while cultures with a low viability score (green) show relative sensitivity.
Fig. 3
Fig. 3
Molecular subtype of PDAC determines sensitivity to PV, RV, and HSV a. Biplot depicting the first two principal components of the PDAC normalised gene expression matrix. The colors and ellipses represent the subgroups defined by k-means clustering. b. Viability scores per molecular subgroup for each virus, as depicted by boxplots with individual observations. p = 0.014 for HSV, p = 0.534 for MV, p = 0.051 for RV, p = 0.234 for AdV, p = 0.01 for PV (two-sided Wilcoxon rank sum test). c. Heatmap depicting expression of PDAC subtype-defining genes as described by Moffitt et al., annotated with respective molecular subgroups. See Fig. S6b and c for signatures described in and .
Fig. 4
Fig. 4
Biomarker screen retrieves known host factors for individual oncolytic viruses a. Interferon-stimulated genes (ISGs) as restriction factors for MV. Spearman's rank correlation between gene expression of the previously published signature of 22 ISGs affecting MV oncolysis and the viability scores for each OV. b. Host factors for OVs. Spearman's rank correlation of gene expression of selected genes in n = 14 patient-derived cultures with normalised cell viability upon infection with the respective OV.
Fig. 5
Fig. 5
Gene set enrichment analysis a. Circular heatmap depicting normalised enrichment scores (NES) for HALLMARK pathways and corresponding process categories (as described in 37) based on viability scores for each OV. OVs hierarchically clustered. A higher NES score indicates many genes in the respective HALLMARK gene set are positively correlated with the viability score for that OV. b. Plots depicting running ES and rank for genes in depicted HALLMARK gene set for each OV. See Supplementary Data 2 for respective leading edge genes.
Fig. 6
Fig. 6
MV plus cGAS inhibition combination therapy a. Relative cGAS expression in n = 14 patient-derived PDAC cultures. Bar graph depicting normalised gene expression for cGAS in all PDAC cultures as determined in RNA microarray. Cultures used in b are depicted in dark grey, PC31 (exceptional responder to MV) is highlighted in green. b. Live cell analysis after MV and cGAS inhibitor treatment. PDAC cultures PC01, PC03, and PC25 were seeded in 96-well plates in technical duplicates. After 24 h, cultures were either subjected to mock infection or treated with MV (PC01 and PC03 MOI 0.3; PC25: MOI 3) and/or the cGAS inhibitor G140 (10 μm). Live cell analysis was performed using the IncuCyte instrument and normalised cell area confluency was automatically calculated based on time point of infection. Time course over 100 h p.i. is shown. Mean values of duplicates and standard deviation are plotted. c. PC31-cGAS and PC31-RFP were seeded in 96-well cell culture plates and infected with MV-GFP (MOI 0.1) and monitored in the IncuCyte instrument over three days (scale bars 400 μm). d. PC31-cGAS and PC31-RFP were seeded in 96-well cell culture plates in duplicates and infected with MV-GFP (MOI 0.3), viability was assessed 72 h post infection. Viability of PC31-RFP was defined as 100%. For PC31-cGAS, mean value and standard deviation from n = 3 independent experiments are shown; p = 0.2254 (unpaired t-test). e. PC31-cGAS and PC31-RFP were seeded in 96-well cell culture plates and infected with MV-GFP (MOIs 0.03, 0.1, 0.3, and 3) or subjected to mock infection in duplicates. Seven days post infection, viable cells were stained using crystal violet. f. PC31-cGAS and PC31-RFP were seeded in 96-well cell culture plates and infected with MV-GFP (MOI 0.3). 72 h post infection, supernatant was harvested and viral progeny was quantified by endpoint dilution assay on Vero cells in octuplicates. Mean and standard deviation from n = 2 independent experiments are shown; p = 0.0447 (unpaired t-test).

References

    1. Mizrahi J.D., Surana R., Valle J.W., Shroff R.T. Pancreatic cancer. Lancet. 2020;395(10242):2008–2020. - PubMed
    1. Marchini A., Daeffler L., Pozdeev V.I., Angelova A., Rommelaere J. Immune conversion of tumor microenvironment by oncolytic viruses: the protoparvovirus H-1PV case study. Front Immunol. 2019;10:1848. - PMC - PubMed
    1. Macedo N., Miller D.M., Haq R., Kaufman H.L. Clinical landscape of oncolytic virus research in 2020. J Immunother Cancer. 2020;8(2) - PMC - PubMed
    1. Marchini A., Ilkow C.S., Melcher A. Oncolytic virus immunotherapy. Cancers (Basel) 2021;13(15) - PMC - PubMed
    1. Lanson N.A., JR., Friedlander P.L., Schwarzenberger P., Kolls J.K., Wang G. Replication of an adenoviral vector controlled by the human telomerase reverse transcriptase promoter causes tumor-selective tumor lysis. Cancer Res. 2003;63(22):7936–7941. - PubMed

MeSH terms

Substances