. 2024 Aug 8;187(16):4193-4212.e24.
doi: 10.1016/j.cell.2024.05.058. Epub 2024 Jun 27.

Microglial-derived C1q integrates into neuronal ribonucleoprotein complexes and impacts protein homeostasis in the aging brain

Affiliations

Microglial-derived C1q integrates into neuronal ribonucleoprotein complexes and impacts protein homeostasis in the aging brain

Nicole Scott-Hewitt et al. Cell. .

Abstract

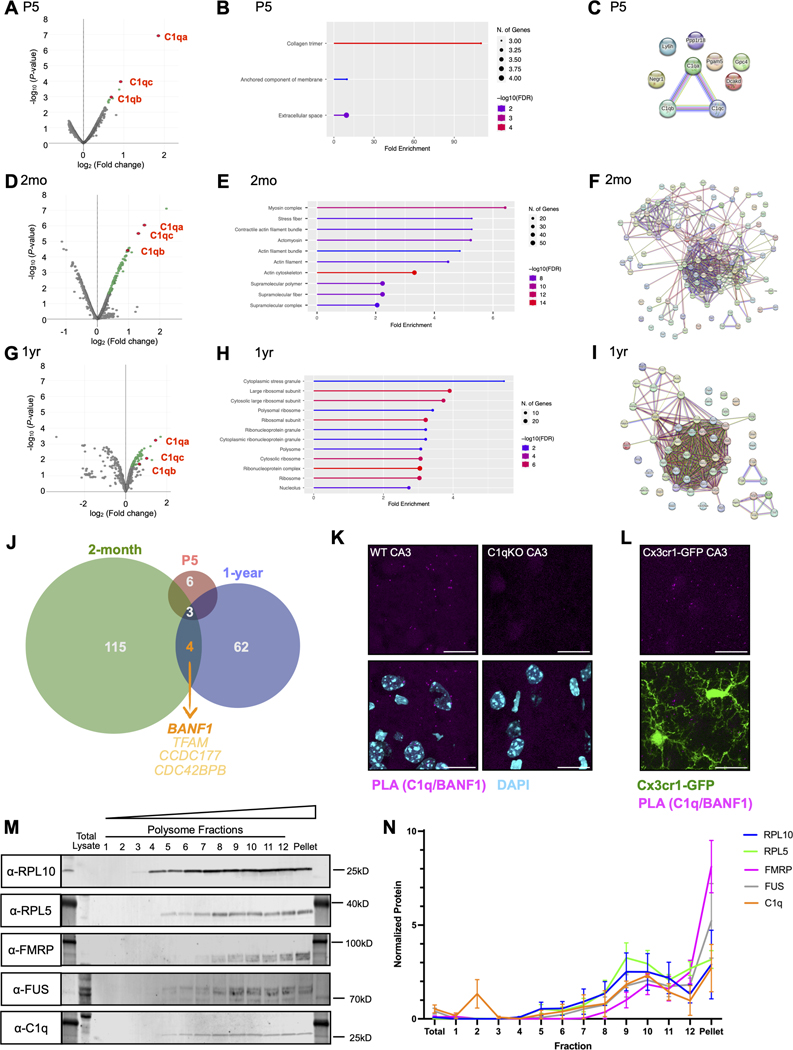
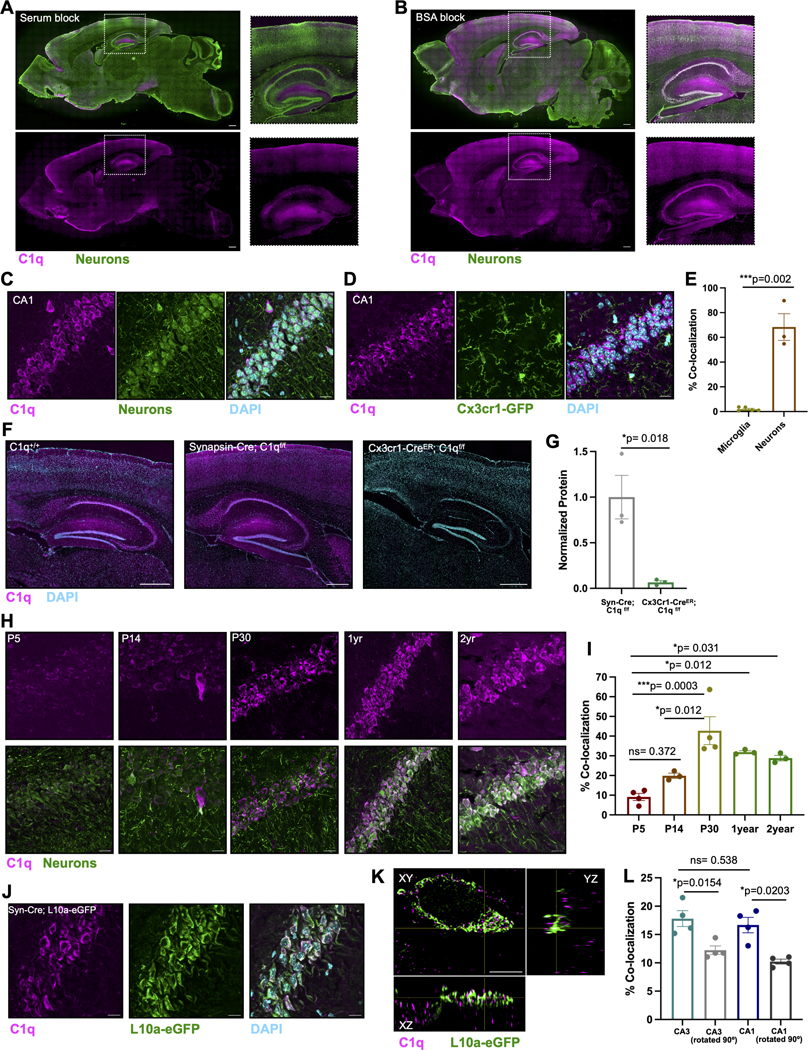
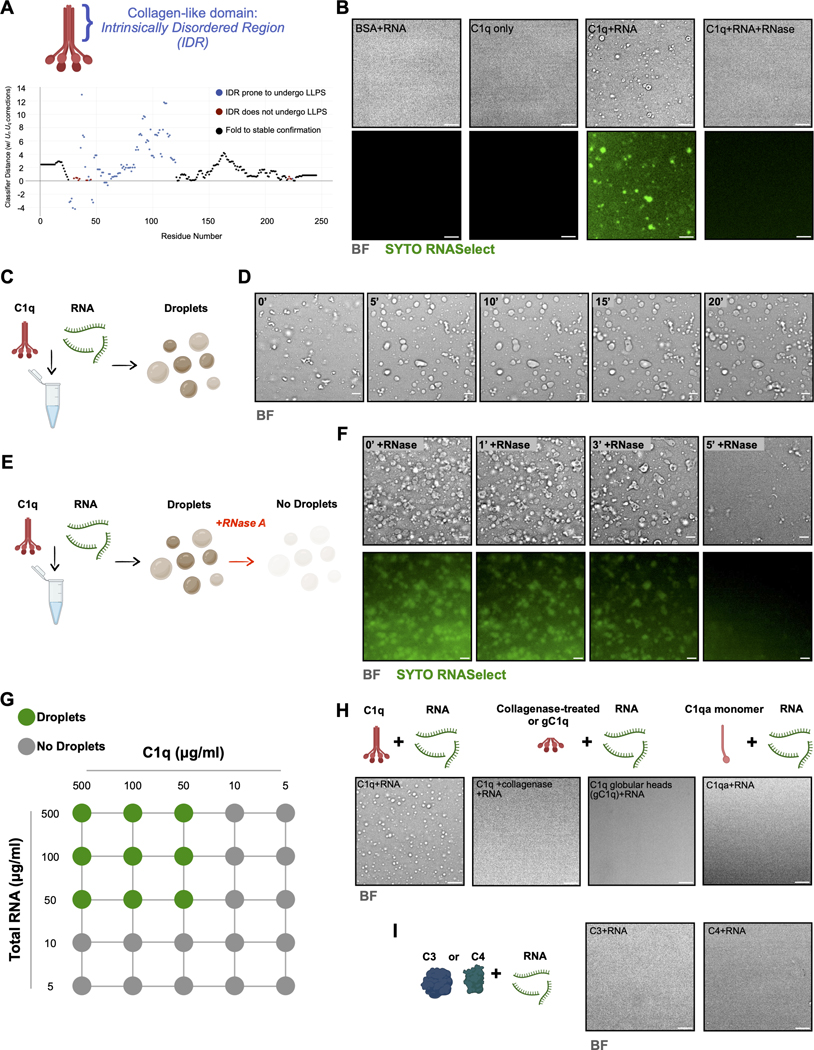
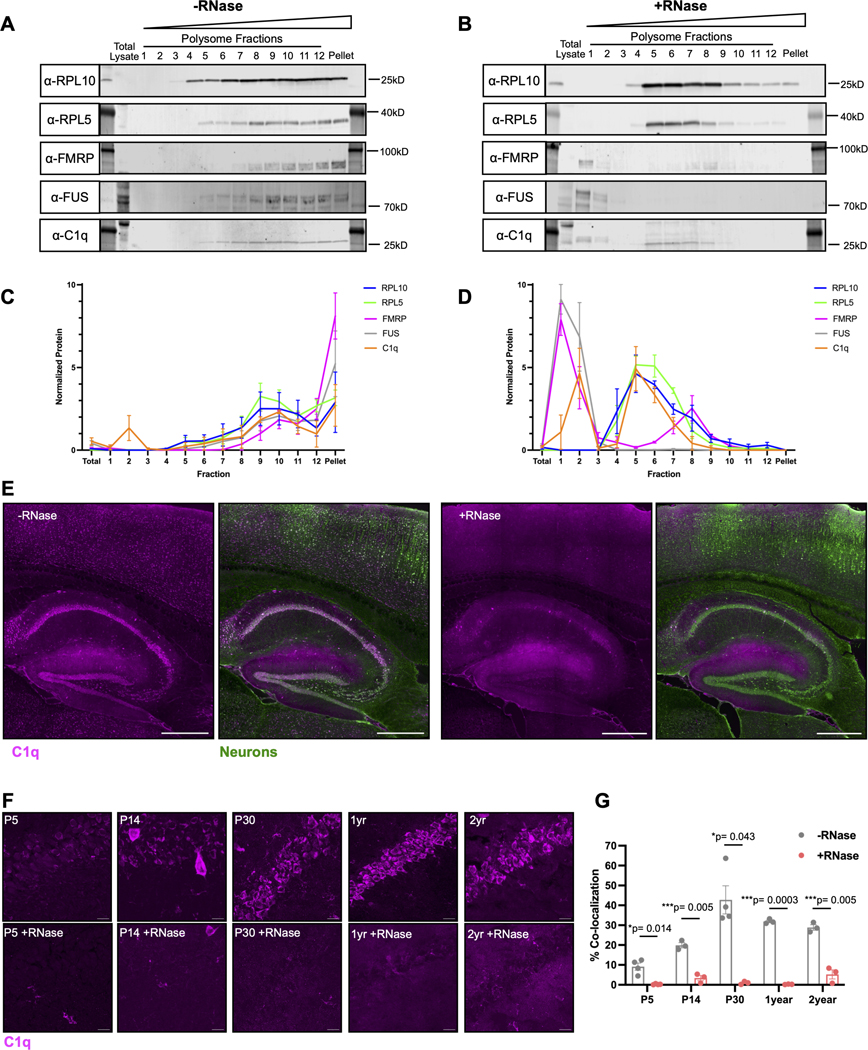
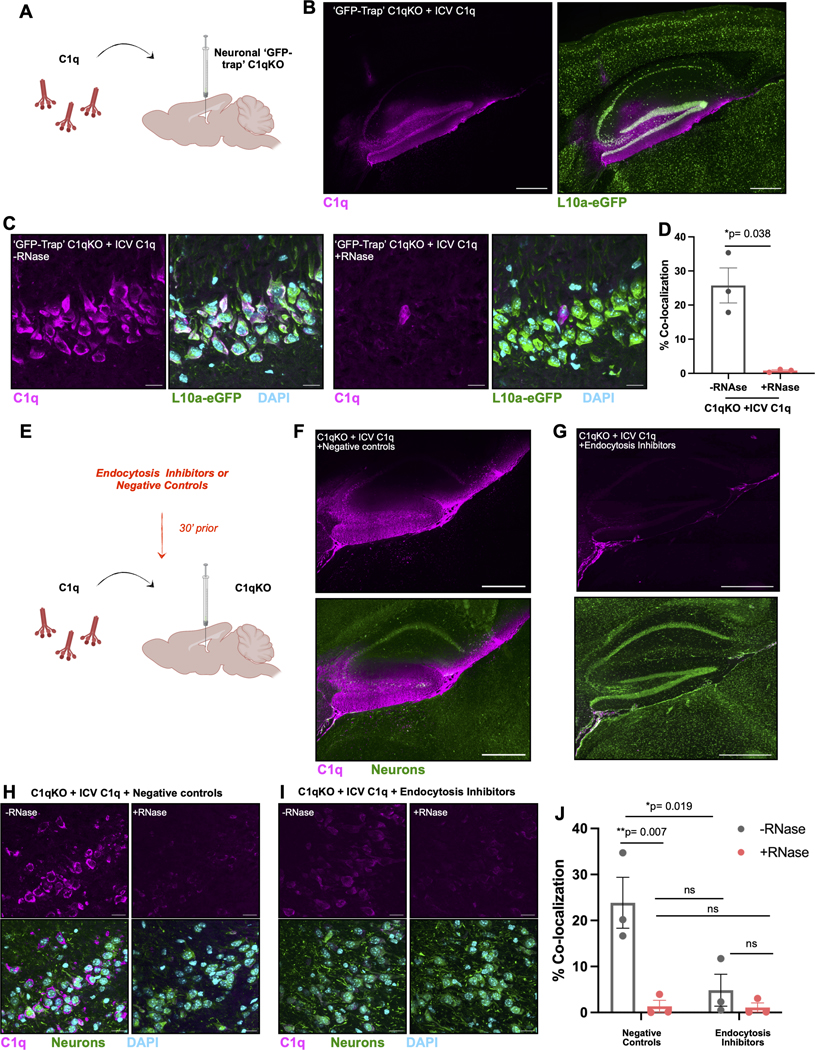
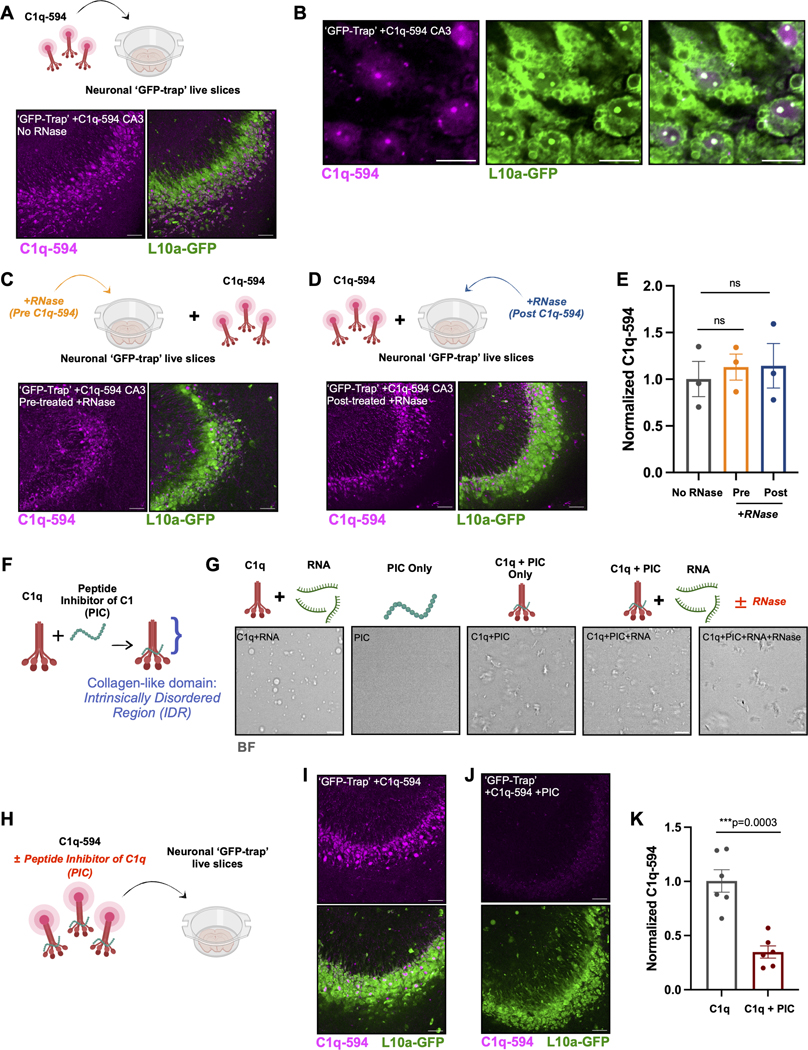
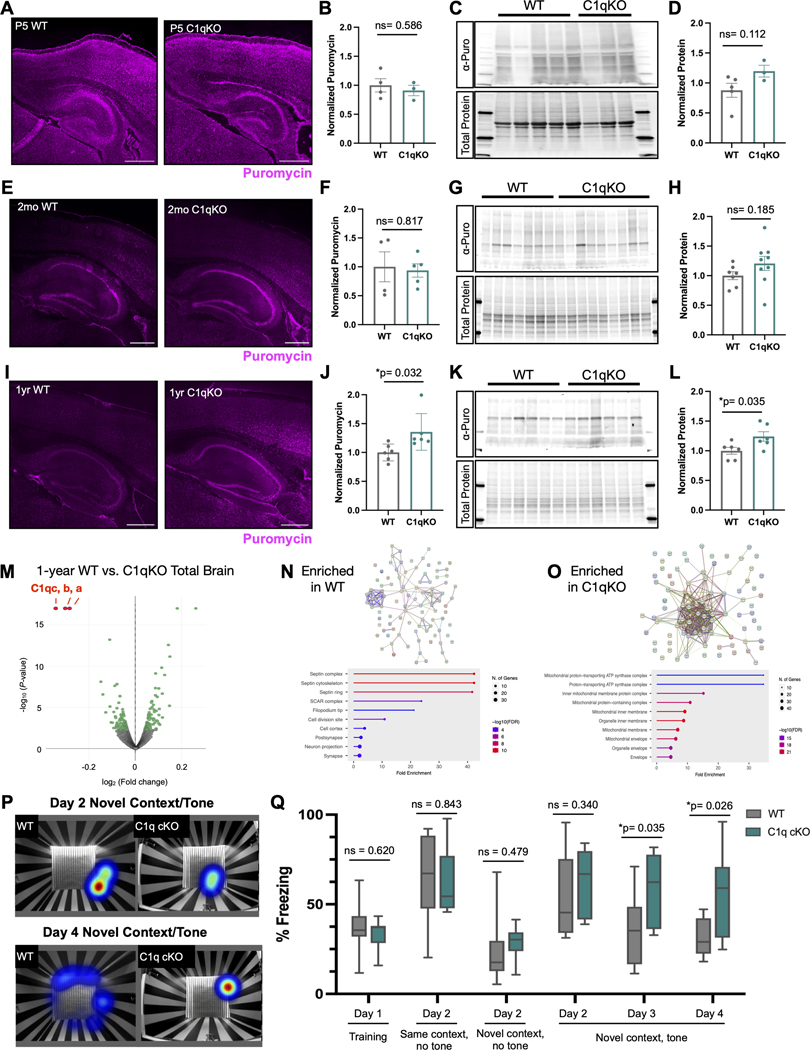
Neuroimmune interactions mediate intercellular communication and underlie critical brain functions. Microglia, CNS-resident macrophages, modulate the brain through direct physical interactions and the secretion of molecules. One such secreted factor, the complement protein C1q, contributes to complement-mediated synapse elimination in both developmental and disease models, yet brain C1q protein levels increase significantly throughout aging. Here, we report that C1q interacts with neuronal ribonucleoprotein (RNP) complexes in an age-dependent manner. Purified C1q protein undergoes RNA-dependent liquid-liquid phase separation (LLPS) in vitro, and the interaction of C1q with neuronal RNP complexes in vivo is dependent on RNA and endocytosis. Mice lacking C1q have age-specific alterations in neuronal protein synthesis in vivo and impaired fear memory extinction. Together, our findings reveal a biophysical property of C1q that underlies RNA- and age-dependent neuronal interactions and demonstrate a role of C1q in critical intracellular neuronal processes.

Keywords: C1q; RNA granule; RNA-binding protein; complement; liquid-liquid phase separation; microglia; neuroimmune; neuronal translation; polysome; ribonucleoprotein complex.


Conflict of interest statement

Declaration of interests B.S. serves on the Scientific Advisory Board of Annexon Biosciences and is a minor shareholder of Annexon.

Figures

Figure 1:
Figure 1:. Unbiased proteomic analyses uncover age-specific protein interactions between C1q and RNA binding proteins
(A) Volcano plot (generated using Genoppi) representing the fold change (log2FC) and adjusted p-value (-log10) of proteins identified to co-immunoprecipitate with C1q at postnatal day 5 (P5). Data represent two technical replicates performed on crude synaptosomes isolated from WT and C1qKO littermates (n=3–4 animals pooled per genotype). Significant ‘hits’ (labeled in green) were identified with an FDR cutoff of p ≤0.1. Bait proteins C1qa, b, and c are highlighted in red. (B) Chart representing the top GO enriched molecular components identified in the P5 C1q-immunoprecipitation dataset from (A). Chart was generated using ShinyGO software comparing significant protein ‘hits’ to total proteins uncovered in the dataset. (C) STRING network analysis for significant proteins identified in (A). (D) Volcano plot generated as described in (A) representing C1q-immunoprecipitation data collected from 2–3-month-old crude synaptosomes. (E) GO enrichment chart as described in (B) from 2–3-month-old C1q-immunoprecipitation dataset from (D). (F) STRING network analysis for significant proteins identified in (D). (G) Volcano plot generated as described in (A) representing C1q-immunoprecipitation data collected from 1-year-old crude synaptosomes. (H) GO enrichment chart as described in (B) from 1-year-old C1q-immunoprecipitation dataset from (G). (I) STRING network analysis for significant proteins identified in (G). (J) Venn diagram representing shared significant proteins identified in (A, D, G). Only three proteins, C1q a, b, and c were common among all three ages. Barrier-to-autointegration 1 (BANF1) is highlighted as a common protein identified between 2–3-month and 1-year datasets. (K) Representative images of 2-month-old WT and C1qKO hippocampal CA3 region with Proximity Ligation Assay (PLA) targeted to C1q and BANF1 (purple) and DAPI (cyan). Scale bar is 15μm (63X magnification). (L) Representative image of 2-month-old Cx3Cr1-GFP hippocampal CA3 region with PLA targeted to C1q and BANF1 (purple) and GFP (green). Scale bar is 15μm (63X magnification). (M) Blots of total brain lysate and subsequent fractions (12 soluble and pellet) of increasing density isolated from a linear sucrose gradient following polysome fractionation. Blots were probed with α-RPL10, α-RPL5, α-FMRP, α-FUS, and α-C1q antibodies. Molecular weight standards are denoted. (N) Quantification of blots of RPL10, RPL5, FMRP, FUS, and C1q normalized to total protein from total brain lysate and polysome fractions represented in (M). Data represent the mean from 3 biological replicates ±SEM. See also Figure S1.
Figure 2:
Figure 2:. Microglial-derived C1q co-localizes with neurons in an age-dependent manner
(A) Representative sagittal images of 2-month-old WT brain tissue immunostained with α-C1q (purple) and a pan-neuronal marker (Milli-Mark; green). Tissue was blocked with 20% Goat Serum. Boxed area: zoomed in image of hippocampus. Scale bar is 500μm (20X objective). (B) Representative sagittal images as described in (A). Tissue was blocked with 1% BSA. All other staining conditions between (A) and (B) were identical. (C) Representative images of CA1 hippocampal pyramidal cell layer of 2-month-old WT brain tissue immunostained with α-C1q (purple), Milli-Mark (neurons; green), and DAPI (cyan). Scale bar is 15μm (63X objective). (D) Representative image of CA1 hippocampal pyramidal cell layer of 2-month-old Cx3Cr1-GFP brain tissue immunostained with α-C1q (purple), GFP (microglia; green), and DAPI (cyan). Scale bar is 15μm (63X objective). (E) Quantification of the percentage of α-C1q immunostaining that co-localizes with either microglia (Cx3Cr1-GFP) or neurons (Milli-Mark). Individual data points represent biological replicates; data are represented as the mean ±SEM. Unpaired t-test. (F) Representative images of hippocampal immunostaining with α-C1q (purple) and DAPI (cyan) in WT (C1q+/+), neuronal C1qKO (Synapsin-Cre; C1qf/f), and microglial C1qKO (Cx3Cr1-CreER; C1qf/f). Scale bar is 500μm (20X objective). (G) Quantification of C1q protein normalized to total protein from brain lysates isolated from neuronal C1qKO (Synapsin-Cre; C1qf/f), and microglial C1qKO (Cx3Cr1-CreER; C1qf/f). Individual data points represent biological replicates; data are represented as the mean ±SEM. Unpaired t-test. (H) Representative images of CA1 hippocampal pyramidal cell layer from postnatal day (P) 5, P14, P30, 1-year, and 2-year-old WT animals immunostained with α-C1q (purple) and Milli-Mark (neurons; green). Scale bar is 15μm (63X objective). (I) Quantification of the percentage of Milli-Mark (neurons) that co-localizes with α-C1q immunostaining across ages in (H). Individual data points represent biological replicates; data are represented as the mean ±SEM. One way ANOVA with Tukey’s Multiple Comparisons. (J) Representative images of hippocampal CA3 from 2-month-old Synapsin-Cre; RPL10a-eGFP; C1q+/− mice immunostained with α-C1q (purple), GFP (neuronal ribosomes; green), and DAPI (cyan). Scale bar is 15μm (63X objective). (K) Representative orthogonal structured illumination microscopy (SIM) image of a CA3 pyramidal neuron from 2-month-old Synapsin-Cre; RPL10a-eGFP; C1q+/− immunostained with α-C1q (purple) and GFP (neuronal ribosomes; green). Images represent single plane XY, YZ, and XZ coordinates. Scale bar is 5μm (63X objective). (L) Quantification of the percentage of RPL10a-eGFP (neuronal ribosomes) that co-localizes with α-C1q immunostaining in 2-month-old Synapsin-Cre; RPL10a-eGFP mice. SIM images were collected in CA3 and CA1 hippocampal regions and used for analysis. Single channel RPL10a-eGFP images were rotated (90°) to compare stochastic colocalization. Individual data points represent biological replicates; data are represented as the mean ±SEM. One-way ANOVA with Šídák’s multiple comparisons test. See also Figure S2.
Figure 3:
Figure 3:. C1q undergoes RNA-dependent liquid-liquid phase separation
(A) Schematic of C1q, with the collagen-like domain containing the intrinsically disordered region (IDR) highlighted in blue. Plot representing the regions along the human C1qa amino acid sequence (x-axis) predicted to contain an IDR and undergo LLPS (blue), predicted to contain an IDR but not undergo LLPS (red), or predicted to fold into a stable confirmation (black). Plot predictions were generated using ParSe v2. (B) Representative images of BSA (200μg/ml) and total human brain RNA (200μg/ml), human C1q (200μg/ml), human C1q (200μg/ml) and total human brain RNA (200μg/ml), and human C1q (200μg/ml) and total human brain RNA (200μg/ml) pretreated with RNase A (1:1000). RNA-binding dye SYTO RNASelect (500nm; green) was added to all conditions. Scale bar is 15μm (20X objective); brightfield (BF). (C) Schematic of experimental design for in vitro C1q: RNA LLPS droplet formation assay. (D) Representative still images captured across timelapse imaging at 0’, 5’, 10’, 15’, and 20’ of human C1q (200μg/ml) and total human brain RNA (500μg/ml). Scale bar is 10μm (20X objective); brightfield (BF). (E) Schematic of experimental design for in vitro C1q: RNA LLPS droplet RNase sensitivity assay. (F) Representative images captured across timelapse imaging at 0’, 1’, 3’, and 5’ of human C1q (200μg/ml) and total human brain RNA (500μg/ml) following addition of RNase (1:1000) at T=0’. Scale bar is 10μm (20X objective); brightfield (BF) and SYTO RNASelect (green). (G) Summary diagram of LLPS droplet formation across varying concentrations of human C1q and total human brain RNA. Green circles represent conditions where droplets were observed, gray circles represent conditions where no droplets were observed. (H) Representative schema and images of human C1q (100μg/ml) and total human brain RNA (200μg/ml), human C1q (100μg/ml) pretreated with collagenase and total human brain RNA (200μg/ml), human C1q globular heads (100μg/ml) and total human brain RNA (200μg/ml), and C1qa peptide (100μg/ml) and total human brain RNA (200μg/ml). Scale bar is 15μm (20X objective); brightfield (BF). (I) Representative diagram and images of human C3 or C4 protein (100μg/ml) and total human rain RNA (200μg/ml). Scale bar is 15μm (20X objective); brightfield (BF). See also Figure S3 and Supplemental Videos V1, V2, and V3.
Figure 4:
Figure 4:. RNA is necessary for C1q interactions with neuronal RNP complexes in vivo
(A) Blots of total brain lysate and subsequent polysome fractions first represented in Figure 1J. (B) Blots of total brain lysate and subsequent polysome fractions from (A) treated with RNase (1:1000) prior to fractionation. Blots were probed with α-RPL10, α-RPL5, α-FMRP, α-FUS, and α-C1q antibodies. (C) Quantification of blots of RPL10, RPL5, FMRP, FUS, and C1q normalized to total protein from total brain lysate and polysome fractions as shown in (A) and first represented in Figure 1K. Data represent the mean from 3 biological replicates ±SEM. (D) Quantification of blots of RPL10, RPL5, FMRP, FUS, and C1q normalized to total protein from total brain lysate and polysome fractions following RNase treatment as shown in (B). Data represent the mean from 3 biological replicates ±SEM. (E) Representative images of hippocampal immunostaining with α-C1q (purple) and Milli-Mark (neurons; green) in tissue treated ±RNase prior to immunostaining. Scale bar is 500μm (20X objective). (F) Representative images of CA1 hippocampal pyramidal cell layer from postnatal day (P) 5, P14, P30, 1-year, and 2-year-old WT animals immunostained with α-C1q (purple) ±RNase. Scale bar is 15μm (63X objective). (G) Quantification of the percentage of neuronal staining (Milli-Mark) that co-localizes with α-C1q immunostaining across ages in (F). Individual data points represent biological replicates; data are represented as the mean ±SEM. Multiple paired t-tests. See also Figure S4.
Figure 5:
Figure 5:. Exogenous C1q protein integration into neuronal RNP complexes in vivo is dependent on endocytosis
(A) Schematic of experimental design for mouse C1q protein (2μl, 1mg/ml) ICV injection into 2-month-old Synapsin-Cre; RPL10a-eGFP; C1q−/− (Neuronal ‘GFP-trap’ C1qKO). (B) Representative hippocampal images of 2-month-old Neuronal ‘GFP-trap’ C1qKO mice following ICV injection with mouse C1q protein immunostained with α-C1q (purple), GFP (neuronal ribosomes), and DAPI (cyan). Scale bar is 500μm (20X objective). (C) Representative hippocampal CA3 images as described in (B) ±RNase treatment prior to immunostaining. Scale bar is 15μm (63X objective). (D) Quantification of the percentage of RPL10a-eGFP (neuronal ribosomes) that co-localizes with α-C1q immunostaining ±RNase treatment. Individual data points represent biological replicates; data are represented as the mean ±SEM. Paired t-test. (E) Schematic of experimental design for in vivo endocytosis inhibition assay. A cocktail of endocytosis inhibitors (cell-permeable dynamin inhibitors) or respective negative controls were ICV injected (2μl of 200μM stocks) into 2-month-old C1qKO animals. Thirty minutes following injection, mouse C1q protein (2μl, 1mg/ml) ICV injection was performed. (F) Representative hippocampal images of 2-month-old C1qKO mice following ICV injection with negative control cocktail followed by mouse C1q protein, immunostained with α-C1q (purple) and Milli-Mark (neurons; green). Scale bar is 500μm (20X objective). (G) Representative hippocampal images of 2-month-old C1qKO mice following ICV injection with endocytosis inhibitor cocktail followed by mouse C1q protein, immunostained with α-C1q (purple) and Milli-Mark (neurons; green). Scale bar is 500μm (20X objective). (H) Representative hippocampal CA3 images as described in (F) ±RNase treatment prior to immunostaining. Scale bar is 15μm (63X objective). (I) Representative hippocampal CA3 images as described in (G) ±RNase treatment prior to immunostaining. Scale bar is 15μm (63X objective). (J) Quantification of the percentage of neuronal staining (Milli-Mark) that co-localizes with α-C1q immunostaining from animals described in (H, I). Individual data points represent biological replicates; data are represented as the mean ±SEM. One-way ANOVA with Šídák’s multiple comparisons test. See also Figure S5.
Figure 6:
Figure 6:. Collagen-like domain interactions, but not RNA, mediate C1q neuronal uptake in live acute brain slices
(A) Schematic and representative images of experiments performed in live acute slices with fluorescently labeled C1q. Mouse C1q protein was conjugated to Alexa 594 (maleimide), and bath applied (1:1000 of 1mg/ml) to acute slices from Synapsin-Cre; RPL10a-eGFP; C1q+/− (Neuronal ‘GFP-trap’) mice for 1-hour. Representative images of hippocampal CA3 from acute slices treated with C1q-594 for 1-hour. Scale bar is 50μm (20X objective); C1q-594 (purple) and GFP (neuronal ribosomes; green). (B) Representative single-plane images of hippocampal CA3 as described in (A). Scale bar is 15μm (20X objective; 5X digital zoom); C1q-594 (purple) and GFP (neuronal ribosomes; green). (C) Schematic and representative images of hippocampal CA3 as described in (A) of slices pretreated with RNase A (1:1000) prior to C1q-594 incubation. Scale bar is 50μm (20X objective); C1q-594 (purple) and GFP (neuronal ribosomes; green). (D) Schematic and representative images of hippocampal CA3 as described in (A) of slices treated with RNase A (1:1000) following C1q-594 incubation. Scale bar is 50μm (20X objective); C1q-594 (purple) and GFP (neuronal ribosomes; green). (E) Quantification of C1q-594 signal from slices treated as described in (A-C). Individual data points represent biological replicates normalized to ‘No RNase’ condition; data are represented as the mean ±SEM. One-way ANOVA with Šídák’s multiple comparisons test. (F) Schematic of C1q interactions with the peptide inhibitor of C1 (PIC). PIC binds to the collagen-like domain containing the intrinsically disordered region (IDR) highlighted in blue. (G) Representative schema and images of mouse C1q (100μg/ml) and total mouse brain RNA (200μg/ml), PIC (100μg/ml) alone, mouse C1q (100μg/ml) pretreated with PIC (100μg/ml), and mouse C1q (100μg/ml) pretreated with PIC (100μg/ml) with total mouse brain RNA (200μg/ml) ±RNase. Scale bar is 15μm (20X objective); brightfield (BF). (H) Schematic of C1q-594 ±PIC treatment of live acute slices isolated from neuronal ‘GFP-trap’ mice (Synapsin-Cre; RPL10a-eGFP). (I) Representative images of hippocampal CA3 from acute slices as described in (H) treated with C1q-594 for 1-hour. Scale bar is 50μm (20X objective); C1q-594 (purple) and GFP (neuronal ribosomes; green). (J) Representative images of hippocampal CA3 from acute slices as described in (H) treated with C1q-594+PIC for 1-hour. Scale bar is 50μm (20X objective); C1q-594 (purple) and GFP (neuronal ribosomes; green). (K) Quantification of the fluorescence intensity of C1q-594 signal from slices treated as described in (H). Individual data points represent biological replicates normalized to C1q-only treated condition; data are represented as the mean ±SEM. Unpaired t-test.
Figure 7:
Figure 7:. Macrophage-derived C1q impacts protein translation and fear extinction learning in an age-specific manner
(A) Representative images of P5 WT and C1qKO hippocampal immunostaining with α-puromycin (purple) following ICV injection with puromycin 1-hour prior. Scale bar is 500μm (20X objective). (B) Quantification of the fluorescence intensity of α-puromycin immunostaining in the hippocampi of P5 WT (WT or C1q+/−) and C1qKO sex-matched littermates. Individual data points represent biological replicates normalized to WT paired littermates; data are represented as the mean ±SEM. Unpaired t-test. (C) Blot of total brain lysate isolated from P5 WT and C1qKO sex-matched littermates as described in (A) probed with α-puromycin antibody. Total protein is shown for reference. (D) Quantification of puromycin normalized to total protein from lysates represented in (C). Individual data points represent biological replicates; data are represented as the mean ±SEM. Unpaired t-test. (E) Representative images of 2–3-month-old WT and C1qKO as described in (A). (F) Quantification of α-puromycin immunostaining of 2–3-month-old WT and C1qKO as described in (B). (G) Blot of total brain lysate isolated from 2–3-month-old WT and C1qKO as described in (C). (H) Quantification of puromycin normalized to total protein from lysates represented in (G). Individual data points represent biological replicates; data are represented as the mean ±SEM. Unpaired t-test. (I) Representative images of 1-year-old WT and C1qKO as described in (A). (J) Quantification of α-puromycin immunostaining of 1-year-old WT and C1qKO as described in (B). (K) Blot of total brain lysate isolated from 1-year-old WT and C1qKO as described in (C). (L) Quantification of puromycin normalized to total protein from lysates represented in (K). Individual data points represent biological replicates; data are represented as the mean ±SEM. Unpaired t-test. (M) Volcano plot (generated using Genoppi) representing the fold change (log2FC) and adjusted p-value (-log10) of global proteomics data comparing 1-year old WT to C1qKO brain tissue. C1qa, b, and c peptides are highlighted in red. Values in green represent significant peptides (FDR <0.01). Three biological replicates per genotype/treatment were used for all proteomic datasets. (N) STRING network analysis and chart representing the top GO enriched molecular components identified in the 1-year-old global proteomic dataset from (M) of proteins enriched in WT brain tissue. Chart was generated using ShinyGO software comparing significant protein ‘hits’ to total proteins uncovered in the dataset. (O) STRING network analysis and chart representing the top GO enriched molecular components identified in the 1-year-old global proteomic dataset from (M) of proteins enriched in C1qKO brain tissue. Chart was generated using ShinyGO software comparing significant protein ‘hits’ to total proteins uncovered in the dataset. (P) Representative heat maps of animal movement on Day 2 and Day 4 following contextual fear conditioning. Heat maps generated in EthoVision software over the course of 3-minute novel context/tone exposure. (Q) Quantification of the percentage of freezing behavior animals exhibited following contextual fear conditioning over the course of memory acquisition (Day 1: training), retrieval (Day 2: same context/no tone and novel context/tone), and extinction (Days 3–4: novel context/tone). Data are mean of N= 10 (WT) and 8 (cC1qKO) animals per group. Two-way ANOVA: for WT vs. cC1qKO P=0.0121 for the combination of genotype x time as a significant source of variation and P=<0.001 for time as a significant source of variation; with Šídák’s multiple comparisons test. See also Figure S6.

Similar articles

Cited by

References

    1. Hong S, Beja-Glasser VF, Nfonoyim BM, Frouin A, Li S, Ramakrishnan S, Merry KM, Shi Q, Rosenthal A, Barres BA, et al. (2016). Complement and microglia mediate early synapse loss in Alzheimer mouse models. Science 352, 712–716. 10.1126/science.aad8373. - DOI - PMC - PubMed
    1. Schafer DP., Lehrman EK., Kautzman AG., Koyama R., Mardinly AR., Yamasaki R., Ransohoff RM., Greenberg ME., Barres BA., and Stevens B. (2012). Microglia sculpt postnatal neural circuits in an activity and complement-dependent manner. Neuron 74, 691–705. 10.1016/j.neuron.2012.03.026. - DOI - PMC - PubMed
    1. Stevens B, Allen NJ, Vazquez LE, Howell GR, Christopherson KS, Nouri N, Micheva KD, Mehalow AK, Huberman AD, Stafford B, et al. (2007). The classical complement cascade mediates CNS synapse elimination. Cell 131, 1164–1178. 10.1016/j.cell.2007.10.036. - DOI - PubMed
    1. Dejanovic B, Wu T, Tsai M-C, Graykowski D, Gandham VD, Rose CM, Bakalarski CE, Ngu H, Wang Y, Pandey S, et al. (2022). Complement C1q-dependent excitatory and inhibitory synapse elimination by astrocytes and microglia in Alzheimer’s disease mouse models. Nature Aging 2, 837–850. 10.1038/s43587-022-00281-1. - DOI - PMC - PubMed
    1. Werneburg S, Jung J, Kunjamma RB, Ha SK, Luciano NJ, Willis CM, Gao G, Biscola NP, Havton LA, Crocker SJ, et al. (2020). Targeted Complement Inhibition at Synapses Prevents Microglial Synaptic Engulfment and Synapse Loss in Demyelinating Disease. Immunity 52, 167–182.e167. 10.1016/j.immuni.2019.12.004. - DOI - PMC - PubMed

LinkOut - more resources