. 2024 Sep 23;59(18):2460-2476.e10.
doi: 10.1016/j.devcel.2024.06.001. Epub 2024 Jun 27.

The centrosomal protein FGFR1OP controls myosin function in murine intestinal epithelial cells

Affiliations

The centrosomal protein FGFR1OP controls myosin function in murine intestinal epithelial cells

Tihana Trsan et al. Dev Cell. .

Abstract

Recent advances in human genetics have shed light on the genetic factors contributing to inflammatory diseases, particularly Crohn's disease (CD), a prominent form of inflammatory bowel disease. Certain risk genes associated with CD directly influence cytokine biology and cell-specific communication networks. Current CD therapies primarily rely on anti-inflammatory drugs, which are inconsistently effective and lack strategies for promoting epithelial restoration and mucosal balance. To understand CD's underlying mechanisms, we investigated the link between CD and the FGFR1OP gene, which encodes a centrosome protein. FGFR1OP deletion in mouse intestinal epithelial cells disrupted crypt architecture, resulting in crypt loss, inflammation, and fatality. FGFR1OP insufficiency hindered epithelial resilience during colitis. FGFR1OP was crucial for preserving non-muscle myosin II activity, ensuring the integrity of the actomyosin cytoskeleton and crypt cell adhesion. This role of FGFR1OP suggests that its deficiency in genetically predisposed individuals may reduce epithelial renewal capacity, heightening susceptibility to inflammation and disease.

Keywords: FGFR1OP; adhesion; autoimmunity; centrosome; cytoskeleton; desmosome; epithelial cells; inflammatory bowel disease; non-muscle myosin.


Conflict of interest statement

Declaration of interests R.J.X. is co-founder of Jnana Therapeutics and Celsius Therapeutics, scientific advisory board member at Nestlé, and board director at MoonLake Immunotherapeutics. These organizations had no roles in this study.

Figures
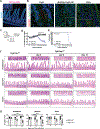
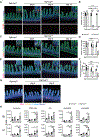
Figure 1.
Figure 1.. Induced Fgfr1op deletion disrupts intestinal crypts
(A) In situ hybridization of small intestinal tissues with a probe for Fgfr1op mRNA. Tissues are counterstained with anti-Epcam to visualize the intestinal epithelium. The image is representative of 6 mice examined. Scale bar 50 μm. (B) Representative confocal images of FGFR1OP expression in the crypt and villus. Sections were counterstained with anti-α-tubulin. Red arrows, FGFR1OP expression in the apical side of epithelial cells in crypts and villi; white arrows, FGFR1OP staining in the microtubule-organizing center in dividing cells. Images are representative of 6 mice examined. Scale bar 10 μm. (C-E) Schematic of the experimental time course: Cre was induced by intraperitoneal (i.p.) injection of TAM for 5 consecutive days prior to analysis on days 6, 9, and 12 post Cre induction (C). Weight loss (n=10 mice, mean±SD, Multiple Mann-Whitney test with Holm-Šídák correction; ****P<0.0001, **P<0.01) (D) and survival (E) upon TAM-induced Fgfr1op deletion [Log-rank (Mantel-Cox) test]; data is representative of two independent experiments. (F-G) H&E images of small intestine on days 6, 9, and 12 post Cre induction (F). Images are representative of 3 independent experiments; Scale bar 100 μm. Crypt numbers in duodenum, jejunum, and ileum (n=4–9 mice per genotype and time point; mean±SD, one-way ANOVA with Tukey’s correction; *P<0.05, **P<0.01, ****P<0.0001) (G). Due to the disappearance of well-oriented crypts as part of the Fgfr1opcKO phenotype, all crypts in the vision field were counted regardless of their appearance and size in both, Fgfr1opcKO and control mice.
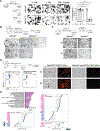
Figure 2.
Figure 2.. Fgfr1op deletion affects proliferating intestinal epithelial cells and associates with myeloid cell infiltration
(A-F) Mice were treated with TAM and analyzed on days 6, 9, and 12 post Cre induction as in Figure 1C. Representative images (A) and numbers (B) of OLFM4+ cells; sections were counterstained with anti-β-Catenin. Representative images (C) and quantification of BrdU incorporation (D). BrdU was injected i.p. 2h before sacrificing; sections were counterstained with anti-EpCAM. Representative images (E) and numbers (F) of PHH3-expressing cells; sections were counterstained with anti-β-Catenin. (A-F) data are representative of two independent experiments and n=4 mice per genotype and time point; (B,D,F) mean±SD is shown; one-way ANOVA with Tukey’s correction; ns=not significant, *P<0.05, **P<0.01, ***P<0.001, ****P<0.0001; (A,C,E) Scale bar 50 μm. (G) Immunofluorescence images of IBA1+ myeloid cells and S100a9+ neutrophils infiltrating the intestine upon Fgfr1op deletion (representative of two independent experiments, n=4 mice per genotype and time point; sections are counterstained with anti-β-Catenin). Scale bar 50 μm. (H) Numbers of myeloid cell subsets within the epithelium (IEL) and lamina propria (LP) at day 6 and 9 post Cre induction (n=3–4 mice; mean±SD, one-way ANOVA with Tukey’s correction, *P<0.05, **P<0.01, ****P<0.0001; representative of two independent experiments). See also Figure S4B.
Figure 3.
Figure 3.. Impact of Fgfr1op deletion on 3D cultures of stem cells
(A) Organoid cultures were established from crypts isolated from untreated mice, followed by TAM treatment in vitro for 3 days and passaging on day 6. Images were taken on day 5 for both passages. Images are representative of 3 independent experiments. Scale bars 200 μm. The bar graph shows average numbers of crypt-like domains per organoid (n=30–41 organoids per mouse and n=4 mice per genotype; mean±SD, one-way ANOVA with Tukey’s correction, ****P<0.0001). (B) Spheroid cultures were established from crypts isolated on day 6 and 9 after Cre induction in vivo (as in Figure 1C). P1, P2 – passage 1 and 2. Images were taken on day 3 post passaging. Scale bars 300 μm. Data are representative of two independent experiments. (C) Spheroid cultures were established from crypts isolated from untreated Fgfr1opfl/fl and Fgfr1opcKO mice and then treated with TAM in vitro for 3 days. P0 – day 3 before passaging, P1 – day 3 after passaging. Scale bars 200 μm. Data are representative of three independent experiments. (D) Fgfr1op deletion was induced with a single injection of TAM in Fgfr1opfl/fl-Lgr5-EGFP-creERT2-tdTom or Lgr5-EGFP-creERT2-tdTom control mice. LGR5+ tdTomato+ cells were sorted 7 days later and 10,000 cells were plated in Matrigel and cultured as spheroids for 9 days, followed by passaging. Flow cytometry plots show the gating strategy to isolate EGFP+ stem cells in which Cre is expressed and deletes the LoxP-flanked stop cassette allowing tdTomato expression. Spheroid images were taken on day 9 post sorting (P1) and on day 3 post passaging (P2). Data are representative of 3 mice examined. Scale bar 200 μm. (E) RNA for RNA-seq analysis was isolated from spheroid cultures derived from Fgfr1opfl/fl and Fgfr1opcKO mice and treated with TAM for 3 days in vitro. Pathway analysis (Metascape) comparing mRNA profiles of Fgfr1opcKO and Fgfr1opfl/fl spheroids (n=3 mice, padj<0.05, log2FC=−1.2 – 1.2) and representative DEGs associated with actin cytoskeleton, stem cell regeneration, and migration / adhesion are shown. Pink and blue colors denote upregulated and downregulated genes, respectively.
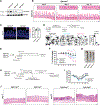
Figure 4.
Figure 4.. Fgfr1op+/− mice have impaired capacity for epithelial regeneration
(A) Crypts were isolated on day 6 post Cre induction (as in Figure 1C) and analyzed for FGFR1OP expression by immunoblotting. Anti-GAPDH antibody was used as a loading control. Blot is representative of 2 independent experiments and n=5–6 mice per genotype. (B) H&E images of small intestine on days 6, 9, and 12 post Cre induction. Images are representative of 3 independent experiments and n=6–9 per genotype and time point. Scale bar 100 μm. (C) OLFM4+ staining on day 12 post Cre induction. Scale bar 50 μm. Graph shows number of OLFM4+ cells per crypt (mean±SD, Mann-Whitney U test, ns=not significant). Data are representative of two independent experiments and n=4 mice per genotype. (D) Organoid cultures were established from crypts isolated from untreated mice, followed by TAM treatment in vitro for 3 days. Images were taken on day 5. Scale bar 200 μm. Images are representative of 3 independent experiments. Graph shows average numbers of crypt-like domains per organoid (n=30–40 organoids per mouse and n=4 mice per genotype; mean±SD, one-way ANOVA with Tukey’s correction, ***P<0.001, ****P<0.0001). (E-G) Female mice were treated with 2.5% DSS in water for 7 days (E). Weight loss (n=15–18 mice per genotype; pool of two independent experiments; Two-way ANOVA; mean ± SD; *P<0.05, **P<0.01, ***P<0.001, ****P<0.0001) (F). Representative images of colons on day 7 (G). (H-J) Female mice were treated with 2.5% DSS in water for 7 days, followed by 14 days of normal water (H). Weight loss (n=7–8 mice per genotype; Multiple Mann-Whitney test with Holm-Šídák correction) (I). Representative H&E images on day 7 and 21 (J). Scale bar 100 μm.
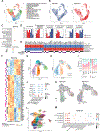
Figure 5.
Figure 5.. scRNA-seq analysis reveals reduction of progenitors and appearance of injury-induced cell populations in Fgfr1op-deficient crypts
(A-F) Crypt cells for scRNA-seq analysis were isolated from Fgfr1opfl/fl and Fgfr1opcKO mice on day 6 post Cre induction (n=3 mice per genotype). (A) UMAP representing all the identified clusters. (B) UMAPs representing cluster distributions within each genotype. (C) Dotplot of Fgfr1op expression across clusters. (D) Proportion of all cells for designated clusters, and Fgfr1opfl/fl and Fgfr1opcKO genotypes. (E) Heatmap showing DEGs associated with injury and proliferation / apoptosis pathways (Metascape) between the enterocyte progenitors in Fgfr1opfl/fl mice and the injury-induced enterocyte progenitors in Fgfr1opcKO mice. (F) Heatmap representing DEGs associated with cytoskeleton, injury, and proliferation / apoptosis pathways (Metascape) in the Stem-TA cluster. (G-K) Re-clustering of cells from clusters 0, 2, 4, 5 and 12 of Figure 5A. (G) UMAPs representing all clusters identified; TA – transit-amplifying, SP - secretory progenitors, GC - Goblet cells, EP – enterocyte progenitors, IIEP – injury-induced enterocyte progenitors. (H) UMAPs showing how clusters are distributed within each genotype category. (I) Breakdown of genotype distribution within each cluster. (J) Dotplot representing expression of Mki67, Lgr5, Olfm4 and Fgfr1op for each individual cluster. (K) Velocity stream as computed by the dynamic model of scvelo. (L-M) UMAP of integrated scRNA-seq analysis of human intestinal epithelium in CD, UC and control subjects, (L) and dotplot of expression of FGFR1OP transcripts in integrated epithelial scRNA-seq atlas categorized by disease status of subjects (M).
Figure 6.
Figure 6.. Deletion of FGFR1OP in Caco2 cells recapitulates impaired cytoskeleton phenotype in vivo
(A) Intestinal crypts were analyzed by TEM on day 6 after Cre induction. Basolateral desmosomes are shown. Arrows indicate intermediate filaments associated with desmosomes. Scale bar 100 μm. Data are representative of n=4 mice per genotype. (B) Drawing of desmosome complex with intermediate filaments depicting width and length of desmosome, and intermembrane space. Created with BioRender.com. (C) Bar graphs show width and length measurements (as defined in B) of crypt basolateral desmosomes analyzed by TEM on day 6 after Cre induction (points represent individual desmosomes (n=5–8 desmosomes per mouse) in n=4 mice per genotype; mean±SD; Mann-Whithey U test, ****P<0.0001). (D) An outline of the experimental design for (E-H) is shown. Caco2 cells stably transduced with FGFR1OP shRNA or control shRNA were treated with 2 μg/ml doxycycline for 3 days prior the analysis. Representative images of ZsGreen expression upon shRNA induction in both cell lines are shown at the bottom of the scheme. (E-F) TEM analysis of shRNA-expressing Caco2 cell lines. (E) Representative images. Desmosome structures are indicated by red arrows. Images are representative of three independent experiments. Scale bar 500 nm. (F) Bar graphs show desmosome complex measurements (as defined in B); points represent individual desmosomes (n=20–35); mean±SD; one-way ANOVA with Tukey’s correction, ****P<0.0001). (G-H) Wound healing assay for untreated and doxycycline-treated FGFR1OP or control shRNA-expressing Caco2 cells. (G) Representative images. Scale bar 500 μM. (H) Bar graph representation of individual wound assays with percentage of closed wound area (n=3–4; one-way ANOVA with Tukey’s correction; mean ± SD; ns=not significant, *P<0.05, **P<0.01) (H). Data are representative of three independent experiments.
Figure 7.
Figure 7.. FGFR1OP sustains colocalization of myosin with actin filaments through NMII activation
(A-B) FGFR1OP tagged with C- or N-terminal FLAG was overexpressed in Caco2 cells, and a pull-down assay was performed with anti-FLAG antibody (A). Proteins selectively identified in Caco2 cells expressing C- or N-FLAG-tagged FGFR1OP are shown in orange. Proteins identified in parental Caco2 cells or proteins with low total spectrum counts (cutoff: <7 counts) in all Caco2 lines are shown in grey. Data represent the pool of two independent experiments. (B) Pathway analysis (Metascape) of identified protein interactors. (C-D) Confocal images of myosin and actin distribution in the crypts on day 6 post Cre induction (C); images are representative of two independent experiments, n=4 mice per genotype. Scale bar 10 μm. (D) Manders’s overlap coefficient calculated for actin and myosin staining. Dots represent coefficients for individual cells from n=3 crypts per genotype (mean±SD, Mann-Whitney U test; ****P<0.0001). (E) Crypts were isolated on day 6 post Cre induction and analyzed for FGFR1OP, NMII regulatory light chain (RLC), and phosphorylated NMII regulatory light chain (p-RLC) expression by immunoblotting. Blot is representative of 2 independent experiments and n=8 mice per genotype. (F) Caco2 cells stably transduced with FGFR1OP or control shRNA were treated with 2 μL/ml doxycycline for 3 days and analyzed by immunoblotting. Blot is representative of 2 independent experiments and n=6 replicates per genotype. (E-F) Anti-GAPDH and anti-β-actin antibodies were used as loading controls. (G-H) TEM analysis of Caco2 cells stably expressing either FGFR1OP shRNA or control shRNA, and either NMII RLC or constitutively active NMII RLC (see also Figure S7E). (G) Representative images. Desmosome structures are indicated by red arrows. Scale bar 500 nm. Images are representative of two independent experiments and n=4 replicates per genotype and condition. (H) Bar graphs show desmosome complex measurements (as defined in Figure 6B); points represent individual desmosomes (n=24–35 per condition); mean±SD; one-way ANOVA with Tukey’s correction, ***P<0.001, ****P<0.0001, ns=not significant).

References

    1. Beumer J, and Clevers H (2021). Cell fate specification and differentiation in the adult mammalian intestine. Nat Rev Mol Cell Biol 22, 39–53. 10.1038/s41580-020-0278-0. - DOI - PubMed
    1. Sato T, van Es JH, Snippert HJ, Stange DE, Vries RG, van den Born M, Barker N, Shroyer NF, van de Wetering M, and Clevers H (2011). Paneth cells constitute the niche for Lgr5 stem cells in intestinal crypts. Nature 469, 415–418. 10.1038/nature09637. - DOI - PMC - PubMed
    1. Barker N, van Es JH, Kuipers J, Kujala P, van den Born M, Cozijnsen M, Haegebarth A, Korving J, Begthel H, Peters PJ, and Clevers H (2007). Identification of stem cells in small intestine and colon by marker gene Lgr5. Nature 449, 1003–1007. 10.1038/nature06196. - DOI - PubMed
    1. van der Flier LG, and Clevers H (2009). Stem cells, self-renewal, and differentiation in the intestinal epithelium. Annu Rev Physiol 71, 241–260. 10.1146/annurev.physiol.010908.163145. - DOI - PubMed
    1. Snippert HJ, van der Flier LG, Sato T, van Es JH, van den Born M, Kroon-Veenboer C, Barker N, Klein AM, van Rheenen J, Simons BD, and Clevers H (2010). Intestinal crypt homeostasis results from neutral competition between symmetrically dividing Lgr5 stem cells. Cell 143, 134–144. 10.1016/j.cell.2010.09.016. - DOI - PubMed

Publication types

MeSH terms