. 2024 Jul 10;4(7):100589.
doi: 10.1016/j.xgen.2024.100589. Epub 2024 Jun 27.

Evolutionary and biomedical implications of sex differences in the primate brain transcriptome

Affiliations

Evolutionary and biomedical implications of sex differences in the primate brain transcriptome

Alex R DeCasien et al. Cell Genom. .

Abstract

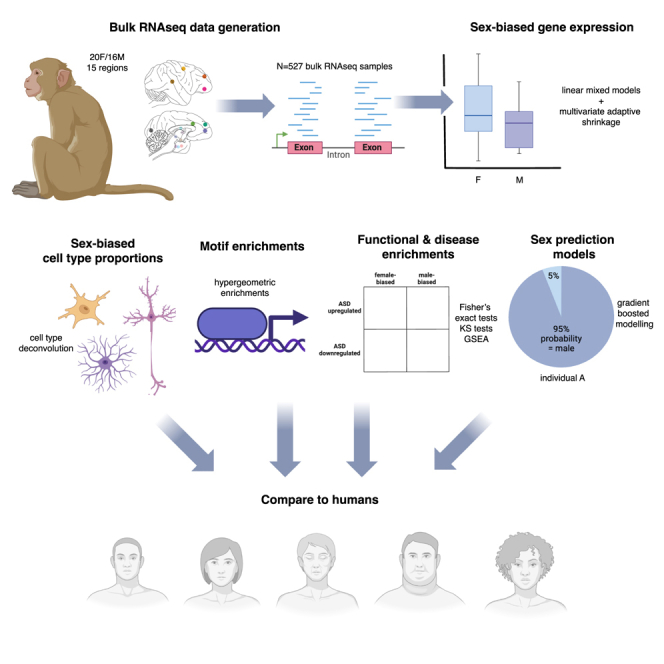
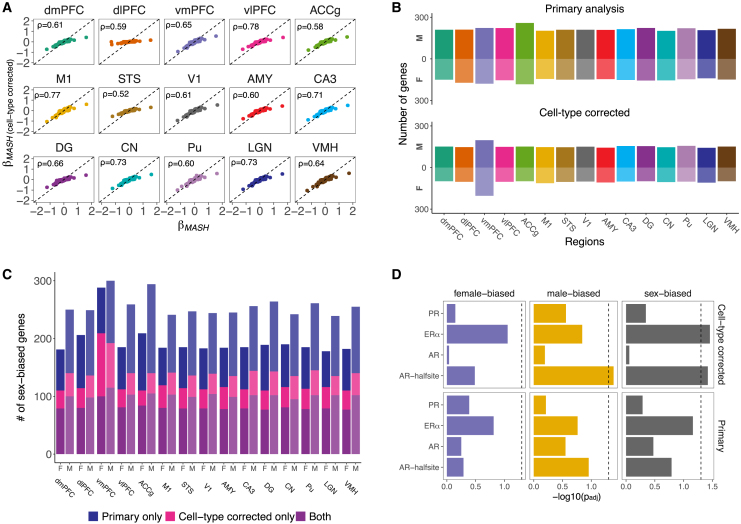
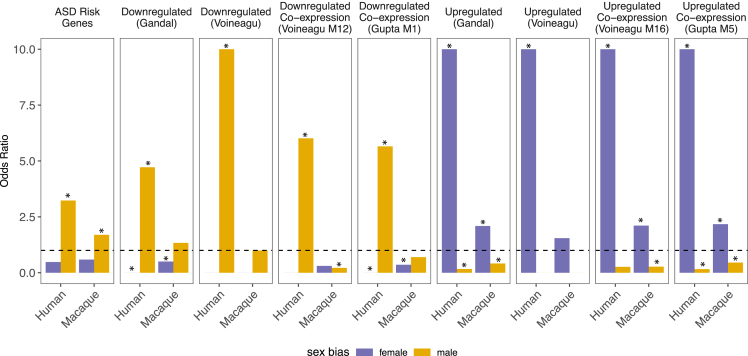
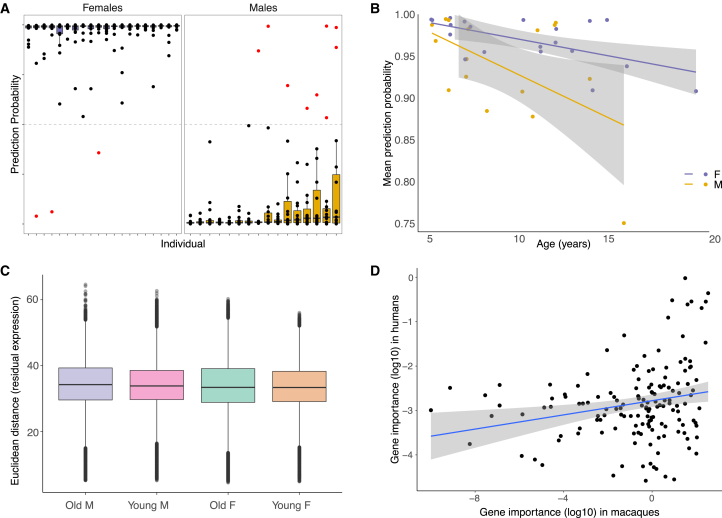
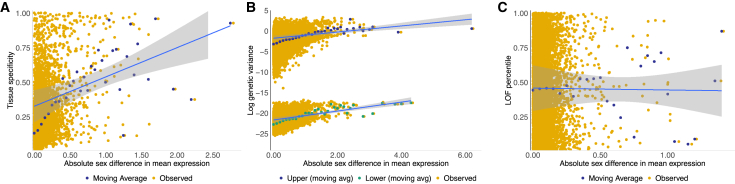
Humans exhibit sex differences in the prevalence of many neurodevelopmental disorders and neurodegenerative diseases. Here, we generated one of the largest multi-brain-region bulk transcriptional datasets for the rhesus macaque and characterized sex-biased gene expression patterns to investigate the translatability of this species for sex-biased neurological conditions. We identify patterns similar to those in humans, which are associated with overlapping regulatory mechanisms, biological processes, and genes implicated in sex-biased human disorders, including autism. We also show that sex-biased genes exhibit greater genetic variance for expression and more tissue-specific expression patterns, which may facilitate rapid evolution of sex-biased genes. Our findings provide insights into the biological mechanisms underlying sex-biased disease and support the rhesus macaque model for the translational study of these conditions.

Keywords: animal model; autism; brain evolution; comparative neurobiology; rhesus macaque; sex-biased gene expression.


Conflict of interest statement

Declaration of interests The authors declare no competing interests.

Figures

None
Graphical abstract
Figure 1
Figure 1
Experimental design and global expression patterns (A) Fifteen brain regions sampled in the current study. Top = lateral view. Bottom = medial view. Some structures are internal and cannot be viewed from the planes depicted. (B) Uniform manifold approximation and projection (UMAP) plot of expression data. Each point represents one sample (n = 527). Colors indicate region and shapes indicate sex (see legend). (C) Violin plots with overlaid boxplots of variance proportions for each gene and variable from variance partitioning analysis. Boxplots indicate the median (black horizontal line), first and third quartiles (i.e., interquartile range [IQR]; lower and upper hinges), and ranges extending from each to 1.5 × IQR beyond each hinge (whiskers). Points represent individual genes that are outliers (i.e., beyond whiskers), and their shape indicates the chromosomal location (autosome = •, X chromosome = ✕, Y chromosome = ∗).
Figure 2
Figure 2
Regional and chromosomal distributions of sex-biased genes in macaque brains (A) Correlation plot for pre-mashr sex effect sizes (from EMMREML) across regions (Spearman’s ⍴). Teal = positive correlation, brown = negative correlation, size of square indicates strength of correlation. Of these interregional correlations, 77 are significantly positive, 23 are significantly negative, and are five not significant (p > 0.05). (B) Volcano plot of sex-biased X chromosome genes. Each point = one gene; minimum LFSR (x axis) and maximum β (y axis) across regions are shown; point size is proportional to the # of regions in which the gene is sex biased (LFSR < 0.05); positive β = male biased, negative β = female biased. (C) As in (B) for sex-biased autosomal genes. (D) Bar chart of the number of sex-biased genes (LFSR < 0.05) shared across different numbers of regions identified by our primary mashr analyses. (E) Proportions of genes on each chromosome that are not biased in any region (gray), female biased in at least one region (purple), or male biased in at least one region (yellow). The sex chromosomes are enriched for sex-biased genes (Fisher’s exact tests: p < 0.05). (F) Violin plots of sex effect sizes (mashr β) for sex-biased autosomal versus X chromosome genes.
Figure 3
Figure 3
Comparisons of sex-biased gene expression patterns, cell types, and biological processes in macaque and human brains (A) Scatterplots of estimated sex effects (mashr β) for all one-to-one orthologous genes (excluding the Y chromosome) in humans (GTEx) versus rhesus macaques (this study) (circles = autosomal genes; triangles = X chromosome genes). Green points represent genes with concordant sex bias (mashr β) across species, while red points represent discordance. Significant correlations (Spearman’s ⍴; p < 0.05) are in bold. (B) Pie charts showing the proportions of genes with (1) conserved sex bias (padj < 0.05 for sex in LMMs and mashr βs estimated in the concordant direction in both species; see STAR Methods); (2) “weakly” conserved sex bias (padj < 0.05 for sex in LMMs but inconsistent mashr βs); (3) sex bias in one species only (padj > 0.05 for sex in LMMs and mashr LFSR < 0.05 in one species only); or (4) no sex bias. No genes were identified as having statistically significant divergent sex bias (both mashr LFSRs < 0.05 but mashr βs in opposite directions). Note that we did not detect any genes with human-specific female-bias in the dorsomedial prefrontal cortex (dmPFC) or ventromedial hypothalamus (VMH) (no percentages are shown for these sets). (C) Examples of conserved sex-biased genes in humans and macaques. Boxplots show covariate-adjusted expression levels for each sex within each species. Genes depicted include ZRSR2 in the amygdala (female biased, undergoes XCI escape), GABRQ in the hypothalamus (male biased, associated with ASD), CHI3L1 in the prefrontal cortex (female biased, associated with schizophrenia), and CALB1 (male biased, associated with epilepsy). (D) Boxplots show estimated relative cell-type proportions (i.e., SPVs from BRETIGEA, see STAR Methods) within each sex for macaques (top) and humans (bottom) for each of six brain cell types. Significant sex differences are indicated with an asterisk (∗) (t test: ∗p < 0.05). (E) g:Profiler enrichment results for genes with conserved female-biased expression in humans and macaques. Top three terms (with lowest padj < 0.05 [adjusted using default g:SCS], shown on the x axis) are shown for biological processes (GO:BP), cellular compartments (GO:CC), and human phenotypes (HP). (F) As in (E) for conserved male-biased genes.
Figure 4
Figure 4
Cell-type-corrected sex-biased gene expression in macaque brains (A) Scatterplots of sex effects (mashr β) from our unadjusted (primary) analyses (x axis) versus cell-type-corrected analyses (y axis) for each region (dashed line: intercept = 0, slope = 1). Spearman’s ⍴ values are shown. (B) Counts of sex-biased genes identified by mashr (LFSR < 0.05) using unadjusted (top) and cell-type-corrected (bottom) expression data. M = male-biased, F = female-biased. (C) Stacked bar plots of the number of male- and female-biased genes identified per region in our primary and/or cell-type corrected analyses. M, male biased; F, female biased. (D) Bar plots of enrichment results for sex-hormone-related motifs among male-, female-, and sex-biased genes (LFSR < 0.05 in at least one region) identified in our primary and cell-type corrected analyses. Motifs are listed on the y axis (PR, progesterone; ER⍺, estrogen alpha; AR, androgen) and −log10(p values) from hypergeometric enrichments are on the x axis.
Figure 5
Figure 5
Sex-biased genes in macaque and human brains are enriched for similar ASD-related gene sets Enrichment results (odds ratios [ORs] from Fisher’s exact tests) linking ASD-related gene sets to sex-biased genes in human and macaque brains. ASD risk genes are from the DISEASES database (DOID: 12849); ASD down- and upregulated gene sets are from Gandal and colleagues, Voineagu and colleagues, or Gupta and colleagues. Dashed line represents OR = 1. ∗p < 0.05. For visualization purposes, we limited the y axis to a maximum OR of 10.
Figure 6
Figure 6
Sex-prediction modeling highlights age effects and similarities between macaque and human brains (A) Boxplots of prediction probabilities of the known sex per individual (from models of non-Y chromosome genes). Top = higher probability of being female. Bottom = higher probability of being male. Dots indicate values for individual samples. Purple boxes = female, yellow boxes = male, black dots = correctly classified samples, red dots = incorrectly classified samples (prediction probability of correct sex < 0.5). Boxplots indicate the median (black horizontal line), first and third quartiles IQR (lower and upper hinges), and ranges extending from each to 1.5 × IQR beyond each hinge (whiskers). (B) Prediction probability (averaged across regions) of known sex per individual as a function of age (years) for females (purple) and males (yellow) from models of autosomal genes only. (C) Boxplots of pairwise Euclidean distances of residual expression (for genes that are informative in any autosomal sex prediction modal, n = 718). Old M/F, males/females > 8 years old; Young M/F, males/females < 8 years old. All differences were significant except young males vs. old females, Tukey’s HSD padj < 0.05. (D) Relative importance of X chromosome genes for sex prediction in X chromosome gene models (summed across regions) in the current study and Oliva and colleagues (ρ = 0.222, p = 0.006).
Figure 7
Figure 7
Evolutionary characteristics of sex-biased gene expression in macaque brains (A) Tissue specificity as a function of the absolute difference in mean residual expression per gene (averaged across regions) (n = 12,663 non-Y chromosome genes) (ρ = 0.332; p < 2.2e−16). (B) Genetic variance (log) as a function of the absolute difference in mean residual expression per gene and region (n = 152,431 non-Y chromosome gene × region combinations) (upper distribution, ρ = 0.234, p < 2.2e−16; lower distribution, ρ = 0.290, p < 2.2e−16). (C) Loss-of-function (LOF) tolerance as a function of the absolute difference in mean residual expression per gene (averaged across regions) (n = 7,786 non-Y chromosome one-to-one orthologs in the LOFtools database) (ρ = 0.006, p = 0.622).

Similar articles

Cited by

References

    1. Eid R.S., Gobinath A.R., Galea L.A.M. Sex differences in depression: Insights from clinical and preclinical studies. Prog. Neurobiol. 2019;176:86–102. doi: 10.1016/j.pneurobio.2019.01.006. - DOI - PubMed
    1. Hebert L.E., Weuve J., Scherr P.A., Evans D.A. Alzheimer disease in the United States (2010-2050) estimated using the 2010 census. Neurology. 2013;80:1778–1783. doi: 10.1212/WNL.0b013e31828726f5. - DOI - PMC - PubMed
    1. Bálint S., Czobor P., Komlósi S., Mészáros A., Simon V., Bitter I. Attention deficit hyperactivity disorder (ADHD): gender-and age-related differences in neurocognition. Psychol. Med. 2009;39:1337–1345. doi: 10.1017/S0033291708004236. - DOI - PubMed
    1. Ferri S.L., Abel T., Brodkin E.S. Sex differences in autism spectrum disorder: A review. Curr. Psychiatry Rep. 2018;20:9. doi: 10.1007/s11920-018-0874-2. - DOI - PMC - PubMed
    1. Wooten G.F., Currie L.J., Bovbjerg V.E., Lee J.K., Patrie J. Are men at greater risk for Parkinson’s disease than women? J. Neurol. Neurosurg. Psychiatry. 2004;75:637–639. doi: 10.1136/jnnp.2003.020982. - DOI - PMC - PubMed