

Extreme overall mushroom genome expansion in Mycena s.s. irrespective of plant hosts or substrate specializations
- PMID: 38942024
- PMCID: PMC11293592
- DOI: 10.1016/j.xgen.2024.100586
Extreme overall mushroom genome expansion in Mycena s.s. irrespective of plant hosts or substrate specializations
Abstract
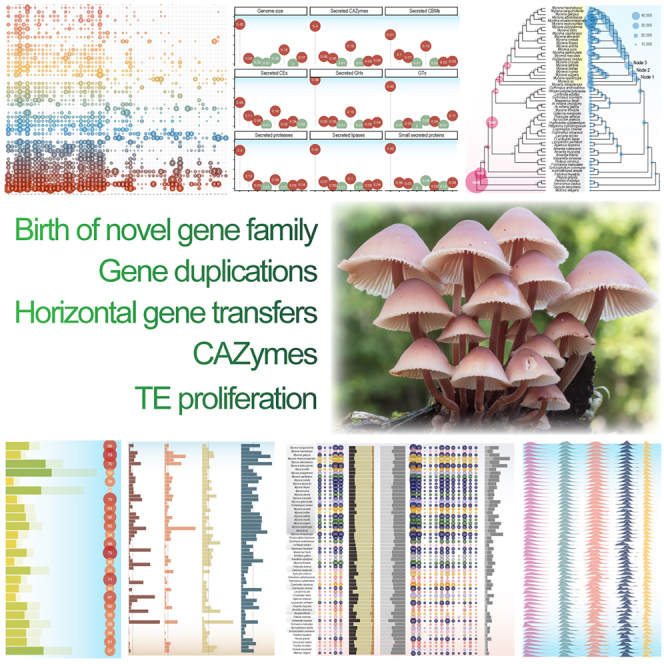
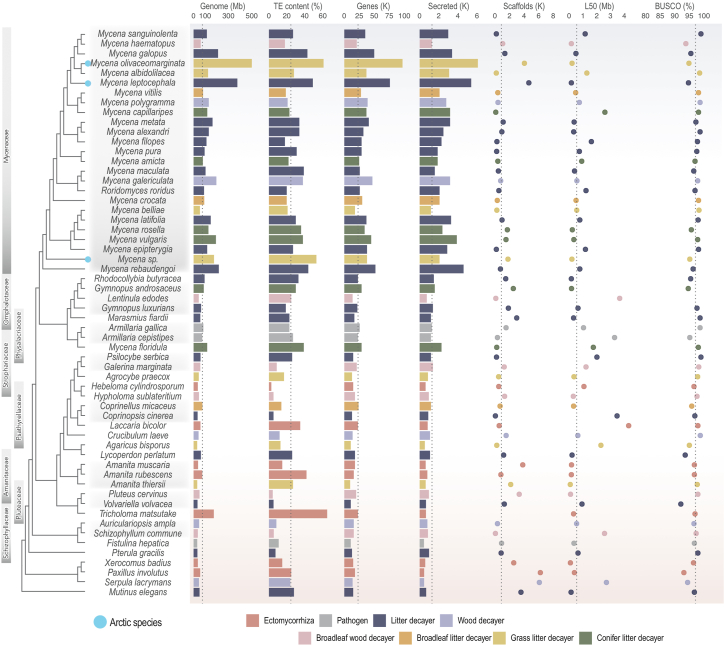
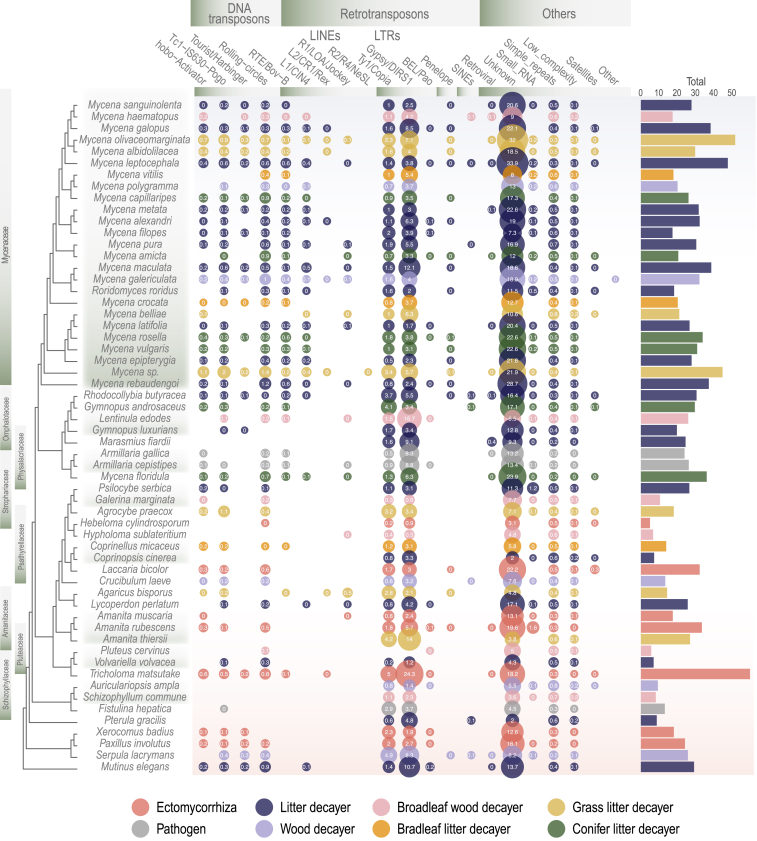
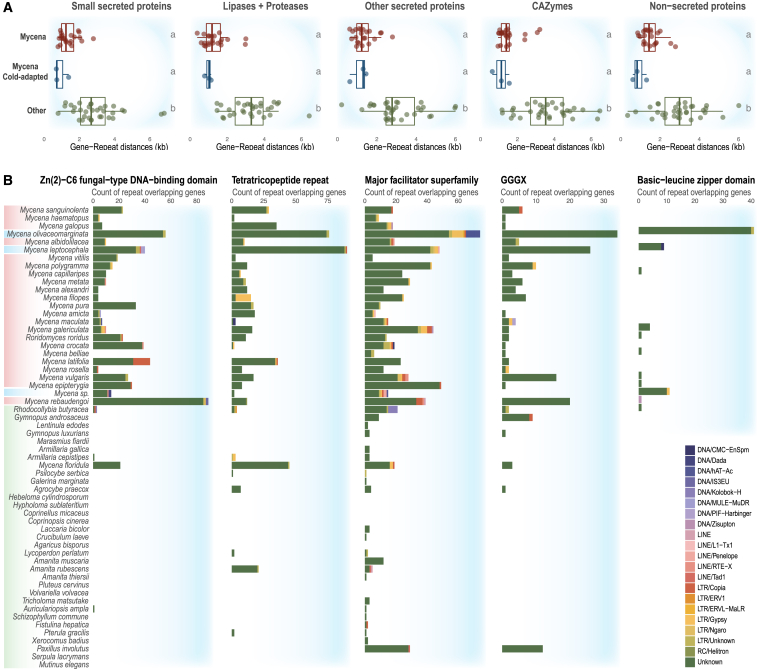
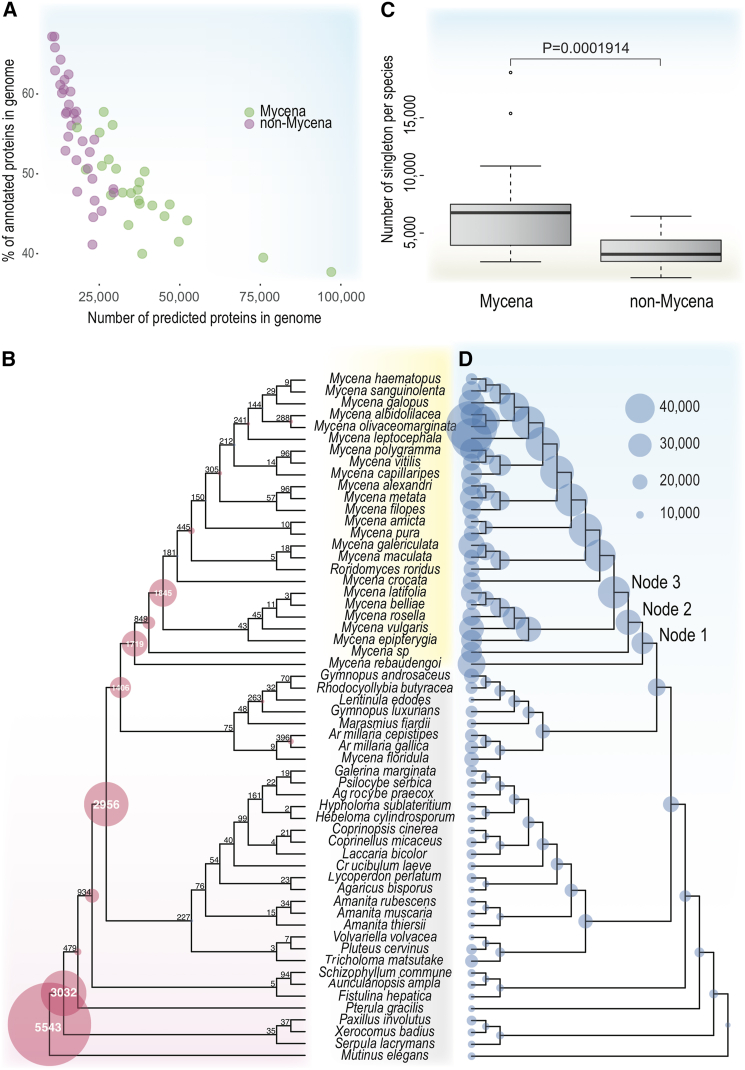
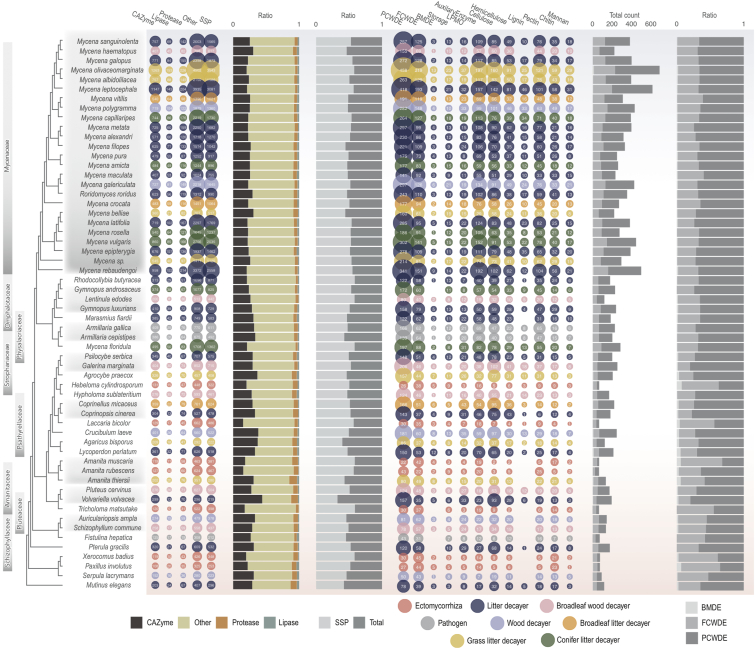
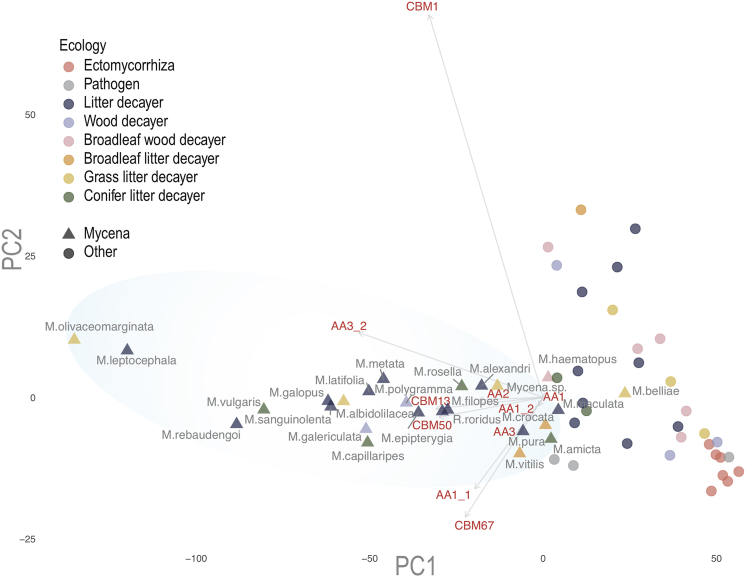
Mycena s.s. is a ubiquitous mushroom genus whose members degrade multiple dead plant substrates and opportunistically invade living plant roots. Having sequenced the nuclear genomes of 24 Mycena species, we find them to defy the expected patterns for fungi based on both their traditionally perceived saprotrophic ecology and substrate specializations. Mycena displayed massive genome expansions overall affecting all gene families, driven by novel gene family emergence, gene duplications, enlarged secretomes encoding polysaccharide degradation enzymes, transposable element (TE) proliferation, and horizontal gene transfers. Mainly due to TE proliferation, Arctic Mycena species display genomes of up to 502 Mbp (2-8× the temperate Mycena), the largest among mushroom-forming Agaricomycetes, indicating a possible evolutionary convergence to genomic expansions sometimes seen in Arctic plants. Overall, Mycena show highly unusual, varied mosaic-like genomic structures adaptable to multiple lifestyles, providing genomic illustration for the growing realization that fungal niche adaptations can be far more fluid than traditionally believed.
Keywords: Arctic biology; TE proliferation; biotrophy–saprotrophy evolution; carbon degradation; fungal genomics; fungal guild; genome size diversity; plant-fungus interactions; root-associations; saprotrophs.
Copyright © 2024 The Authors. Published by Elsevier Inc. All rights reserved.
Conflict of interest statement
Declaration of interests The authors declare no competing interests.
Figures
Similar articles
-
Mycena species can be opportunist-generalist plant root invaders.Environ Microbiol. 2023 Oct;25(10):1875-1893. doi: 10.1111/1462-2920.16398. Epub 2023 May 15. Environ Microbiol. 2023. PMID: 37188366
-
In vitro evidence of root colonization suggests ecological versatility in the genus Mycena.New Phytol. 2020 Jul;227(2):601-612. doi: 10.1111/nph.16545. Epub 2020 Apr 13. New Phytol. 2020. PMID: 32171021
-
Mycena genomes resolve the evolution of fungal bioluminescence.Proc Natl Acad Sci U S A. 2020 Dec 8;117(49):31267-31277. doi: 10.1073/pnas.2010761117. Epub 2020 Nov 23. Proc Natl Acad Sci U S A. 2020. PMID: 33229585 Free PMC article.
-
Starships: a new frontier for fungal biology.Trends Genet. 2024 Dec;40(12):1060-1073. doi: 10.1016/j.tig.2024.08.006. Epub 2024 Sep 18. Trends Genet. 2024. PMID: 39299886 Review.
-
Biology, dynamics, and applications of transposable elements in basidiomycete fungi.Appl Microbiol Biotechnol. 2017 Feb;101(4):1337-1350. doi: 10.1007/s00253-017-8097-8. Epub 2017 Jan 10. Appl Microbiol Biotechnol. 2017. PMID: 28074220 Review.
References
-
- Eastwood D.C., Floudas D., Binder M., Majcherczyk A., Schneider P., Aerts A., Asiegbu F.O., Baker S.E., Barry K., Bendiksby M., et al. The Plant Cell Wall-Decomposing Machinery Underlies the Functional Diversity of Forest Fungi. Science. 2011;333:762–765. doi: 10.1126/science.1205411. - DOI - PubMed
-
- Floudas D., Binder M., Riley R., Barry K., Blanchette R.A., Henrissat B., Martínez A.T., Otillar R., Spatafora J.W., Yadav J.S., et al. The Paleozoic origin of enzymatic lignin decomposition reconstructed from 31 fungal genomes. Science. 2012;336:1715–1719. doi: 10.1126/science.1221748. - DOI - PubMed
-
- Lebreton A., Zeng Q., Miyauchi S., Kohler A., Dai Y.C., Martin F.M. Evolution of the mode of nutrition in symbiotic and saprotrophic fungi in forest ecosystems. Annu. Rev. Ecol. Evol. Syst. 2021;52:385–404. doi: 10.1146/annurev-ecolsys-012021-. - DOI
MeSH terms
Substances
LinkOut - more resources
Full Text Sources
Miscellaneous
