

National, regional, and global trends in insufficient physical activity among adults from 2000 to 2022: a pooled analysis of 507 population-based surveys with 5·7 million participants
- PMID: 38942042
- PMCID: PMC11254784
- DOI: 10.1016/S2214-109X(24)00150-5
National, regional, and global trends in insufficient physical activity among adults from 2000 to 2022: a pooled analysis of 507 population-based surveys with 5·7 million participants
Erratum in
-
Correction to Lancet Glob Health 2024; 12: e1232-43.Lancet Glob Health. 2025 Feb;13(2):e202. doi: 10.1016/S2214-109X(24)00533-3. Epub 2024 Dec 6. Lancet Glob Health. 2025. PMID: 39653055 Free PMC article. No abstract available.
Abstract
Background: Insufficient physical activity increases the risk of non-communicable diseases, poor physical and cognitive function, weight gain, and mental ill-health. Global prevalence of adult insufficient physical activity was last published for 2016, with limited trend data. We aimed to estimate the prevalence of insufficient physical activity for 197 countries and territories, from 2000 to 2022.
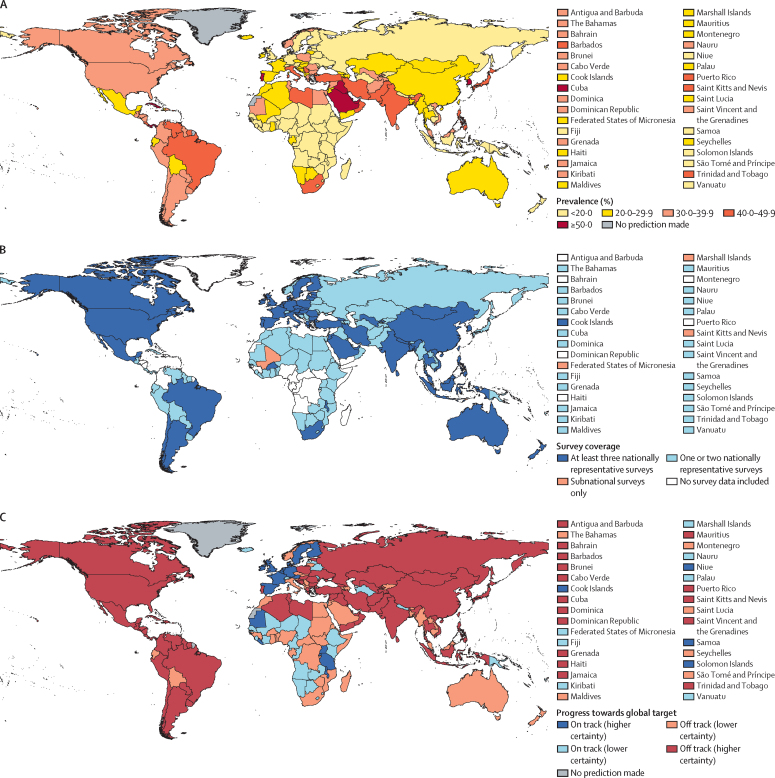
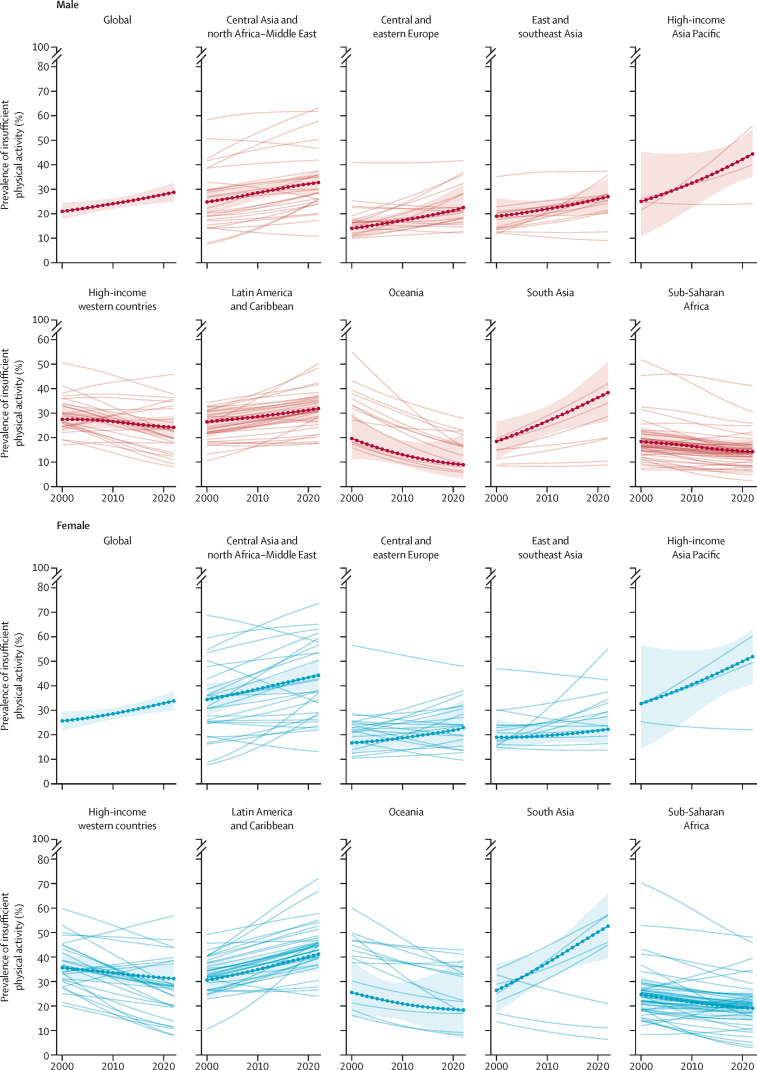
Methods: We collated physical activity reported by adults (aged ≥18 years) in population-based surveys. Insufficient physical activity was defined as not doing 150 minutes of moderate-intensity activity, 75 minutes of vigorous-intensity activity, or an equivalent combination per week. We used a Bayesian hierarchical model to compute estimates of insufficient physical activity by country or territory, year, age, and sex. We assessed whether countries or territories, regions, and the world would meet the global target of a 15% relative reduction of the prevalence of insufficient physical activity by 2030 if 2010-22 trends continue.
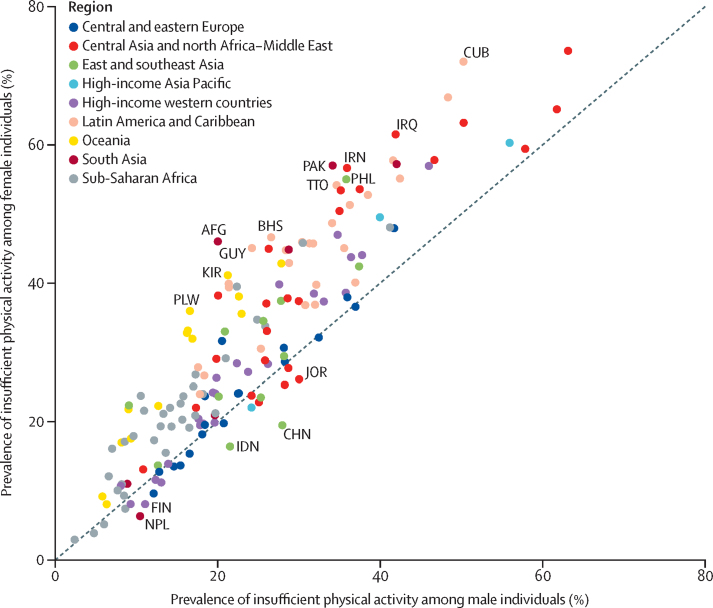
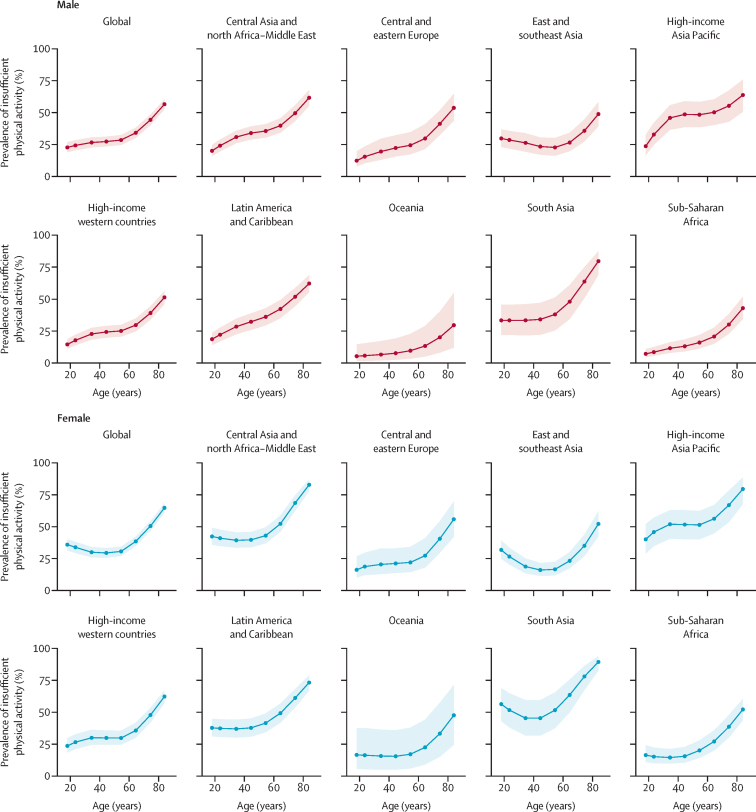
Findings: We included 507 surveys across 163 countries and territories. The global age-standardised prevalence of insufficient physical activity was 31·3% (95% uncertainty interval 28·6-34·0) in 2022, an increase from 23·4% (21·1-26·0) in 2000 and 26·4% (24·8-27·9) in 2010. Prevalence was increasing in 103 (52%) of 197 countries and territories and six (67%) of nine regions, and was declining in the remainder. Prevalence was 5 percentage points higher among female (33·8% [29·9-37·7]) than male (28·7% [25·0-32·6]) individuals. Insufficient physical activity increased in people aged 60 years and older in all regions and both sexes, but age patterns differed for those younger than 60 years. If 2010-22 trends continue, the global target of a 15% relative reduction between 2010 and 2030 will not be met (posterior probability <0·01); however, two regions, Oceania and sub-Saharan Africa, were on track with considerable uncertainty (posterior probabilities 0·70-0·74).
Interpretation: Concerted multi-sectoral efforts to reduce insufficient physical activity levels are needed to meet the 2030 target. Physical activity promotion should not exacerbate sex, age, or geographical inequalities.
Funding: Ministry of Public Health, Qatar, and World Health Organization.
Translations: For the Spanish and Portuguese translations of the abstract see Supplementary Materials section.
Copyright © 2024. World Health Organization. Published by Elsevier Ltd. All rights reserved. This is an Open Access article published under the CC BY 3.0 IGO license which permits unrestricted use, distribution, and reproduction in any medium, provided the original work is properly cited. In any use of this Article, there should be no suggestion that WHO endorses any specific organisation, products or services. The use of the WHO logo is not permitted. This notice should be preserved along with the Article's original URL.
Conflict of interest statement
Declaration of interests TS, SF, ES, and GAS report consulting contracts from WHO supporting this work. TS declares expenses paid to speak at an event organised by Biogredia AB in January, 2023.
Figures
References
-
- US Department of Health and Human Services 2018 Physical Activity Guidelines Advisory Committee. 2018. https://health.gov/sites/default/files/2019-09/PAG_Advisory_Committee_Re...
-
- WHO Seventy-first World Health Assembly A71/18. Physical Activity for Health. 2018. https://apps.who.int/gb/ebwha/pdf_files/WHA71/A71_18-en.pdf
-
- WHO More active people for a healthier world. Global Action Plan on Physical Activity 2018–2030. 2018. https://apps.who.int/iris/bitstream/handle/10665/272722/9789241514187-en...
Publication types
MeSH terms
Grants and funding
LinkOut - more resources
Full Text Sources
Medical
Miscellaneous
