. 2024 Aug;21(8):918-931.
doi: 10.1038/s41423-024-01195-1. Epub 2024 Jun 28.

BAG6 restricts pancreatic cancer progression by suppressing the release of IL33-presenting extracellular vesicles and the activation of mast cells

Affiliations

BAG6 restricts pancreatic cancer progression by suppressing the release of IL33-presenting extracellular vesicles and the activation of mast cells

Bilal Alashkar Alhamwe et al. Cell Mol Immunol. 2024 Aug.

Abstract

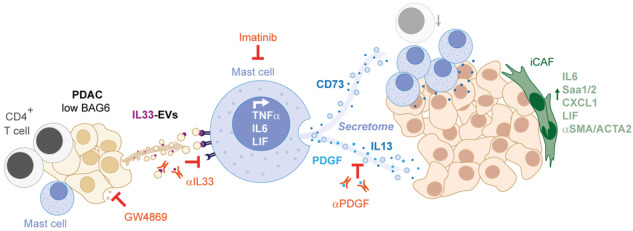
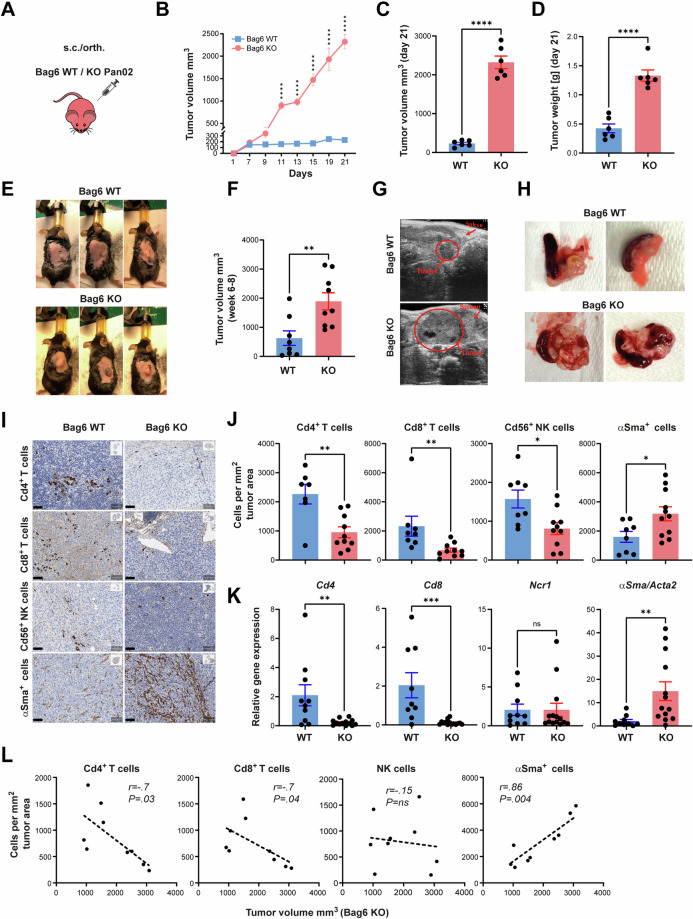
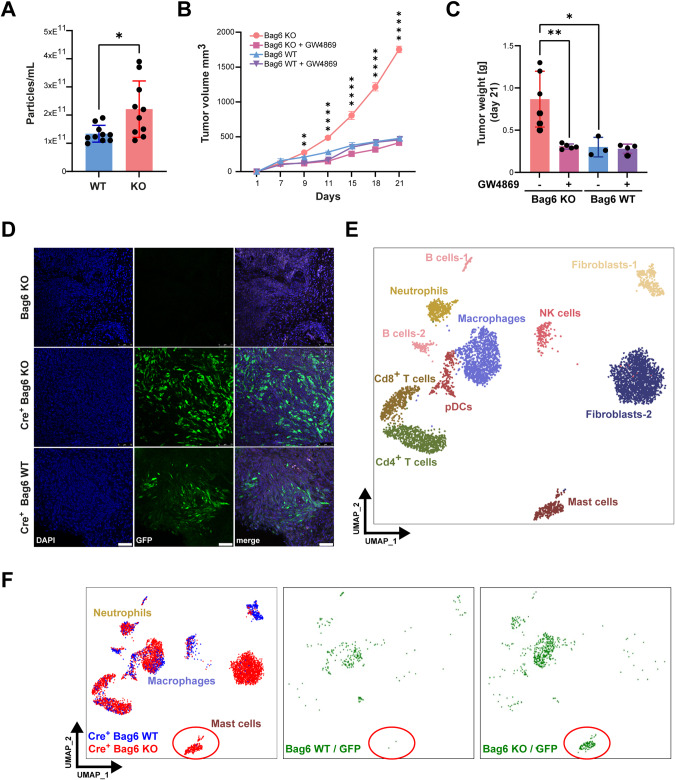
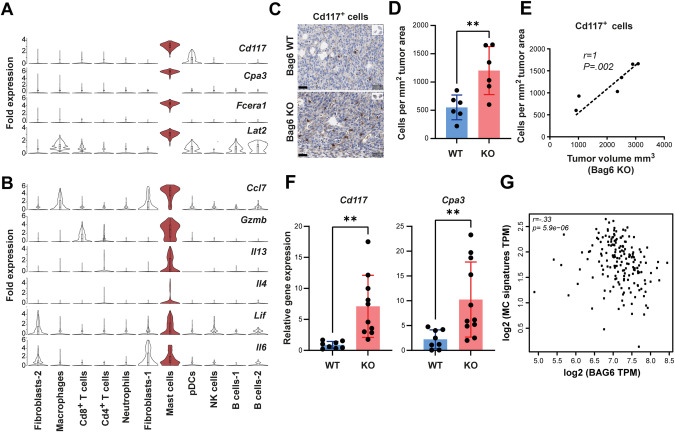
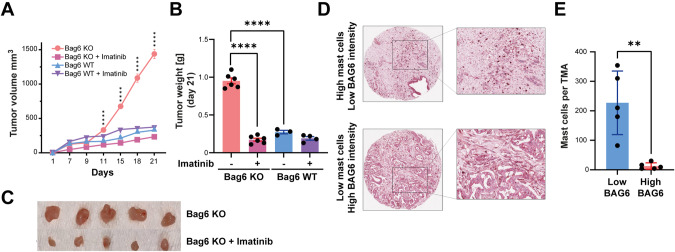
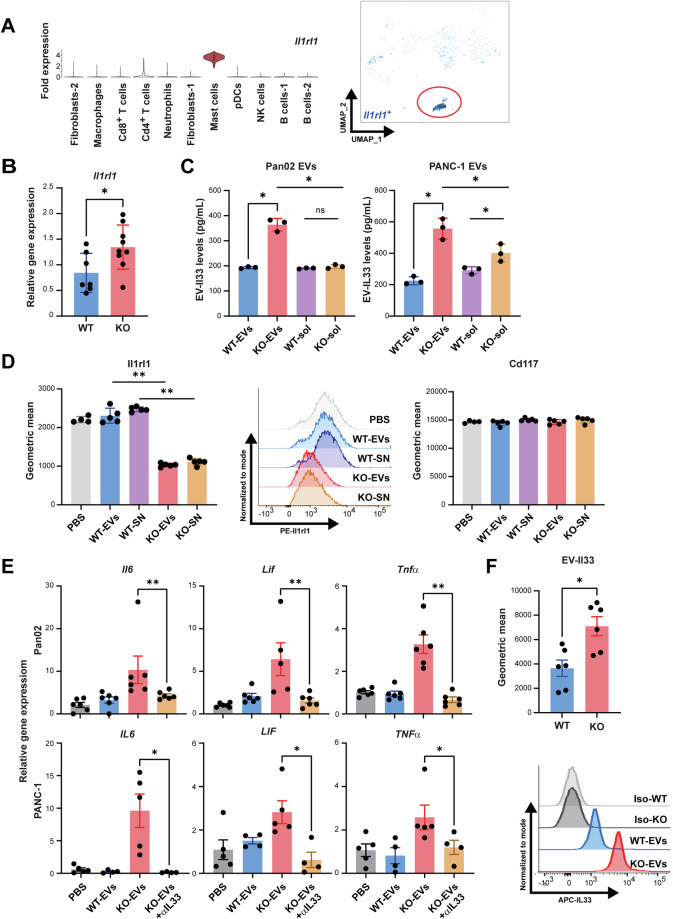
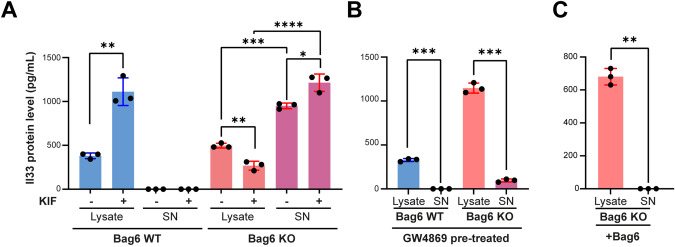
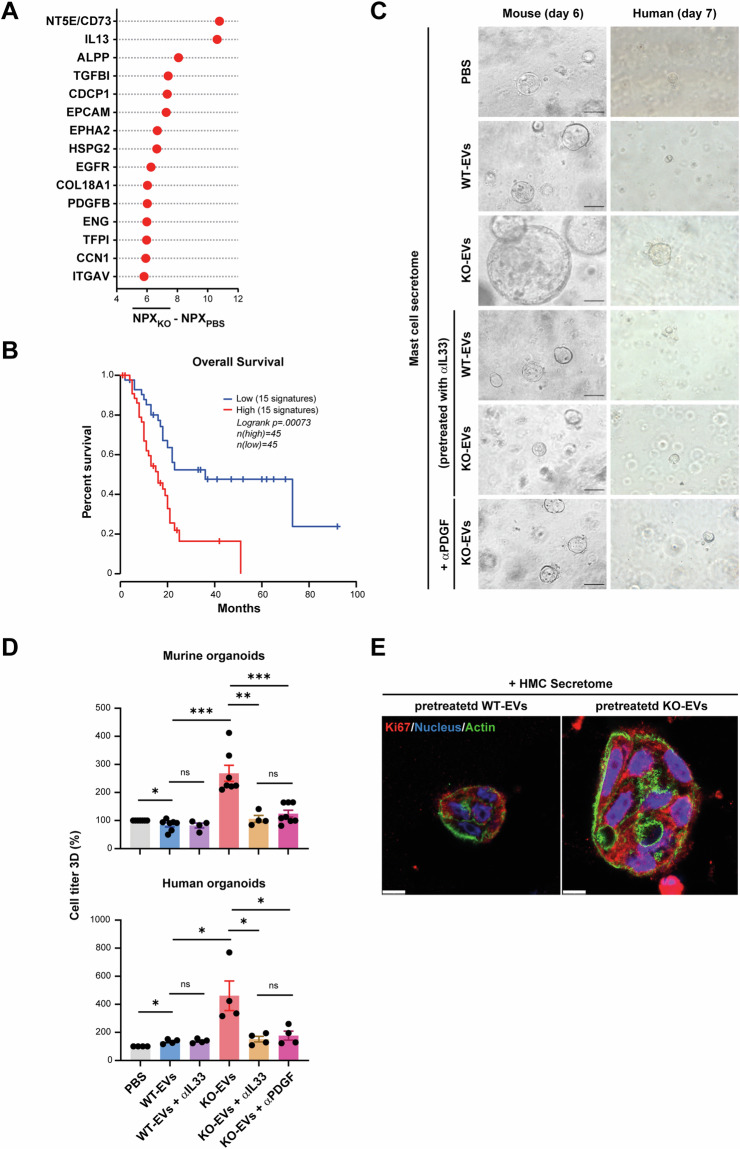
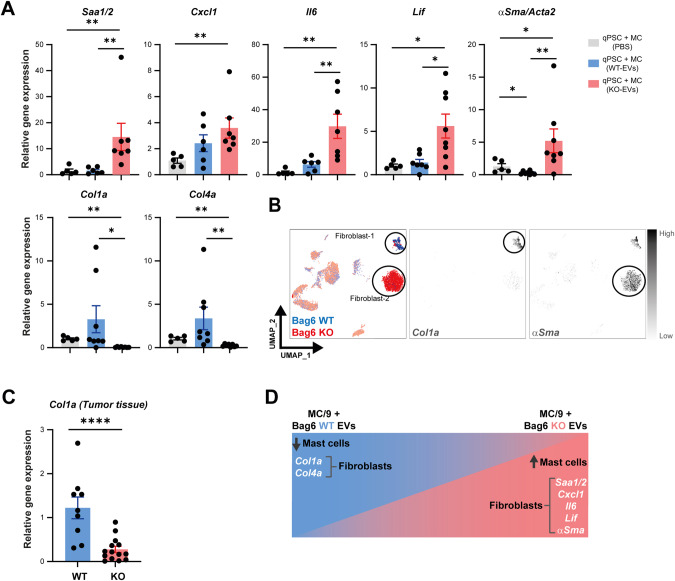
Recent studies reveal a critical role of tumor cell-released extracellular vesicles (EVs) in pancreatic cancer (PC) progression. However, driver genes that direct EV function, the EV-recipient cells, and their cellular response to EV uptake remain to be identified. Therefore, we studied the role of Bcl-2-associated-anthanogene 6 (BAG6), a regulator of EV biogenesis for cancer progression. We used a Cre recombinase/LoxP-based reporter system in combination with single-cell RNA sequencing to monitor in vivo EV uptake and tumor microenvironment (TME) changes in mouse models for pancreatic ductal adenocarcinoma (PDAC) in a Bag6 pro- or deficient background. In vivo data were validated using mouse and human organoids and patient samples. Our data demonstrated that Bag6-deficient subcutaneous and orthotopic PDAC tumors accelerated tumor growth dependent on EV release. Mechanistically, this was attributed to mast cell (MC) activation via EV-associated IL33. Activated MCs promoted tumor cell proliferation and altered the composition of the TME affecting fibroblast polarization and immune cell infiltration. Tumor cell proliferation and fibroblast polarization were mediated via the MC secretome containing high levels of PDGF and CD73. Patients with high BAG6 gene expression and high protein plasma level have a longer overall survival indicating clinical relevance. The current study revealed a so far unknown tumor-suppressing activity of BAG6 in PDAC. Bag6-deficiency allowed the release of EV-associated IL33 which modulate the TME via MC activation promoting aggressive tumor growth. MC depletion using imatinib diminished tumor growth providing a scientific rationale to consider imatinib for patients stratified with low BAG6 expression and high MC infiltration. EVs derived from BAG6-deficient pancreatic cancer cells induce MC activation via IL33/Il1rl1. The secretome of activated MCs induces tumor proliferation and changes in the TME, particularly shifting fibroblasts into an inflammatory cancer-associated fibroblast (iCAF) phenotype. Blocking EVs or depleting MCs restricts tumor growth.

Keywords: BAG6; EVs; Mast cells; Pancreatic cancer.


Conflict of interest statement

The authors declare no competing interests.

Figures

None
EVs derived from BAG6-deficient pancreatic cancer cells induce MC activation via IL33/Il1rl1. The secretome of activated MCs induces tumor proliferation and changes in the TME, particularly shifting fibroblasts into an inflammatory cancer-associated fibroblast (iCAF) phenotype. Blocking EVs or depleting MCs restricts tumor growth.
Fig. 1
Fig. 1
Loss of Bag6 accelerated pancreatic tumor growth and altered the TME in mouse models. A Reporter mice were s.c or orth. transplanted with WT or KO Pan02 cells. B Tumor growth of s.c. tumors. C Tumor volume at day 21. D Tumor weight (mean ± SEM, n = 6). E Representative images of s.c. tumors in each group. F Tumor volume in orth. model (mean ± SEM, n = 8–9). G, H Representative images of orth. tumor growth measured via ultrasound. I Representative images of immune marker expression in tumor tissue. J Immune cells counted per square millimeter of tumor area (mean ± SEM, n = 7–10). K Relative gene expression of immune markers normalized to Rpl32 in tumor tissue from WT and KO tumors (mean ± SEM, n = 8–14). L Scatter plot between tumor volume in the KO group and cell types as indicated (n = 9), nonparametric Spearman correlation test. Statistical significance: (B) two-way ANOVA followed by Bonferroni corrections for multiple comparisons test; ((C), (D), (F), (I), (J)) unpaired Mann–Whitney U test; *P < 0.05; **P < 0.01; ***P < 0.001; ****P < 0.0001; n.s. (not significant)
Fig. 2
Fig. 2
Monitoring of EV uptake in vivo via Cre-LoxP and single-cell sequencing. A Quantification of particles isolated from the supernatant (SN) of WT/KO Pan02 cells (mean ± SEM, n = 10). B, C s.c. tumor growth and weight of Bag6 WT/KO groups upon treatment with GW4869 (n = 3–6). D Confocal images of tumor tissues. GFP+ cells correspond to cre recombination events and cre-negative Bag6 KO tumors were used as negative control. E UMAP depiction of cell characterization based on cell markers. F UMAP projections of cre+ KO (red, left panel) and cre+ WT tumors (blue, left panel). Recombination events in WT (middle) and KO (right) are highlighted in green. Statistical significance: (A, C) unpaired Mann-Whitney U test; (B) or two-way ANOVA followed by Bonferroni corrections for multiple comparisons test; *P < .05; **P < 0.01; ***P < 0.001; ****P < 0.0001; n.s. (not significant); UMAP Uniform Manifold Approximation and Projection
Fig. 3
Fig. 3
KO tumors were infiltrated by activated MCs. A, B Violin plots depicting MC markers and cytokines produced by activated MCs in KO tumor tissue. C Representative Cd117+ cells immunohistochemistry staining in tumor tissue of WT/KO groups. D Absolute Cd117+ cell counts per square millimeter (mean ± SEM, n = 6). E Spearman correlation analysis between tumor size and Cd117+ cell expression in the KO tumor tissue (mean ± SEM, n = 6). F Relative gene expression of MC markers (Cd117 and Cpa3) in WT/KO tumor tissue normalized to Rpl32 (mean ± SEM, n = 8–11). G Spearman correlation analysis between MC signature gene expression (CD117, FCERA1, and CPA3) and BAG6 in PDAC tumors (GEPIA2 analysis 28). Statistical significance: (D, F) unpaired Mann–Whitney U test; *P < 0.05; **P < 0.01
Fig. 4
Fig. 4
MC depletion reduced tumor growth. A Tumor growth curves of Bag6 WT/KO tumors (s.c.) treated twice weekly with imatinib or DMSO control, presented as volume. B Tumor weight (mean ± SEM, n = 3–6 mice). C Representative images of resected tumors from imatinib- and DMSO-treated animals. D Representative MC and BAG6 immunohistochemistry staining of Tissue Microarrays (TMAs). E Quantification of CD117+ cells in BAG6 high and low samples (mean ± SEM, n = 5). Statistical significance: (A) two-way ANOVA followed by Bonferroni corrections for multiple comparisons test; (B, E) unpaired Mann–Whitney U test; *P < 0.05; **P < 0.01; ***P < 0.001; ****P < 0.0001; n.s. (not significant)
Fig. 5
Fig. 5
EV-associated IL33 induced MC activation. A Violin plots and UMAP depiction of Il1rl1 (Il33 receptor) expression in KO tumors. Expression of Il1rl1 was low on Treg cells and similar between KO and WT (Fig. S5D). Surface expression of Il1rl1 measured using flow cytometry was detectable on MC/9 cells but absent on WT and KO Pan02 cells (Fig. S5E). B RT-qPCR of Il1rl1 gene expression in tumor tissue normalized to Rpl32 (mean ± SEM, n = 7–9). C ELISA to detect mouse and human IL33 in EVs and EV purified soluble fractions (-sol) from WT and KO PDAC cells (mean ± SEM, n = 3). D Murine MCs pre-treated with EVs or crude supernatant (SN) from KO and WT Pan02 cells were analyzed for Ilrl1(IL33 receptor) expression. Cd117 expression was used as a control (mean ± SEM, n = 4–5). E Cytokine gene expression analysis of mouse and human MCs stimulated with KO- or WT-EVs isolated from Pan02 and PANC-1 cells, respectively. Data were normalized to Rpl32 (mean ± SEM, n = 4–6, 2 independent experiments). F Microbead assay to measure Il33 expression on WT-/KO-EVs from Pan02 cells (mean ± SEM, n = 6). Statistical significance: (AF) unpaired Mann–Whitney U test t-test; *P < 0.05; **P < 0.01
Fig. 6
Fig. 6
Bag6-mediated regulation of Il33 protein level and release. A, B ELISA to detect IL33 in cell lysate or supernatant (SN) of WT/KO Pan02 cells pretreated with or without Kifunensine (KIF) (150 µM) in (A) or with GW4869 (20 µM) in (B). Treatment was performed for 24 h followed by replacement of medium and 24 h incubation (n = 3 ± SEM). C ELISA to detect IL33 in cell lysate and SN after rescue of the Bag6 expression in Bag6 KO Pan02 cells (n = 3 ± SEM). Statistical significance: (AC) unpaired t-test; *P < 0.05; **P < 0.01; ***P < 0.001; ****P < 0.0001
Fig. 7
Fig. 7
The secretome of MCs activated with KO-EVs promoted tumor growth. A The top 15 upregulated proteins in the secretome of human MCs pre-treated with PANC-1 KO-EVs (n = 2) are depicted. Normalized protein expression values (NPX) were averaged and the effect size calculated as compared to a PBS control is indicated (full protein list in Supplementary Table S1 and Fig. S6D for the global distribution of the effect size for the 15 upregulated proteins). B Kaplan Meier analysis of the top 15 upregulated proteins correlated with survival (TCGA data via GEPIA2). C Representative images of KPC mouse and PDAC human organoids after treatment with MC secretome from mouse/human MCs that were pre-treated with WT- or KO-EVs from Pan02 or PANC1, respectively as well αIL33 and αPDGF as indicated. D Quantification of organoid sizes determined via cell titer (mean ± SEM, n = 4–6). E The organoids were stained with anti-Ki67 antibodies (red), with Hoechst 33342 (nuclei, blue) and Alexa 546 phalloidin (actin, green) to visualize cellular structures. Scale bars: 10 µm. Statistical significance: (D) unpaired Mann–Whitney U test; *P < 0.05; **P < 0.01; ***P < 0.001
Fig. 8
Fig. 8
The secretome from activated MCs induced an iCAF phenotype. A mPSCs were treated with MC secretome of MCs pre-treated with WT- or KO-EVs. Gene expression of iCAF markers and mCAF markers was determined by RT-qPCrR. (mean ± SEM, n = 6). B UMAP projection of fibroblast markers Col1a and aSMA in WT/KO tumors. C Col1a expression in KO and WT tumors determined by RT-qPCR. Data were normalized to Rpl32 (mean ± SEM, n = 9–14). D Graphical summary of mPSC/fibroblast phenotypes in vivo or after MC secretome treatment. Statistical significance: unpaired Mann–Whitney U test; *P < 0.05; **P < 0.01, ***P < 0.001, ****P < 0.0001

References

    1. Rahib L, Wehner MR, Matrisian LM, Nead KT. Estimated projection of US cancer incidence and death to 2040. JAMA Netw Open. 2021;4:e214708. - PMC - PubMed
    1. Hernandez-Barranco A, Nogues L, Peinado H. Could extracellular vesicles contribute to generation or awakening of “sleepy” metastatic niches? Front Cell Dev Biol. 2021;9:625221. - PMC - PubMed
    1. Kalluri R, McAndrews KM. The role of extracellular vesicles in cancer. Cell. 2023;186:1610–26. - PMC - PubMed
    1. Xie Z, Gao Y, Ho C, Li L, Jin C, Wang X, et al. Exosome-delivered CD44v6/C1QBP complex drives pancreatic cancer liver metastasis by promoting fibrotic liver microenvironment. Gut. 2022;71:568–79. - PubMed
    1. Hoshino A, Costa-Silva B, Shen TL, Rodrigues G, Hashimoto A, Tesic Mark M, et al. Tumour exosome integrins determine organotropic metastasis. Nature. 2015;527:329–35. - PMC - PubMed