. 2024 Jun 28;14(1):14964.
doi: 10.1038/s41598-024-65592-2.

The role of Mce proteins in Mycobacterium avium paratuberculosis infection

Affiliations

The role of Mce proteins in Mycobacterium avium paratuberculosis infection

Rosemary Blake et al. Sci Rep. .

Abstract

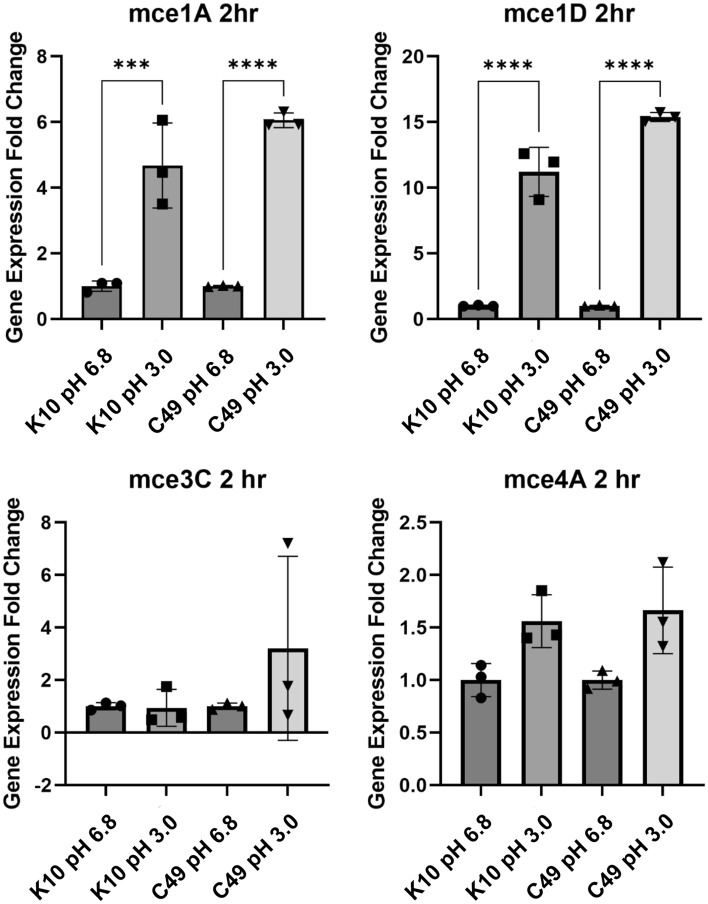
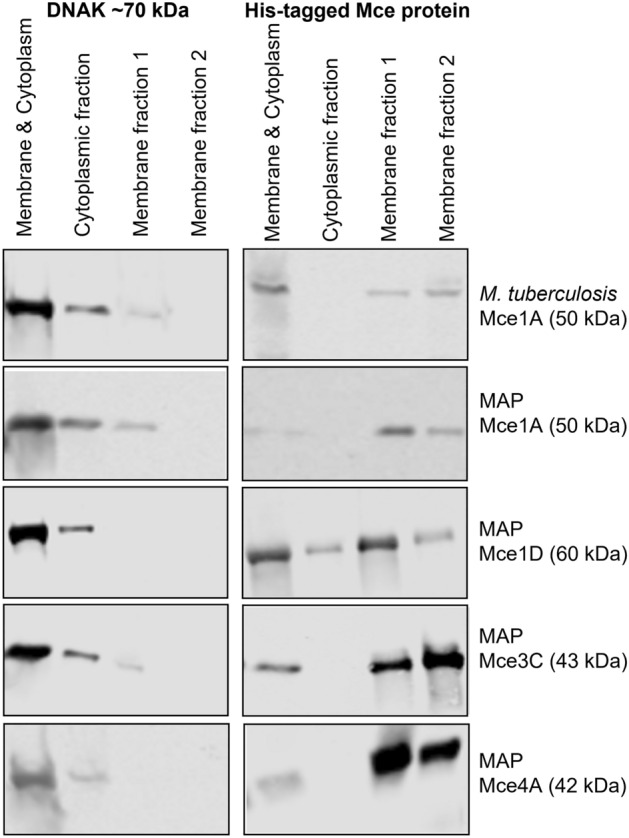
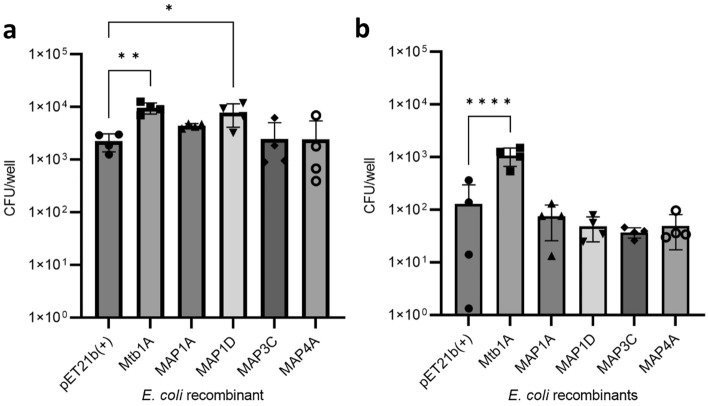
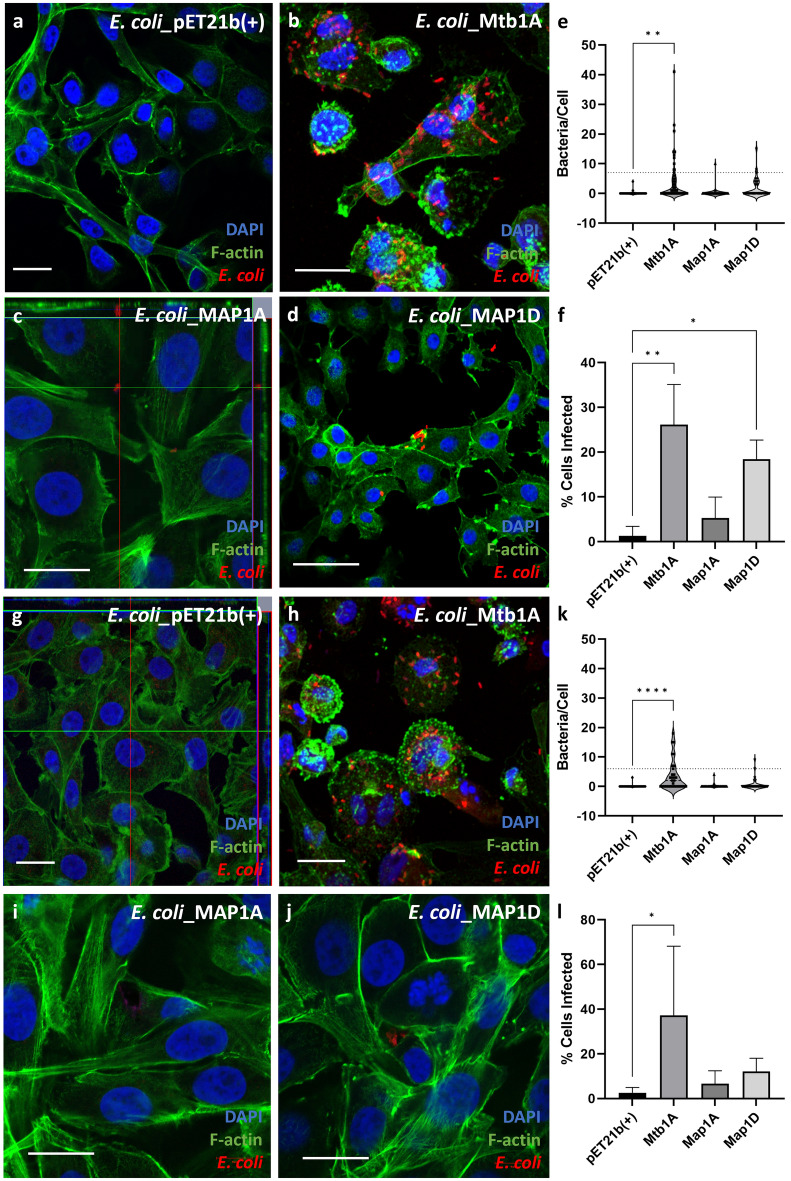
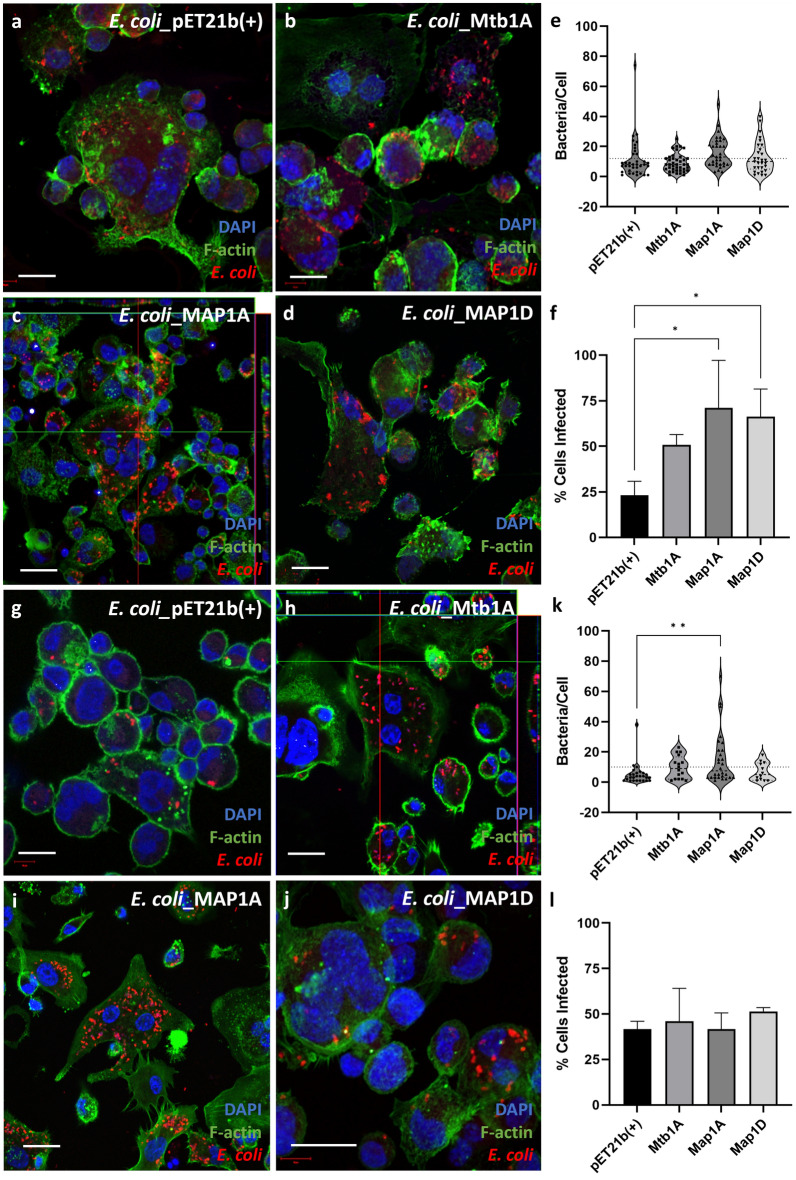
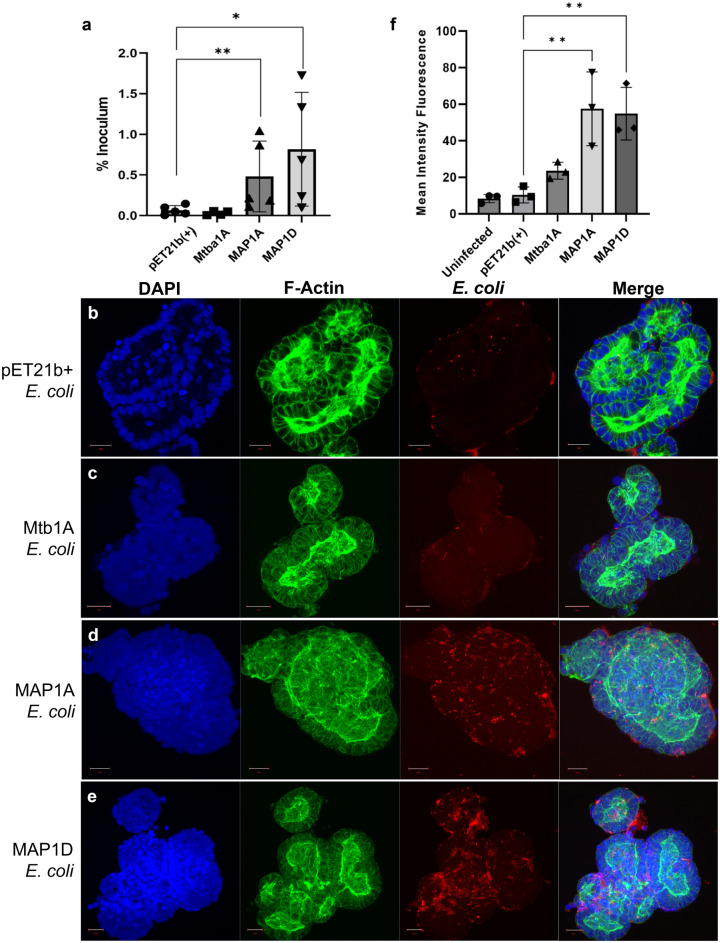
Mycobacterium avium subspecies paratuberculosis (MAP) is the causative agent of Johne's Disease, a chronic granulomatous enteritis of ruminants. MAP establishes an infection in the host via the small intestine. This requires the bacterium to adhere to, and be internalised by, cells of the intestinal tract. The effector molecules expressed by MAP for this purpose remain to be fully identified and understood. Mammalian cell entry (mce) proteins have been shown to enable other Mycobacterial species to attach to and invade host epithelial cells. Here, we have expressed Mce1A, Mce1D, Mce3C and Mce4A proteins derived from MAP on the surface of a non-invasive Escherichia coli to characterise their role in the initial interaction between MAP and the host. To this end, expression of mce1A was found to significantly increase the ability of the E. coli to attach and survive intracellularly in human monocyte-like THP-1 cells, whereas expression of mce1D was found to significantly increase attachment and invasion of E. coli to bovine epithelial cell-like MDBK cells, implying cell-type specificity. Furthermore, expression of Mce1A and Mce1D on the surface of a previously non-invasive E. coli enhanced the ability of the bacterium to infect 3D bovine basal-out enteroids. Together, our data contributes to our understanding of the effector molecules utilised by MAP in the initial interaction with the host, and may provide potential targets for therapeutic intervention.

Keywords: Mycobacterium avium ssp paratuberculosis; Enteroids; MAP; Mammalian cell entry gene; Microbial-cell interaction; Mycobacteria.


Conflict of interest statement

The authors declare no competing interests.

Figures

Figure 1
Figure 1
Regulation of MAP mce expression upon exposure to an acidic pH. The expression of mce genes was determined by RT-qPCR and calculated as fold change relative to the expression of gapdh and 1g2 as endogenous reference genes. Total RNA was isolated from 3 separate cultures of MAP K10 and C49 cultured to an OD600 0.6 and pelleted to be re-suspended in standard 7H9 medium at pH 6.8 or pH3.0 7H9 medium. Data presented as the mean of the fold change in gene expression from 3 separate cultures ± SD. Statistatical analysis performed using a one-way ANOVA followed by a post hoc Dunnett’s test. P < 0.001 = ***; P < 0.0001 = ****.
Figure 2
Figure 2
Western blot of E. coli strains expressing Mce protein after subcellular fractionation. E. coli clones were induced with 0.1 mM IPTG to produce their respective Mce protein for 2 h at 37 °C 180 rpm. The bacteria were then separated into fractions of the cell membrane and cytoplasm, the cytoplasm alone and two separate washes of the cell membrane. The fractions were separated by SDS-PAGE and electro-transferred to a nitrocellulose membrane. Rabbit monoclonal anti-His antibody was used to detect the His-tagged Mce protein to determine its location in the bacteria. Rabbit monoclonal anti-DNAK antibody was used as an E. coli cytoplasmic control. Images are cropped and each image represents an individual immunoblot. Whole gel images are found as supplementary Figures S3–S7.
Figure 3
Figure 3
Attachment and survival of E. coli recombinants in MDBK cells. Mce protein expression was induced in E. coli recombinants with 0.1 mM IPTG for 2 h at 37 °C and used to infect MDBK cells at MOI 20. Cells were washed at 1 hpi and incubated for a further 1 or 5 h. Whole cell lysates were plated for CFU analysis which did not differentiate between attached or intracellular bacteria at 2 hpi (a); and at 6 hpi (b). Error bars presented as SEM of four biological replicates each performed with three technical repeats. Statistical analysis performed as a one-way ANOVA followed by a post hoc Dunnett’s test. P < 0.05 = *; P < 0.001 = **; P < 0.0001 = ***.
Figure 4
Figure 4
Uptake and survival of recombinant E. coli by THP-1 cells. Mce protein expression was induced in E. coli recombinants 0.1 mM IPTG for 2 h at 37 °C and used to infect THP-1 cells at MOI 10. Cells were incubated with medium containing 10 µg/mL gentamicin 1 hpi and incubated for a further 1 or 5 h. Cell lysates were plated for CFU analysis at 2 hpi (n = 4) (a); and at 6 hpi (n = 3) (b). Error bars presented as SEM of the specific number of biological replicates each performed with three technical repeats. Statistical analysis performed as a one-way ANOVA followed by a post hoc Dunnett’s test. P < 0.05 = *; P < 0.001 = **;
Figure 5
Figure 5
IF staining of infected MDBK cells with recombinant E. coli. The attachment and invasion of recombinant E. coli expressing Mce protein was visualised using IF staining and confocal microscopy at 2 (ad) and 6 hpi (gj). The cells were stained for nuclei (DAPI, blue), F-actin (Phalloidin, green) and anti-E. coli antibody (red). Scale bar = 10 µm. Using images collated from 2 ≤ biological replicates, the number of bacteria present in each cell were counted at 2 and 6 hpi (e and k respectively). Each data point on the graph represents an individual cell; the dotted line represents the average number of bacteria per infected cell at each time point, 7 (e) and 6 (k) bacterium for 2 hpi and 6 hpi respectively. The total proportion of infected cells were counted from images collated from 2 ≤ biological replicates at 2 and 6 hpi (f and l respectively). The data was analysed using a one-way ANOVA and post Hoc Dunnetts test. P < 0.05 = *; P < 0.001 = **.
Figure 6
Figure 6
IF staining of infected THP-1 cells with recombinant E. coli. The attachment and invasion of recombinant E. coli expressing Mce protein was visualised using IF staining and confocal microscopy at 2 (ad) and 6 hpi (gj). The cells were stained for nuclei (DAPI, blue), F-actin (Phalloidin, green) and anti-E. coli antibody (red). Scale bar = 10 µm. Using images collated from 2 ≤ biological replicates, the number of bacteria present in each cell were counted at 2 and 6 hpi (e and k respectively). Each data point on the graph represents an individual cell; the dotted line represents the average number of bacteria per infected cell at each time point; The dotted line represents the average number of bacteria per infected cell at each time point, 12 (e) and 10 (k) bacteria for 2 hpi and 6 hpi respectively. The total proportion of infected cells were counted from images at 2 and 6 hpi (F and L respectively. The data is representative of the mean of 2 ≤ biological replicates ± SD and analysed using a one-way ANOVA and post Hoc Dunnetts test. P < 0.05 = *; P < 0.001 = **.
Figure 7
Figure 7
Infection of 3D basal-out bovine enteroids by E. coli recombinants. Mce protein expression was induced in E. coli recombinants and used to infect 3D basal-out bovine enteroids at an MOI 20 for 2 h. (a) % inoculum was calculated from the enteroid lysate CFU/well 2 hpi. Data is representative of the mean of 5 biological replicates from enteroids derived from 2 separate calves ± SD. Statistical analysis performed as a one-tailed student’s T-test compared to the empty vector control. P < 0.05 = *; P < 0.01 = **. (be) Infected enteroid samples were fixed and stained for nuclei (DAPI, blue), F-actin (Phalloidin, green) and anti-E. coli antibody (red). Figures are representative of each infection condition and are maximum intensity projections from Z-stacks. Scale bar = 20 µm. (f) Graph depicts quantification of mean intensity fluorescence of the E. coli staining normalised against the mean intensity fluorescence of F-actin staining using Fiji software. Data representative of the mean from 3 independent enteroid images per condition ± SD. Statistical analysis performed as a One-way ANOVA and post Hoc Dunnett’s test against the empty vector control (pET21b(+)). P < 0.05 = *; P < 0.01 = **.

References

    1. Larsen AB, Merkal RS, Cutlip RC. Age of cattle as related to resistance to infection with Mycobacterium paratuberculosis. Am. J. Vet. Res. 1975;36(3):255–257. - PubMed
    1. Corn JL, Manning EJB, Sreevatsan S, Fischer JR. Isolation of Mycobacterium avium subsp. paratuberculosis from free-ranging birds and mammals on livestock premises. Appl. Environ. Microbiol. 2005;71(11):6963–6967. doi: 10.1128/AEM.71.11.6963-6967.2005. - DOI - PMC - PubMed
    1. Judge J, Kyriazakis I, Greig A, Davidson RS, Hutchings MR. Routes of intraspecies transmission of Mycobacterium avium subsp. paratuberculosis in rabbits (Oryctolagus cuniculus): A field study. Appl. Environ. Microbiol. 2006;72(1):398. doi: 10.1128/AEM.72.1.398-403.2006. - DOI - PMC - PubMed
    1. Mabbott NA, Donaldson DS, Ohno H, Williams IR, Mahajan A. Microfold (M) cells: Important immunosurveillance posts in the intestinal epithelium. Mucosal Immunol. 2013;6(4):666–677. doi: 10.1038/mi.2013.30. - DOI - PMC - PubMed
    1. Hase K, Kawano K, Nochi T, Pontes GS, Fukuda S, Ebisawa M, Kadokura K, Tobe T, Fujimura Y, Kawano S, Yabashi A, Waguri S, Nakato G, Kimura S, Murakami T, Iimura M, Hamura K, Fukuoka S, Lowe AW, Itoh K, Kiyono H, Ohno H. Uptake through glycoprotein 2 of FimH(+) bacteria by M cells initiates mucosal immune response. Nature. 2009;462(7270):226–230. doi: 10.1038/nature08529. - DOI - PubMed

Substances