. 2024 Aug;43(32):2463-2474.
doi: 10.1038/s41388-024-03091-4. Epub 2024 Jun 28.

Differential transcriptional invasion signatures from patient derived organoid models define a functional prognostic tool for head and neck cancer

Affiliations

Differential transcriptional invasion signatures from patient derived organoid models define a functional prognostic tool for head and neck cancer

Peter D Haughton et al. Oncogene. 2024 Aug.

Abstract

Clinical outcome for patients suffering from HPV-negative head and neck squamous cell carcinoma (HNSCC) remains poor. This is mostly due to highly invasive tumors that cause loco-regional relapses after initial therapeutic intervention and metastatic outgrowth. The molecular pathways governing the detrimental invasive growth modes in HNSCC remain however understudied. Here, we have established HNSCC patient derived organoid (PDO) models that recapitulate 3-dimensional invasion in vitro. Single cell mRNA sequencing was applied to study the differences between non-invasive and invasive conditions, and in a collective versus single cell invading PDO model. Differential expression analysis under invasive conditions in Collagen gels reveals an overall upregulation of a YAP-centered transcriptional program, irrespective of the invasion mode. However, we find that collectively invading HNSCC PDO cells show elevated levels of YAP transcription targets when compared to single cell invasion. Also, collectively invading cells are characterized by increased nuclear translocation of YAP within the invasive strands, which coincides with Collagen-I matrix alignment at the invasive front. Using gene set enrichment analysis, we identify immune cell-like migratory pathways in the single cell invading HNSCC PDO, while collective invasion is characterized by overt upregulation of adhesion and migratory pathways. Lastly, based on clinical head and neck cancer cohorts, we demonstrate that the identified collective invasion signature provides a candidate prognostic platform for survival in HNSCC. By uncoupling collective and single cell invasive programs, we have established invasion signatures that may guide new therapeutic options.


Conflict of interest statement

The authors declare no competing interests.

Figures

Fig. 1
Fig. 1. HNSCC PDOs serve as a platform to study modes of invasion.
A Modes of invasion found in HNSCC. Panel of HNSCC primary tissue sections depicting single cell/cord like invasion (T1), collective invasion (T4), single cell invasion (T5), and collective/ protrusive invasion (T8). Black arrows indicate observable invasion. Scale bars: 20 µm. B HNSCC PDOs recapitulate invasive pattern found in corresponding primary sections. Brightfield images of PDOs cultured in Matrigel for 6 days or seeded in Collagen-I gels and imaged over 3 days. Black arrows indicate invasive structures. Scale bars: 100 µm.
Fig. 2
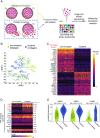
Fig. 2. Single cell mRNA sequencing reveals unique YAP and downstream target transcription profiles of HNSCC PDOs seeded in Collagen matrices.
A Schematic showing single cell mRNA sequencing of T4 and T5 HNSCC PDOs seeded in either Matrigel (termed ‘non-invasive’) or Collagen (termed ‘invasive’) and subsequent downstream analysis. B Single cell mRNA sequencing of collective and single cell models seeded in non-invasive or invasive matrix. A t-distributed stochastic neighbor embedding (t-SNE) plot was used to visualize the data. C Unique transcription profiles in invasive and non-invasive conditions. Top 20 differentially expressed (DE) markers associated with invasive and non-invasive conditions. Scaled expression displayed using a heatmap. Highlighted in red are established YAP-TEAD target genes. D Invasion into Collagen-I matrices in 3D leads to upregulation of YAP associated genes. Heatmap displays scaled expression of YAP/TAZ and their downstream targets of PDOs seeded in invasive and non-invasive conditions. Adjusted p value is displayed on the right. Highlighted in red are genes with a logFC ≥ 0.5. E Violin plots of significantly DE YAP downstream targets identified in invasive versus non-invasive HNSCC PDO models.
Fig. 3
Fig. 3. Distinct transcriptomic profiles define collective and single cell HNSCC PDO invasive models.
A Selected T4 (henceforth termed the ‘collective’ model) and T5 (henceforth termed the ‘single cell’ model) Collagen-embedded PDOs were immunofluorescence labeled with β-catenin (green), p63 (Basal marker; red). Merged image with DNA (blue) and Collagen-I (magenta) are shown in the right panel. Arrows indicate invasive strands or single cells in the respective models. Scale bars: 50 µm. B Data integration and dimensionality reduction of transcriptomic data from single cell and collective invasive models seeded in Collagen. A t-SNE plot was used to visualize the data. C Volcano plot of DE genes comparing single cell vs collective models. Vertical red lines indicate logFC ≥ 0.5 and logFC ≤ −0.5 cut-offs. Horizontal red line indicates adjusted p value cut-off (<0.001). Both aforementioned logFC and adjusted p value were designated as differentially expressed (DE) genes. Labeled are selected genes linked to invasion from literature. D GSEA identifies unique molecular pathways in single cell invasion model. Bar graph depicts biological processes enriched gene ontology (GO) terms in the single cell invasion model. X-axis displays genes and y-axis top 10 enriched pathways. Highlighted in yellow are pathways of interest. E GSEA identifies unique molecular pathways in the collective invasion model. Bar graph depicts biological processes enriched GO term in the collective invasion model. Highlighted in yellow are pathways significantly enriched.
Fig. 4
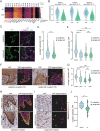
Fig. 4. Collective invasion shows activation of YAP in the invasive strand in HNSCC.
A Collective invasion in 3D leads to upregulation of YAP associated genes. Heatmap shows YAP/TAZ and downstream targets expression in collective (coll.) and single cell (sc.) invasion models. Adjusted p values are displayed above the heatmap. Highlighted in red are genes with a logFC ≥ 0.5. Signal intensity is indicated on the right. B Violin plots showing the significant DE YAP associated genes identified in collective versus single cell invasion. C Collective and single cell invasion models seeded in Collagen-I were Immunofluorescence labeled for YAP (green, left panels). Merged image with Collagen (purple) and DAPI (blue) and are shown in the right panels. Scale bars: 50 µm. D Quantification of nuclear-cytosolic ratios of YAP from 12 individual organoid structures in the collective and single cell invasive models shown in (C). E Nuclear-cytosolic ratios of YAP in collective strands or invasive single cells versus PDO cores (inner cell population) from both models. Blue represents the collective models and green the single cell invasive model. Twelve individual organoid structures were quantified. F, G YAP expression was assessed using IHC and the subcellular localization was analyzed and visualized using a pseudo color overlay of cellular mean YAP-DAB intensity at the tumor invasive front (YAP segmentation). Arrows indicate invasive structures. Signal intensity is indicated on the right. Scale Bars: 100 µm F The nuclear/cytosolic YAP ratio was quantified in five individual regions (62,500 µm2 each) per sample in the collectively invasive strands, single cells, or tumor core, in the respective models (G). HJ YAP activity is increased in collective HNSCC invasion. Representative examples from an independent cohort of collective (H) and single cell (I) invasive HNSCC samples were IHC stained for YAP protein expression and analyzed as in (F, G). Nuclear/cytosolic YAP ratios were quantified as in (F, G) for 10 collectively invading HNSCC samples and 10 invasive single cell HNSCC samples (J). Error bars (red dashed lines) indicate standard deviation; ns non-significant; **p < 0.01, ****p < 0.001. Statistical significance was calculated using the unpaired t test (D, J) or Kruskal–Wallis test (E, G).
Fig. 5
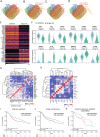
Fig. 5. High expression of the collective invasion signature associates with decreased patient survival in HNSCC.
A Publicly curated adhesion and motility gene-sets associate with model specific invasion. Venn diagram showing a total of 2014 GO cell motility and 1154 GO cell adhesion data sets, cross-compared with the number of DE genes derived from single cell versus collective invasive models. Venn diagrams showing enriched collective and single cell invasion genes that overlap with subdivision terms of ‘cell motility’ and ‘cell adhesion’: “positive regulation of cell migration’ and ‘amoeboid-like migration’ (B), ‘integrin adhesion’ and ‘ECM’ (C), ‘positive regulation of cell–cell adhesion’ and positive regulation of cell-substrate adhesion” (D). E Transcriptional signatures associated with collective and single cell invasion in HNSCC PDOs. Heatmap shows expression of overlapping DE genes associated with motility and adhesion GO terms for collective and single cell invasion. F Selected DE genes from either the collective (upper panel) or single cell (lower panel) signature. Violin graphs depict normalized expression on the y-axis and samples on the x-axis. G, H Single cell signature gene do not show clear cross-correlation with the head and neck cancer TCGA database whereas the collective signature reveals distinct cluster. Heatmaps depict hierarchical clustering to identify genes with strong cross-correlation patterns. G The collective gene signature was specified by selecting highly cross correlative genes. Clustered genes were selected for further analysis. H All single cell signature genes were used for further analysis as no clear cross correlation was determined. I, J High expression of the collective signature has prognostic value in HNSCC. Kaplan–Meier survival curves of collective (I, K) and single cell signature data (J) from head and neck cancer TCGA cohort (I, J, n = 438) and GSE65858 (K, n = 196). The two groups, defined by z-scores, were compared using a log-rank test. Survival curves depicts the probability of survival over time, where the x-axis represents time in days, and the y-axis indicates the proportion of patients who survived. Statistical significance was determined by p value calculation, showing any potential differences in OS between the two groups. Hazard ratios (HRs) and 95% confidence intervals for survival curves were calculated using a Cox proportional hazards model. Risk table was included, providing the number of patients at risk at different time points.

Similar articles

Cited by

References

    1. Curado MP, Hashibe M. Recent changes in the epidemiology of head and neck cancer. Curr Opin Oncol. 2009;21:194–200. 10.1097/CCO.0b013e32832a68ca - DOI - PubMed
    1. Kreimer AR, Clifford GM, Boyle P, Franceschi S. Human papillomavirus types in head and neck squamous cell carcinomas worldwide: a systematic review. Cancer Epidemiol Biomark Prev. 2005;14:467–75.10.1158/1055-9965.EPI-04-0551 - DOI - PubMed
    1. Cancer IC for OR (ICOR) in H and N, Ebrahimi A, Gil Z, Amit M, Yen TC, Liao CT, et al. Primary tumor staging for oral cancer and a proposed modification incorporating depth of invasion: an international multicenter retrospective study. Jama Otolaryngol Head Neck Surg. 2014;140:1138–48. 10.1001/jamaoto.2014.1548 - DOI - PubMed
    1. Eldeeb H, Macmillan C, Elwell C, Hammod A. The effect of the surgical margins on the outcome of patients with head and neck squamous cell carcinoma: single institution experience. Cancer Biol Med. 2012;9:29–33. - PMC - PubMed
    1. Bryne M, Boysen M, Alfsen CG, Abeler VM, Sudbø J, Nesland JM, et al. The invasive front of carcinomas. The most important area for tumour prognosis? Anticancer Res. 1998;18:4757–64. - PubMed

MeSH terms