. 2024 Jun 28;7(1):780.
doi: 10.1038/s42003-024-06478-x.

Single-cell transcriptional profiling of clear cell renal cell carcinoma reveals a tumor-associated endothelial tip cell phenotype

Affiliations

Single-cell transcriptional profiling of clear cell renal cell carcinoma reveals a tumor-associated endothelial tip cell phenotype

Justina Zvirblyte et al. Commun Biol. .

Abstract

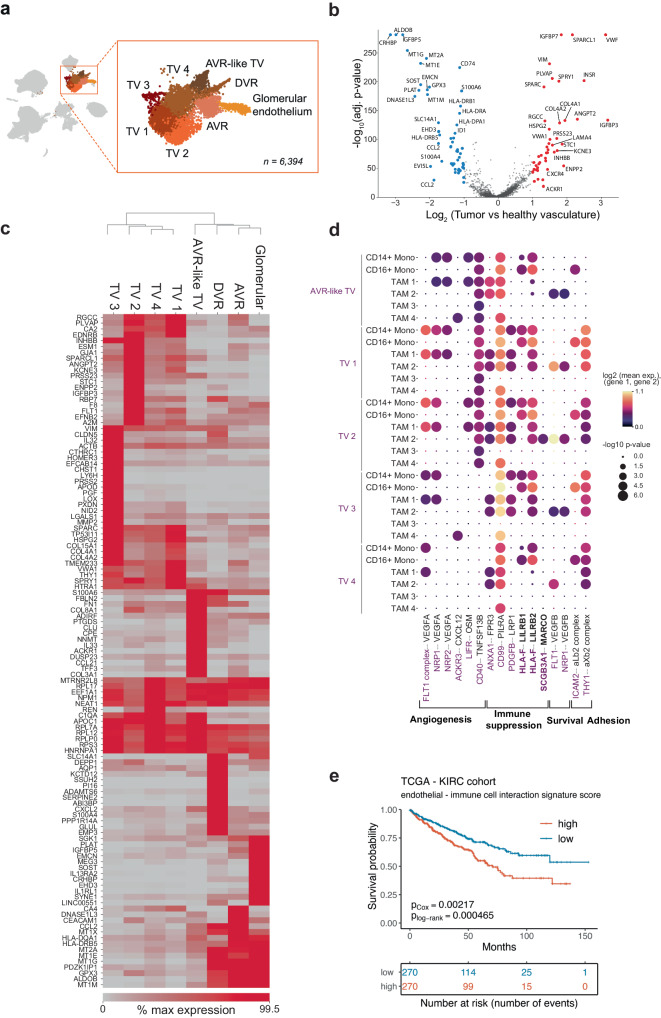
Clear cell renal cell carcinoma (ccRCC) is the most prevalent form of renal cancer, accounting for over 75% of cases. The asymptomatic nature of the disease contributes to late-stage diagnoses and poor survival. Highly vascularized and immune infiltrated microenvironment are prominent features of ccRCC, yet the interplay between vasculature and immune cells, disease progression and response to therapy remains poorly understood. Using droplet-based single-cell RNA sequencing we profile 50,236 transcriptomes from paired tumor and healthy adjacent kidney tissues. Our analysis reveals significant heterogeneity and inter-patient variability of the tumor microenvironment. Notably, we discover a previously uncharacterized vasculature subpopulation associated with epithelial-mesenchymal transition. The cell-cell communication analysis reveals multiple modes of immunosuppressive interactions within the tumor microenvironment, including clinically relevant interactions between tumor vasculature and stromal cells with immune cells. The upregulation of the genes involved in these interactions is associated with worse survival in the TCGA KIRC cohort. Our findings demonstrate the role of tumor vasculature and stromal cell populations in shaping the ccRCC microenvironment and uncover a subpopulation of cells within the tumor vasculature that is associated with an angiogenic phenotype.


Conflict of interest statement

The authors declare no competing interests.

Figures

Fig. 1
Fig. 1. Profiling the ccRCC microenvironment.
a Experimental design. b Global single cell transcriptional map of ccRCC. c Clinical information of collected samples and corresponding UMAPs of cells annotated by disease stage (adjacent healthy, pT1a and pT3a) and patient ID (P1–P9). Healthy adjacent samples (blue) almost completely separate from the tumor (light and dark red). d Sample composition by major cell type. Notably, healthy adjacent samples are enriched with specialized kidney epithelial and endothelial cells, while tumor samples are enriched for immune cells. e Expression of ccRCC cell of origin markers in epithelial progenitor-like cell population. f Global heatmap for population-specific markers. Only genes with Benjamini-Hochberg adjusted p value < 0.05 are shown. Color of the gene name indicates major cell type. AVR ascending vasa recta, DVR descending vasa recta, vSMCs vascular smooth muscle cells, LOH loop of Henle, tAL thin ascending limb, TAL thick ascending limb, DCT/CNT distal convoluted/connecting tubule, ICs intercalated cells, OM outer medullary, TAM tumor associated macrophages. All graphic elements in the figure were created by the first author.
Fig. 2
Fig. 2. Characterization of immune cell populations found in ccRCC.
a Myeloid cell compartment consists of CD14+ and CD16+ monocytes and four populations of tumor associated macrophages diverse in expression of polarization markers. b Lymphoid cells in ccRCC display heterogeneous exhaustion profile. c Immunosuppressive interactions of clinical importance revealed by cell-cell communication analysis between immune and tumor cells using CellPhoneDB. d Tumor-immune cell interaction signature expression in TCGA KIRC cohort is associated with a worse overall survival. e Tumor-immune cell interaction signature increases along the progression of the ccRCC disease.
Fig. 3
Fig. 3. Assessing the heterogeneity of tumor vasculature of ccRCC.
a A close-up of endothelial cell subpopulations. b Tumor and healthy vasculature comparison shows upregulation of angiogenesis related genes in tumor vasculature. c Differential gene expression between vasculature subpopulations. Only genes with Benjamini-Hochberg adjusted p value < 0.05 are shown. d Tumor endothelium and myeloid cells demonstrate abundant cell-cell interactions. e Collective tumor vasculature–immune cell communication signature expression is associated with a worse overall survival in TCGA KIRC dataset. AVR ascending vasa recta, DVR descending vasa recta, TV tumor vasculature.
Fig. 4
Fig. 4. MSigDB Hallmark pathway overrepresentation analysis.
a Tumor vasculature and stromal cell populations are enriched in epithelial-mesenchymal transition (EMT) signature. b Tumor AVR-like vasculature and c tip-like tumor vasculature 3 signature genes overlapping with EMT pathway associate with worse overall survival in the TCGA KIRC cohort.
Fig. 5
Fig. 5. Assessing the heterogeneity of stromal cells in the TME.
a Stromal cell populations consisting of vSMCs, myofibroblasts and mesangial/vSMCs. b Differential gene expression between stromal cell subpopulations. Only genes with Benjamini-Hochberg adjusted p value < 0.05 are shown. c Stromal and immune cells exhibit immunosuppressive interactions mediated by stromal cells. d Expression of collective stromal-immune cell interaction signature gene set associates with worse overall survival in the TCGA KIRC cohort. e Stromal-immune cell interaction signature expression increases along the progression of the ccRCC disease. vSMCs vascular smooth muscle cells.

References

    1. Hsieh JJ, et al. Renal cell carcinoma. Nat. Rev. Dis. Prim. 2017;3:17009. doi: 10.1038/nrdp.2017.9. - DOI - PMC - PubMed
    1. Dizman N, Philip EJ, Pal SK. Genomic profiling in renal cell carcinoma. Nat. Rev. Nephrol. 2020;16:435–451. doi: 10.1038/s41581-020-0301-x. - DOI - PubMed
    1. Cancer Genome Atlas Research N. Comprehensive molecular characterization of clear cell renal cell carcinoma. Nature. 2013;499:43–49. doi: 10.1038/nature12222. - DOI - PMC - PubMed
    1. Sato Y, et al. Integrated molecular analysis of clear-cell renal cell carcinoma. Nat. Genet. 2013;45:860–867. doi: 10.1038/ng.2699. - DOI - PubMed
    1. Senbabaoglu Y, et al. Tumor immune microenvironment characterization in clear cell renal cell carcinoma identifies prognostic and immunotherapeutically relevant messenger RNA signatures. Genome Biol. 2016;17:231. doi: 10.1186/s13059-016-1092-z. - DOI - PMC - PubMed

Publication types