. 2024 Aug;5(8):1267-1284.
doi: 10.1038/s43018-024-00784-3. Epub 2024 Jun 28.

The proteogenomic landscape of multiple myeloma reveals insights into disease biology and therapeutic opportunities

Affiliations

The proteogenomic landscape of multiple myeloma reveals insights into disease biology and therapeutic opportunities

Evelyn Ramberger et al. Nat Cancer. 2024 Aug.

Abstract

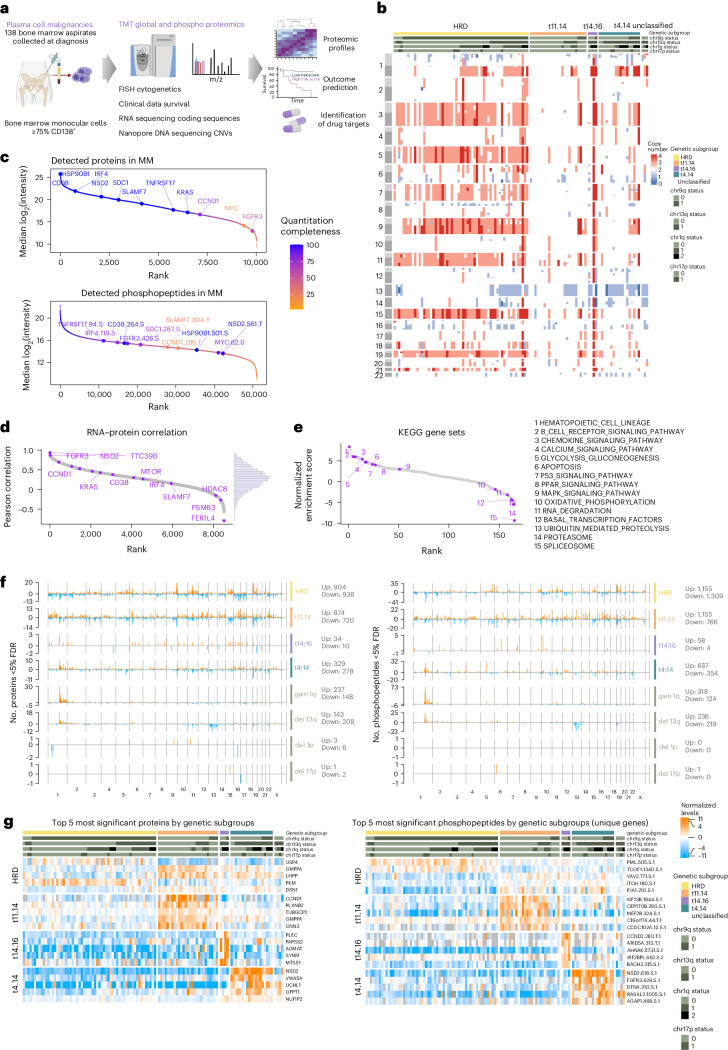
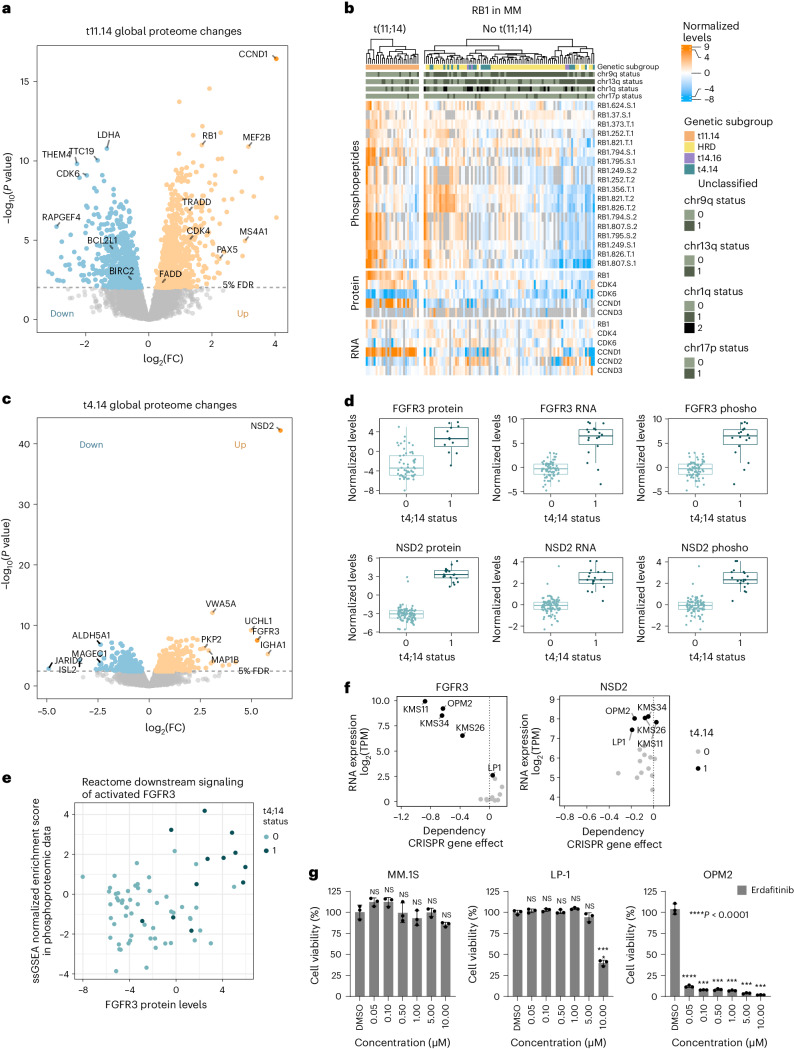
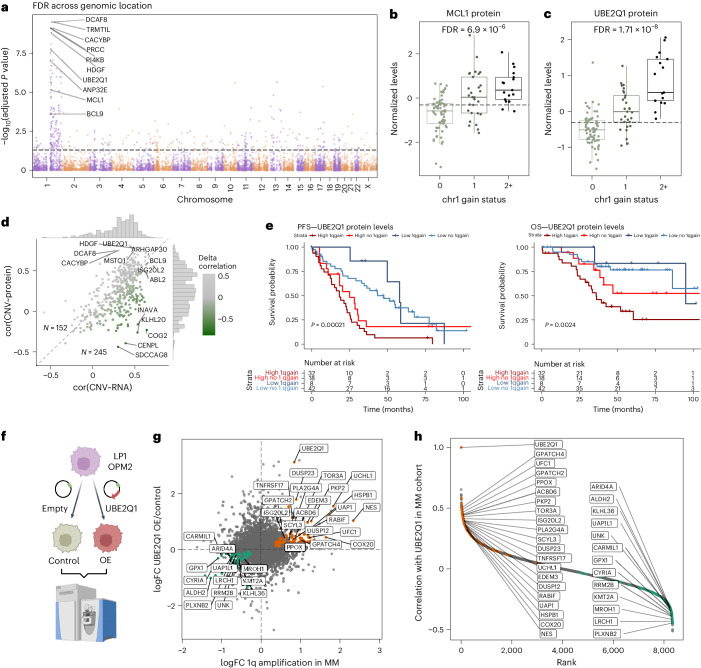
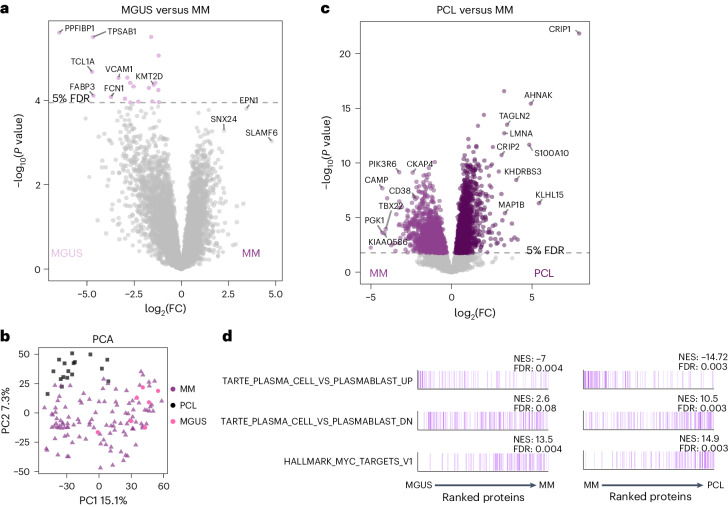
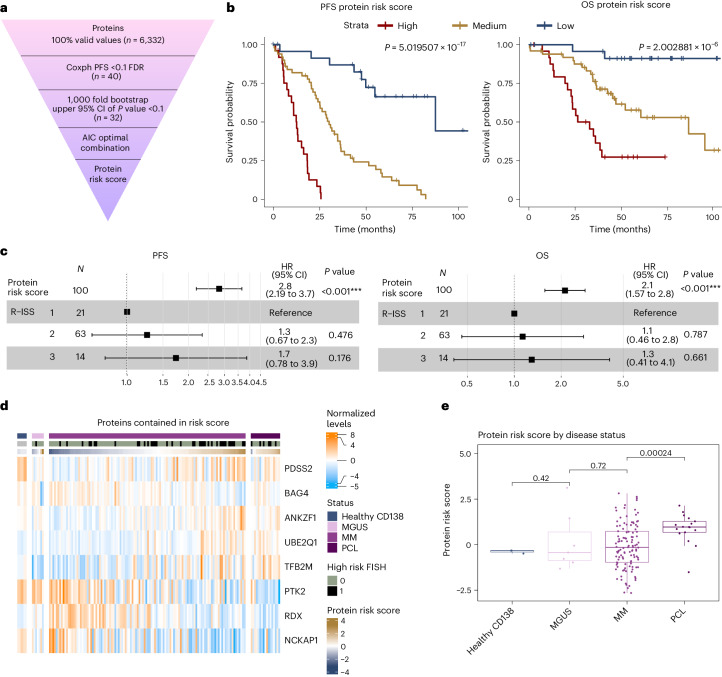
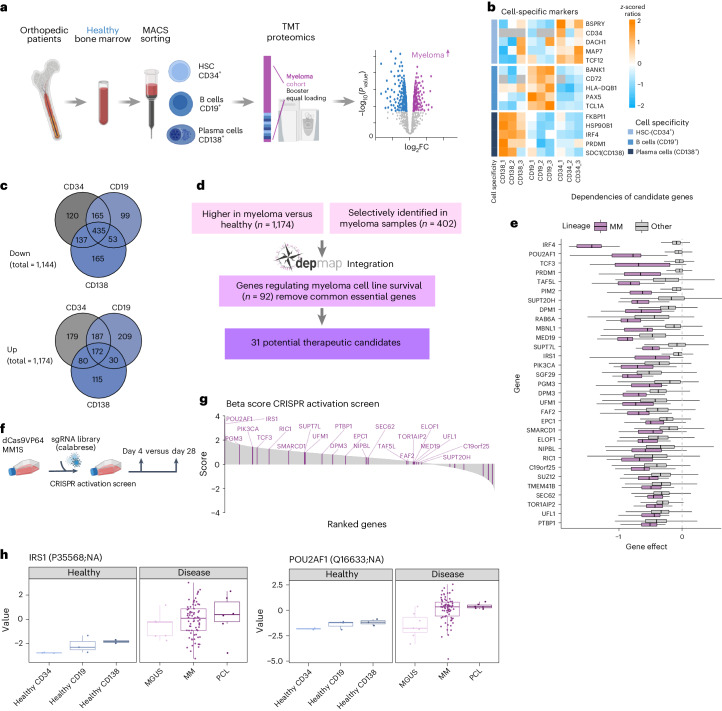
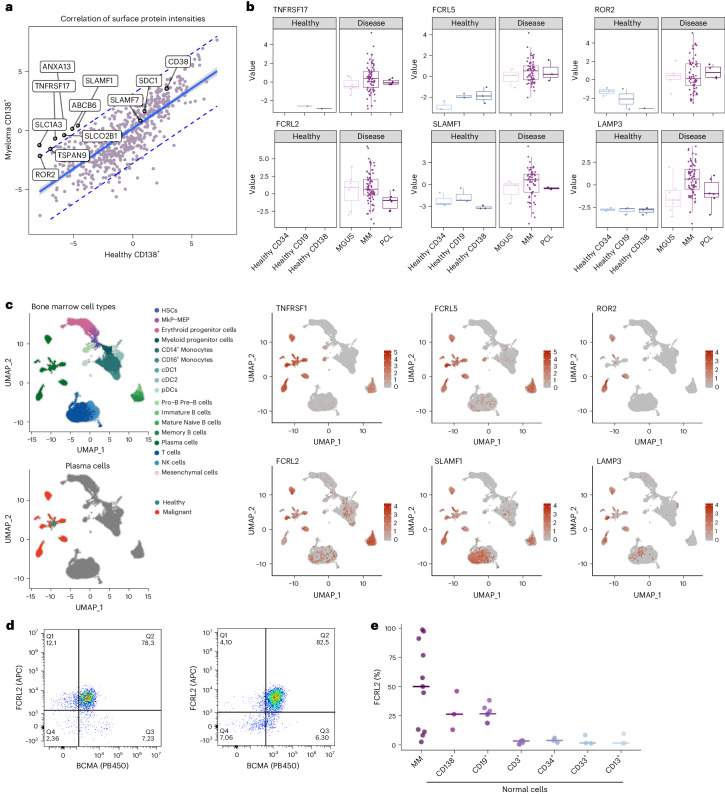
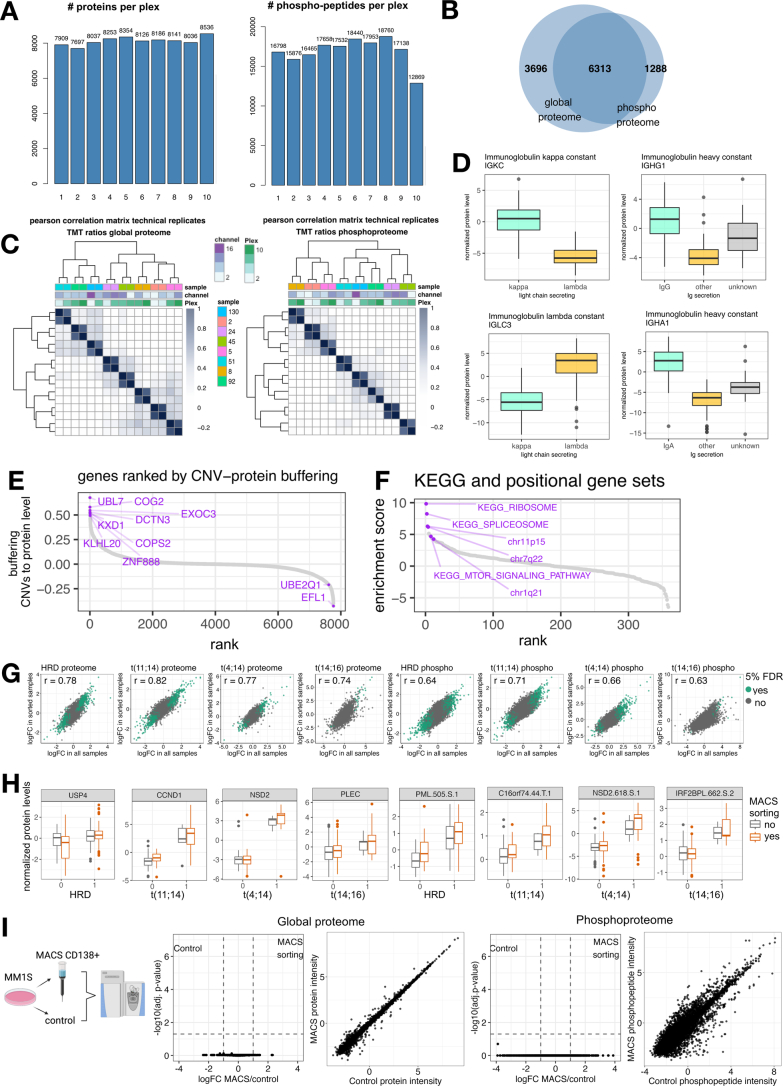
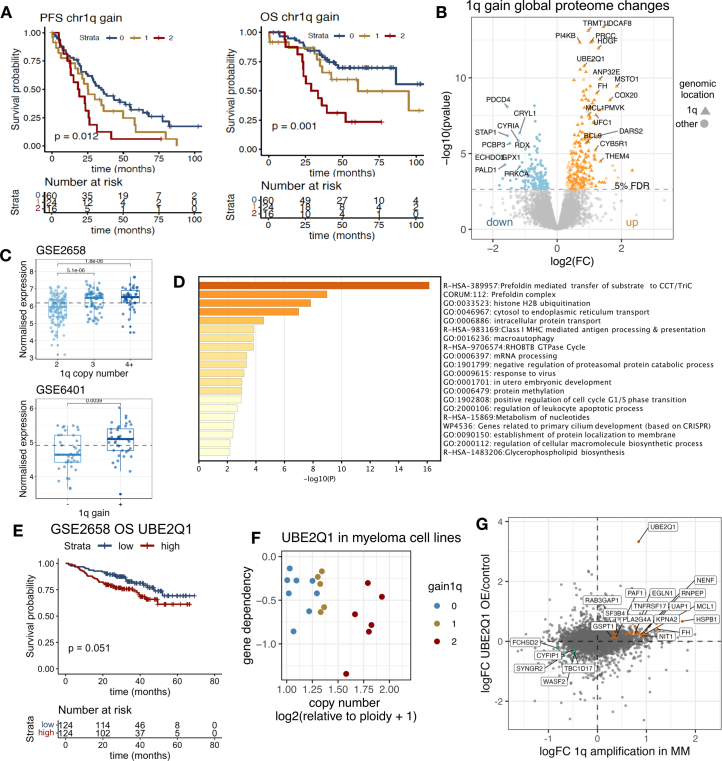
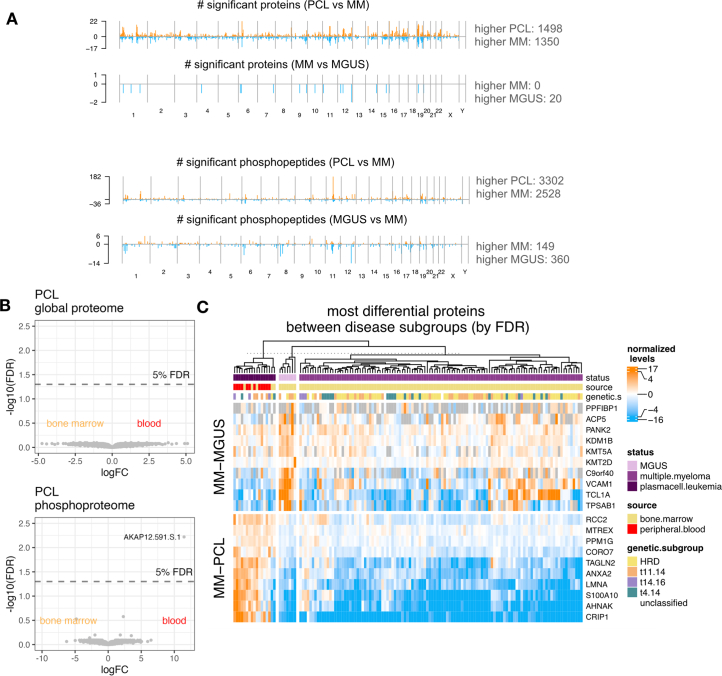
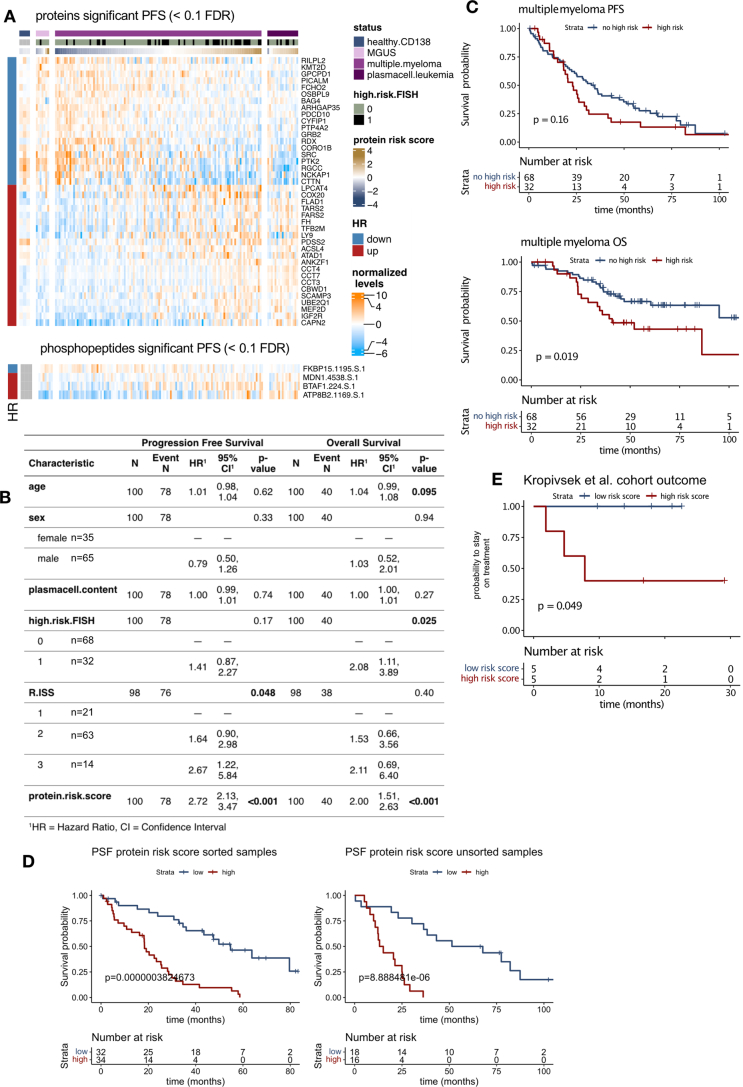
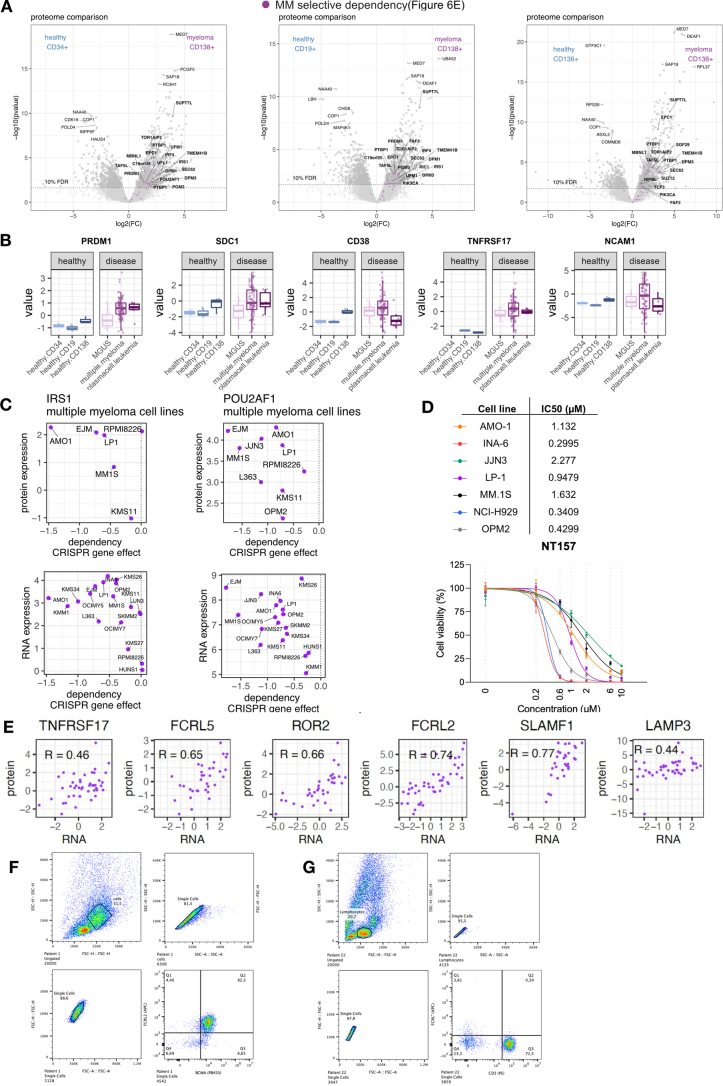
Multiple myeloma (MM) is a plasma cell malignancy of the bone marrow. Despite therapeutic advances, MM remains incurable, and better risk stratification as well as new therapies are therefore highly needed. The proteome of MM has not been systematically assessed before and holds the potential to uncover insight into disease biology and improved prognostication in addition to genetic and transcriptomic studies. Here we provide a comprehensive multiomics analysis including deep tandem mass tag-based quantitative global (phospho)proteomics, RNA sequencing, and nanopore DNA sequencing of 138 primary patient-derived plasma cell malignancies encompassing treatment-naive MM, plasma cell leukemia and the premalignancy monoclonal gammopathy of undetermined significance, as well as healthy controls. We found that the (phospho)proteome of malignant plasma cells are highly deregulated as compared with healthy plasma cells and is both defined by chromosomal alterations as well as posttranscriptional regulation. A prognostic protein signature was identified that is associated with aggressive disease independent of established risk factors in MM. Integration with functional genetics and single-cell RNA sequencing revealed general and genetic subtype-specific deregulated proteins and pathways in plasma cell malignancies that include potential targets for (immuno)therapies. Our study demonstrates the potential of proteogenomics in cancer and provides an easily accessible resource for investigating protein regulation and new therapeutic approaches in MM.


Conflict of interest statement

J.K. received speaker and/or advisory board honoraria from Bristol-Myers Squibb/Celgene, Sanofi, Abbvie, Takeda, Pfizer and Janssen. S.K. received honoraria from Amgen, Bristol-Myers Squibb, Celgene, Janssen, Takeda, Sanofi and Oncopeptides; served as a consultant or in an advisory role for Amgen, Bristol-Myers Squibb, Celgene, Janssen and Takeda; and received research funding from Amgen, Bristol-Myers Squibb, Celgene, Janssen and Takeda. The other authors declare no competing interests.

Figures

Fig. 1
Fig. 1. Proteogenomic landscape of newly diagnosed MM.
a, Overview of the proteogenomic study. b, A heat map of CNVs detected by nanopore sequencing in 109 cases of NDMM sorted by primary genetic subgroup: HRD, t(11;14), t(4;14) and t(14;16) translocations. Cytogenetic alterations, including deletions, amplifications and translocations were detected by FISH. c, Proteins and phosphopeptides detected by TMT-based mass spectrometry ranked by median intensity. d, Ranked gene symbol-wise Pearson correlation of mRNA–protein levels across MM samples (n = 8,511 RNA–protein pairs with at least ten valid values in both datasets). e, ssGSEA of the mRNA–protein correlations for KEGG pathways (n = 165 ranked pathways). Gene sets were ranked by their normalized enrichment score and informative pathways are annotated with purple circles. f, Differentially regulated proteins (left) and phosphopeptides (right) in each cytogenetic subgroup were determined with a two-sided, moderated two-sample t-test comparing subsets of samples against all other samples. The number of significant hits (FDR <0.05) in each group is plotted across genomic location. g, Heat maps displaying the five most significant proteins (left) and phosphopeptides (right) in each genetic subgroup across MM samples. For phosphopeptides mapping to the same protein, only the most significant entry is displayed. Phosphopeptides are annotated with gene name, position, amino acid and number of phosphorylations present. Source data
Fig. 2
Fig. 2. (Phospho)proteomic profiles of primary translocations t(11;14) and t(4;14).
a, Global protein levels in newly diagnosed MM cases with t(11;14) (n = 27) were compared against cases without t(11;14) (n = 87) with a two-sided, moderated two-sample t-test. The log2 fold change (FC) of each protein is plotted against its P value. P values were adjusted with the Benjamini–Hochberg method and the significance threshold of 0.05 FDR is indicated. b, The heat map displays the normalized expression of RB1, CDK4, CDK6, CCND1, CCND2 and CCND3 on RNA and protein level and RB1 phosphopeptides. Phosphopeptides are annotated with protein name, position, amino acid and number of phosphorylations. c, Global protein levels in cases with t(4;14) (n = 19) were compared against other MM cases (n = 95) with a two-sided, moderated two-sample t-test. The log2FC of each protein is plotted against its P value. P values were adjusted with the Benjamini–Hochberg method and the significance threshold of 0.05 FDR is indicated. d, Protein, phosphoprotein and RNA expression levels of FGFR3 and NSD2 in samples with (n = 19) or without t(4;14) (n = 95). For phosphopeptide data, the peptide with the least missing values was selected for a graphical representation (FGFR3.S.425; NSD2.S.618). FDRs of the comparison between the two groups are indicated. Box plots show median (middle line), 25th and 75th percentiles, whiskers extend to minimum and maximum excluding outliers (values greater than 1.5× interquartile range (IQR)). e, FGFR3 protein levels in MM samples are plotted against the ssGSEA normalized enrichment score of the Reactome gene set ‘Downstream signaling of activated FGFR3 in phosphoproteomic data’. Normalized TMT ratios in each sample were used as input for ssGSEA. f, FGFR3 and NSD2 RNA expression and CRISPR–Cas9 KO screening data in MM cell lines were extracted from the depmap portal (depmap.org). RNA expression is plotted against the CRISPR KO gene effect. g, Cell viability of MM cell lines after treatment with FGFR3 inhibitor erdafitinib for 96 h at indicated concentrations (n = 3, independent replicates). Data are plotted as mean ± s.d. Drug treatments of each cell line were compared to respective DMSO controls with a Dunnett’s test. ****P value < 0.0001. Exact P values listed in the source table. Source data
Fig. 3
Fig. 3. Identification of UBE2Q1 as a candidate protein for the aggressive phenotype of MM with gain/amp of chromosome 1q.
a, Global protein levels in MM samples with 1q copy number gain (n = 46) were compared against all other samples (n = 68) with a two-sided, moderated two-sample t-test. The −log10(FDR) of each protein is plotted across genomic location. The significance threshold of 0.05 FDR is indicated. b, MCL1 protein levels in patients with MM grouped by 1q gain status. FDR for the comparison 1q gain versus no 1q gain is indicated (0: n = 68; 1: n = 29; 2+: n = 17). Box plots show median (middle line), 25th and 75th percentiles, whiskers extend to minimum and maximum excluding outliers (values greater than 1.5× IQR). c, UBE2Q1 protein levels in patients with MM grouped by 1q gain status. FDR for the comparison 1q gain versus no 1q gain is indicated (0: n = 68; 1: n = 29; 2+: n = 17). Box plot shows median (middle line), 25th and 75th percentiles, whiskers extend to minimum and maximum excluding outliers (values greater than 1.5× IQR). d, Genes located on chromosome 1q with at least ten valid value pairs in all datasets (RNA, DNA and protein) were extracted (n = 397 genes). The Pearson correlation coefficient of copy number determined by nanopore sequencing with RNA expression level (cor(CNV~RNA)) is plotted against the Pearson correlation coefficient of copy number with protein expression level (cor(CNV~protein). e, Kaplan–Meier plots show survival of patients grouped by UBE2Q1 protein levels (median) and 1q gain status. Survival in the different groups is compared by a log rank test. f, UBE2Q1 was overexpressed in LP1 and OPM2 cell lines. Empty vectors were used as a control. Cell lines were analyzed with label-free DIA proteomics (n = 4, biological replicates). g, Correlation of protein FCs in 1q gain myeloma patients (x axis) and UBE2Q1 overexpressing LP1 cells compared with control (y axis). Proteins regulated in LP1 cells (<0.05 FDR) and patients with MM with 1q gain (<0.1 FDR) and correlating with UBE2Q1 protein levels in myeloma cohort (r > 0.3 or r < −0.3) are indicated. h, Correlation analysis of UBE2Q1 with all other protein levels in newly diagnosed MM. Proteins are ranked by their Pearson correlation coefficient. The same proteins as in g are highlighted. Source data
Fig. 4
Fig. 4. Proteome profiles of MGUS and PCL.
a, Global protein levels in newly diagnosed MM samples (n = 114) were compared with those in premalignant MGUS samples (n = 7) with a two-sided, moderated two-sample t-test. The log2FC of each protein is plotted against its P value. P values were adjusted with the Benjamini–Hochberg method and the significance threshold of 0.05 FDR is indicated. b, PCA of global proteome data of newly diagnosed MM, MGUS and PCL samples. c, Global protein levels in MM samples (n = 114) were compared against PCL (n = 17) with a two-sided, moderated two-sample t-test. The log2 fold change of each protein is plotted against its P value. P values were adjusted with the Benjamini–Hochberg method and the significance threshold of 0.05 FDR is indicated. d, The mean log2 fold change of proteins in MM versus MGUS or PCL versus MM or samples was used as input for an ssGSEA analysis. The plot shows proteins ordered by their rank; proteins belonging to the respective gene set are marked by color. The normalized enrichment score (NES) and FDR of each gene set are indicated. Source data
Fig. 5
Fig. 5. A proteomic risk score predicts outcome in NDMM.
a, The workflow for the generation of a proteomic risk score in patients with NDMM who received a lenalidomide-based intensive treatment within clinical trials (n = 100). b, Kaplan–Meier plots show PFS and OS for patients according to the protein risk signature score divided by lowest quartile (low, n = 25), second and third quartile (medium, n = 50) and highest quartile (high, n = 25). Survival in the different groups is compared by the log rank test. c, Multivariable Cox regression analysis for PFS and OS including the protein risk score as continuous variable (hazard ratio (HR) per 1 point increase) and R-ISS. Data are represented as hazard ratio with 95% confidence interval (CI). Significance was tested with a Wald test. d, Expression of proteins contained in the protein high-risk score across samples from healthy donors, patients with premalignancy MGUS, MM and PCL. e, Protein risk score values calculated for the proteome data of healthy plasma cells, MGUS, MM and PCL samples. P values from a two-sided Student’s t-test are indicated. Healthy CD138: n = 3; MGUS: n = 7; MM: n = 114; PCL: n = 17. Box plots show median (middle line), 25th and 75th percentiles, whiskers extend to minimum and maximum excluding outliers (values greater than 1.5× IQR). Source data
Fig. 6
Fig. 6. Integrated proteomic and genetic screens reveal drivers of MM cell growth.
a, Hematopoietic cell populations were sorted using MACS enrichment for the surface markers CD34 (hematopoietic stem and progenitor cells (HSCs)), CD19 (B cells) and CD138 (plasma cells) from bone marrow of individuals without hematologic malignancy (n = 3). Proteins were quantified via TMT with a booster channel approach. Booster and equal loading control were identical to the internal standard used for TMT analysis of cohort samples. b, Protein levels of cell lineage-specific markers in healthy samples. z-scored TMT ratios are displayed. c, Proteins in MACS sorted healthy bone marrow and CD138+ sorted MM samples were compared with a two-sided, moderated two-sample t-test. P values were adjusted with the Benjamini–Hochberg method. The total number of regulated proteins is indicated, the Venn diagrams show overlap of up- and downregulated proteins in MM samples compared with healthy samples (FDR < 0.1). d, Data analysis workflow to identify potential therapeutic candidates from myeloma upregulated or specifically expressed proteins. e, Gene dependency scores from CRISPR–Cas9 KO screening data from the depmap portal. The gene effect of potential therapeutic targets in myeloma (n = 18) and other cell lines (n = 1,082) is displayed. The RNA to protein correlation in myeloma cohort is indicated for each candidate gene. Box plot shows median (middle line), 25th and 75th percentiles, whiskers extend to minimum and maximum excluding outliers (values greater than 1.5× IQR). f, The workflow for a genome-wide CRISPR–Cas9 activation screen using the Calabrese library performed in the MM cell line MM.1S. g, Gene effect on proliferation ranked by beta score. A higher beta score indicates expansion of cells carrying the indicated sgRNAs. The MAGeCK MLE algorithm was applied for the analysis of beta scores and P values. Potential targets identified by proteomic analysis are marked in purple. h, Protein levels of IRS1 and POU2AF1 across healthy and malignant cell populations. Healthy CD138: n = 3; healthy CD19: n = 3, healthy CD34: n = 3; MGUS: n = 7; MM: n = 114; PCL: n = 17. Box plot shows median (middle line), 25th and 75th percentiles, whiskers extend to minimum and maximum excluding outliers (values greater than 1.5× IQR). Source data
Fig. 7
Fig. 7. Identification of surface proteins on MM cells.
a, The identified surface proteins from the healthy to disease comparison were extracted by integrating proteomics data with the cancer surfaceome atlas. The plot shows the correlation of median-normalized raw intensities of surface proteins in CD138+ sorted MM and healthy bone marrow samples. The 95% confidence interval is indicated with a blue line, the 95% prediction interval is indicated with dashed blue lines. b, Protein levels of selected surface proteins in healthy hematopoietic cells and malignant plasma cells. Healthy CD138: n = 3; healthy CD19: n = 3, healthy CD34: n = 3; MGUS: n = 7; MM: n = 114; PCL: n = 17. Box plot shows median (middle line), 25th and 75th percentiles, whiskers extend to minimum and maximum excluding outliers (values greater than 1.5× IQR). c, UMAP plots showing single-cell RNA sequencing data of bone marrow from healthy and patients with MM. Cells are colored by cell type, malignancy status or by normalized RNA expression levels of selected surface proteins. d, FACS analysis of BCMA (TNFRSF17) (x axis) and FCRL2 (y axis) expression in MM samples. Two representative examples of patients with MM with high FCRL2 expression were selected. e, The percentage of FCRL2-positive cells in MM cells and minimal to no expression in other normal hematologic cell populations, n = 19. MkP, megakaryocyte progenitor; MAP, megakaryocyte/erythrocyte progenitor; DC, dendritic cell; NK, natural killer. Source data
Extended Data Fig. 1
Extended Data Fig. 1. Quality control and influence of cell sorting.
a: Numbers of proteins and phosphopeptides detected in each TMT plex. b: Overlap of detected protein IDs in the proteome and phosphoproteome datasets. c: Correlation matrix showing Pearson correlation of technical replicates (normalized TMT ratios). d: Immunoglobulin constant light chain protein levels. Predominant light chain kappa n = 83, lambda n = 39. Predominant immunoglobulin constant IgG n = 68, IgA n = 32; other n = 24, unknown n = 14. Boxplots show median (middle line), 25th and 75th percentiles, whiskers extend to minimum and maximum excluding outliers (values outside of 1.5 times the interquartile range (IQR)). e: Genes ranked by the buffering score of CNVs from RNA to protein level. The buffering score was calculated with a customized score and for each gene (g) the Pearson correlation of protein to copy number (CN) was subtracted from the Pearson correlation of RNA to CN. The resulting delta was corrected with the average copy number effect diverging from a diploid genotype. Genes are ranked from highest (high buffering of CNVs from RNA to protein level) to lowest score. f: SsGSEA of the protein-CNV buffering score in S1E for KEGG and positional pathways (n = 359 ranked pathways) showing that CNVs of certain pathways are buffered from RNA to protein level. g: Correlation of protein and phosphopeptides changes in each genetic subgroup in all samples (x-axis) and MACS-sorted samples (y-axis) in MM cohort. Regulated proteins (< 0.05 FDR) are indicated in green. h: Levels of top-regulated proteins and phosphopeptides in each genetic subgroup in MM samples with and without MACS sorting. HRD sorted n = 35, HRD unsorted n = 25, HRDneg sorted n = 41, HRDneg unsorted n = 13; t(11.14) sorted n = 24, t(11.14) unsorted n = 3, t(11.14)neg sorted n = 52, t(11.14)neg unsorted n = 35; t(14.16) sorted n = 3, t(14.16) unsorted n = 1, t(14.16)neg sorted n = 73, t(14.16)neg unsorted n = 37; t(t4.14) sorted n = 11, t(t4.14) unsorted n = 8, t(t4.14)neg sorted n = 65, t(t4.14)neg unsorted n = 30; Boxplots show median (middle line), 25th and 75th percentiles, whiskers extend to minimum and maximum excluding outliers (values outside of 1.5*IQR). i: MM1S cells were sorted with CD138 + MACS and the global proteome and phosphoproteome were analyzed with label-free proteomics (n = 4, biological replicates). MACS-sorted samples were compared against the control with a moderated 2-sample t-test. No significant differences between MACS-sorted and non-sorted MM.1S cells were detected (< 0.05 FDR). Plots show results of moderated 2-sample t-test and correlation of averaged normalized intensities in both groups. Source data
Extended Data Fig. 2
Extended Data Fig. 2. Unsupervised clustering of phosphoproteomic data.
a: SsGSEA normalized enrichment scores of phosphoproteomic data were used as input for non-negative matrix factorization (NMF) clustering. NMF consensus map is shown. b: Kaplan-Meier plots show progression-free survival (PFS) and overall survival (OS) of MM patients grouped by consensus cluster as shown in A. Survival in different groups was compared with a log-rank test. c: Gene sets of phosphoproteomic data most significantly different between consensus cluster 4 and other clusters (moderated t-test, the 20 most significant gene sets (FDR < 0.05) are shown). d: TMT ratios were analyzed with ssGSEA using the gene sets C2.all.v7.0.symbols.gmt, c6.all.v7.0.symbols.gmt and h.all.v7.0.symbols.gmt. Heatmaps display ssGSEA normalized enrichment scores (NES) of Zhan et al. gene sets significant between myeloma genetic subgroups (ANOVA; FDR < 0.14). Global proteome data (top) and phosphoproteome data (bottom) are shown. Source data
Extended Data Fig. 3
Extended Data Fig. 3. Protein level changes in multiple myeloma patients with translocations t(11;14) and t(4;14).
a: Significantly regulated proteins in t(11;14) (FDR < 0.05) with the GO term annotation apoptosis. b: Levels of proteins involved in venetoclax response in patients with (n = 27) and without (n = 87) t(11;14). FDR is indicated. Boxplot shows median (middle line), 25th and 75th percentiles, whiskers extend to minimum and maximum excluding outliers (values greater than 1.5 times the interquartile range). c: Protein levels of selected B cell markers and genes in CD2 gene set in patients with (n = 27) and without (n = 87) t(11;14). FDR is indicated. Boxplot shows median (middle line), 25th and 75th percentiles, whiskers extend to minimum and maximum excluding outliers (values greater than 1.5 times the interquartile range). d: Schematic representation of the chromosomal locus on 4p16 affected by t(4;14). e: Levels of the most regulated proteins in t(4;14) samples (top 20 by FDR). Row annotation: dots indicate proteins located on chromosome 4. f: Normalized FGFR3 RNA levels in t(4;14) patients with (n = 13) or without (n = 7) FGFR3 protein detection. FDR is indicated. Boxplot shows median (middle line), 25th and 75th percentiles, whiskers extend to minimum and maximum excluding outliers (values greater than 1.5 times the interquartile range). Source data
Extended Data Fig. 4
Extended Data Fig. 4. Proteins deregulated in hyperdiploid myeloma.
a: Global protein levels in HRD samples without translocation were compared against all other samples with a 2-sided, moderated 2-sample t-test. The log2 of fold change of each protein is plotted against its p-value. P-values were adjusted with the Benjamini-Hochberg method and the significance threshold of 0.05 FDR is indicated. b: Log2 fold changes of proteins in HRD samples mapped to the chromosomal location. Line indicates smoothed conditional mean. The 15 most significantly regulated proteins in HRD samples are indicated by gene name. c: Protein levels (normalized TMT ratios) of the most regulated proteins in HRD samples (top 20 by FDR). d: Normalized TMT ratios were used as input for an ssGSEA with the gene sets C2.all.v7.0.symbols.gmt, c6.all.v7.0.symbols.gmt and h.all.v7.0.symbols.gmt. Normalized enrichment scores in HRD samples were compared against HRD samples with a 2-sided, moderated 2-sample t-test. The most 10 most up and down regulated significant gene sets (< 0.05 FDR) are displayed. Source data
Extended Data Fig. 5
Extended Data Fig. 5. Proteins deregulated in del13q, del1p and del17p myeloma.
a: Global protein levels in del13q samples were compared against all other samples with a 2-sided, moderated 2-sample t-test. The log2 of fold change of each protein is plotted against its p-value. P-values were adjusted with the Benjamini-Hochberg method and the significance threshold of 0.05 FDR is indicated. Proteins located on 13q are indicated with a triangle. b: Protein levels of the most regulated proteins in del13q samples (top 20 by FDR). Row annotation indicates proteins located on chromosome 13q. c: Global protein levels in del1p samples were compared against all other samples with a 2-sided, moderated 2-sample t-test. The log2 of fold change of each protein is plotted against its p-value. P-values were adjusted with the Benjamini-Hochberg method and the significance threshold of 0.05 FDR is indicated. Proteins located on 1p are indicated with a triangle. d: Protein levels of significantly regulated proteins in del1p samples. Row annotation indicates proteins located on chromosome 1p. e: Global protein levels in del17p samples were compared against all other samples with a 2-sided, moderated 2-sample t-test. The Log2 of fold change of each protein is plotted against its p-value. P-values were adjusted with the Benjamini-Hochberg method and the significance threshold of 0.05 FDR is indicated. Proteins located on chromosome 17p are indicated with a triangle. f: RNA, protein, and phosphoprotein levels of TP53 and FXR2 in samples with (n = 12) and without (n = 102) del17p. Boxplot shows median (middle line), 25th and 75th percentiles, whiskers extend to minimum and maximum excluding outliers (values greater than 1.5*IQR). Source data
Extended Data Fig. 6
Extended Data Fig. 6. Influence of 1q amplifications on the proteome.
a: Kaplan-Meier plot showing progression free and overall survival of myeloma patients stratified by chr1q gain (n = 100 patients). P-values were calculated with a log-rank test. b: Global protein levels in multiple myeloma samples with 1q copy number gain (n = 46) were compared against all other samples (n = 68) with a 2-sided, moderated 2-sample t-test. The log2 of fold change of each protein is plotted against its p-value. Proteins located on 1q are denoted with a triangle. P-values were adjusted with the Benjamini-Hochberg method and the significance threshold of 0.05 FDR is indicated. c: MCL1 RNA expression in multiple myeloma extracted from microrarray datasets GSE2658 (2: n = 134; 3: n = 70, 4 + : n = 44) and GSE6401 (1q gain n = 40, no 1q gain n = 37). Boxplot shows median (middle line), 25th and 75th percentiles, whiskers extend to minimum and maximum excluding outliers (values greater than 1.5 *IQR). The levels of MCL1 were compared by the two-sided t-test, p-values are indicated above the boxplots. P-values are adjusted using Bonferroni correction. d: Metascape GO term enrichment of proteins upregulated in 1q samples (< 0.05 FDR) that are not located on 1q. e: UBE2Q1 expression was extracted from Zhan et al. Microarray dataset (GSE2658). Kaplan-Meier plot shows overall survival of myeloma patients stratified by median UBE2Q1 expression. Survival in the groups is compared by the log rank test. f: Multiple myeloma cell line dependency data extracted from the depmap portal. The DNA copy number of UBE2Q1 is plotted against the genetic dependency. 1q copy number gains are indicated by color. g: Correlation of protein fold changes in 1q gain myeloma patients (x-axis) and UBE2Q1 overexpressing OPM2 compared to control (y-axis). Proteins regulated in OPM2 (<0.05 FDR) and in 1q patients (< 0.1 FDR) are indicated by color. Source data
Extended Data Fig. 7
Extended Data Fig. 7. Differential protein levels in plasma cell leukemias indicate a highly proliferative phenotype.
a: Global protein or phosphopeptide levels in multiple myeloma samples (n = 114) were compared against MGUS (n = 7) or plasma cell leukemia (n = 17) samples with a 2-sided, moderated 2-sample t-test. P-values were adjusted with the Benjamini-Hochberg method. Significant (< 0.05 FDR) proteins or phosphopeptides in each comparison are plotted across their genomic location. b: Global protein levels in plasma cell leukemia samples isolated from blood (n = 12) or bone marrow (n = 5) were compared with a 2-sided, moderated 2-sample t-test. The log2 of fold change of each protein is plotted against its p-value. P-values were adjusted with the Benjamini-Hochberg method and the significance threshold of 0.05 FDR is indicated. Bottom plot shows the same analysis for phosphoproteomic data. c: Heatmap displays normalized levels of the most significantly regulated proteins between MM and PCL or MM and MGUS (by FDR). Source data
Extended Data Fig. 8
Extended Data Fig. 8. Proteins and phosphopeptides associated with outcome.
a: Fully quantified proteins and phosphopeptides were investigated for their correlation with progression-free survival with a univariate Cox regression analysis as a continuous variable. The resulting p-values were subjected to multiple testing control with Benjamini-Hochberg. Normalized expression levels of proteins and phosphopeptides passing the 0.1 FDR cutoff are plotted as a heatmap. Row annotation indicates hazard ratios > 1 (up) or < 1 (down). b: Table showing the impact of clinical parameters and protein risk score on progression-free survival (PFS) and overall survival (OS). P-values were calculated with univariate Cox regression analysis. c: Kaplan-Maier plots showing PFS and OS curves of patients with (blue) and without (red) at least one high-risk FISH marker (del(17p), t(4;14), +1q21). P-values were calculated with a log-rank test. Patients treated within the DSMM clinical trials that received a lenalidomide-based induction therapy followed by high-dose melphalan/autologous hematopoietic stem cell transplantation and lenalidomide maintenance were included (n = 100) in the survival analysis. d: Kaplan-Meier plots showing progression-free survival (PFS) for patients according to the protein risk signature score in samples with and without CD138 MACS sorting. Survival in the groups is compared by the log rank test. e: Proteomics data was extracted from Kropvisek et al. and protein risk score was calculated for untreated myeloma patients (n = 10). Kaplan-Meier plot shows time to the next treatment or death for myeloma patients stratified by median risk score. Survival in the groups is compared by the log rank test. Source data
Extended Data Fig. 9
Extended Data Fig. 9. Comparison of multiple myeloma with healthy bone marrow reveals potential therapeutic targets.
a: Global protein levels of multiple myeloma samples (MACS sorted samples only, n = 76) and healthy bone marrow cells sorted for CD138+ (plasma cells, n = 3), CD19+ (B cells, n = 3) and CD34+ (HSC, n = 3) were compared with a 2-sided, moderated 2-sample t-test. The log2 of fold change of each protein is plotted against its p-value. P-values were adjusted with the Benjamini-Hochberg method and the significance threshold of 0.1 FDR is indicated. Data was integrated with the depmap database and potential therapeutic targets (Fig. 6d) are indicated as purple stars. b: Protein levels of selected plasma cell-specific proteins in healthy and disease samples. Healthy CD138: n = 3; healthy CD19: n = 3, healthy CD34: n = 3; MGUS: n = 7; MM: n = 114;. PLC: n = 17. Boxplot shows median (middle line), 25th and 75th percentiles, whiskers extend to minimum and maximum excluding outliers (values greater than 1.5 *IQR). c: Protein (top) or RNA (bottom) expression of IRS1 and POU2AF1 in multiple myeloma cell lines plotted against genetic dependency. Data was extracted from the depmap database and Goncalves et al. d: Cell viability of multiple myeloma cell lines treated for 96 h with the IRS1 inhibitor NT157 in biological triplicates. Concentration is indicated in µM. Data is represented as mean ± standard deviation. e: RNA to protein correlation of selected surface markers in myeloma samples displayed in Fig. 7. f and g: Representative plot showing gating strategy for the FACS analysis in Fig. 7d–f: Multiple myeloma cells, G: non-malignant cells on example of T cells. Source data

References

    1. van de Donk, N. W. C. J., Pawlyn, C. & Yong, K. L. Multiple myeloma. Lancet397, 410–427 (2021). - PubMed
    1. Manier, S. et al. Genomic complexity of multiple myeloma and its clinical implications. Nat. Rev. Clin. Oncol.14, 100–113 (2017). - PubMed
    1. Zhan, F. et al. The molecular classification of multiple myeloma. Blood10.1182/blood-2005-11-013458 (2006). - PMC - PubMed
    1. Shaughnessy, J. D. Jr et al. A validated gene expression model of high-risk multiple myeloma is defined by deregulated expression of genes mapping to chromosome 1. Blood109, 2276–2284 (2007). - PubMed
    1. Lohr, J. G. et al. Widespread genetic heterogeneity in multiple myeloma: implications for targeted therapy. Cancer Cell25, 91–101 (2014). - PMC - PubMed

Publication types